
Growth restriction in preterm infants has been related to a poor neurodevelopment outcome.
ObjectivesTo define the incidence of postnatal growth restriction in premature babies ≤1500 g and to detect related clinical or biochemical markers.
MethodsRetrospective longitudinal observational study. Multivariate linear regression models were used to determine variables that can predict the change in weight z-score during admission.
ResultsThe study included 130 patients with a mean birthweight of 1161±251g and a gestational age of 29.9±2.5 weeks. At hospital discharge, 59.2% had a weight below P10. During admission, the z-scores of weight and length decreased by −0.85±0.79 and −1.09±0.65, respectively. The largest decrease in z-score occurred during NICU admission, with a weight gain rate of 6.6±8.8g/kg/day, after which growth acceleration took place (16.7±3.8g/kg/day), but was insufficient to catch-up. Higher levels of urea were negatively correlated with the change in the z-score of weight (P<.001), and a weightP=.013).
ConclusionsMore than half of newborns ≤1500g have a weight at discharge of
La restricción al crecimiento en recién nacidos prematuros se ha relacionado con un peor neurodesarrollo a largo plazo.
ObjetivosDefinir la incidencia de la restricción del crecimiento posnatal en prematuros ≤1500gramos y detectar qué marcadores clínicos o bioquímicos se relacionan con la misma.
MétodosEstudio observacional longitudinal retrospectivo. Se utilizaron modelos de regresión lineal multivariante para determinar qué variables permiten predecir el cambio en el z-score de peso durante el ingreso.
ResultadosSe incluyeron 130 pacientes, con un peso medio al nacer de 1161±251g y una edad gestacional de 29,9±2,5 semanas. Al alta hospitalaria el 59,2% tenía un peso<P10. Durante el ingreso los z-score de peso y longitud descendieron una media de –0,85±0,79 y –1,09±0,65, respectivamente. El mayor descenso del z-score se produjo en UCIN, con una velocidad de ganancia ponderal de 6,6±8,8g/kg/día, tras lo cual tuvo lugar una aceleración del crecimiento (16,7±3,8g/kg/día) insuficiente para realizar catch-up. Niveles más altos de urea se correlacionaron negativamente con el cambio en el z-score de peso (p<0,001) y el peso<P10 al nacer lo hizo de forma positiva (p=0,013).
ConclusionesMás de la mitad de los recién nacidos ≤1.500g presentan un peso al alta<P10. Esta restricción del crecimiento tiene lugar durante el ingreso en UCIN y afecta con menos frecuencia a los neonatos de bajo peso al nacer. Los niveles de urea se correlacionan negativamente con la ganancia ponderal, lo cual obliga a continuar estudiando la relación entre el crecimiento y el compartimento proteico.
When a baby is born very preterm, the physiological processes that would normally take place in the uterus in the third trimester instead unfold in the neonatal intensive care unit (NICU) setting. Extrauterine growth restriction (EUGR) is just one example of the challenges faced by neonatologists in their attempt to reproduce the ideal intrauterine conditions. Although nutritional recommendations for preterm newborns are based on in utero foetal growth rates,1,2 target intakes are frequently not achieved before hospital discharge or until the newborn reaches the term date. In fact, EUGR has been described as a “universal problem,”3 an “inevitable consequence”4 and a “serious problem,”5 and while some studies have shown improvements in postnatal growth in recent years with more aggressive nutritional strategies,6,7 EUGR is still a common occurrence in neonatal units5,8,9 and its management remains a controversial subject.3,5,10–13
Extrauterine growth restriction is not a merely statistical concept expressing divergence from a reference standard, but also a prognostic factor that is likely to be relevant in other areas, especially in neurologic outcomes.14–16 Therefore, improving postnatal growth, preventing its restriction and knowing which groups are at risk and require individualised care plans can help improve long-term outcomes.17
We designed a study with the aim of establishing the incidence of EUGR in newborns with birth weights of 1500 or less using intrauterine growth curves as reference. Our secondary objective was to assess whether specific baseline characteristics (birth weight, gestational age, sex), biochemical markers (blood urea nitrogen, serum albumin and total protein) or complications during the hospital stay (enterocolitis, patent ductus arteriosus or bronchopulmonary dysplasia) were associated with the severity of EUGR.
Materials and methodsWe performed a retrospective longitudinal observational study in newborns with birth weights of 1500g or less admitted to a Level III-C neonatal unit during a 4-year period (January 2013–December 2016). We excluded newborns with multiple malformation syndromes, those that did not require admission to the NICU, those delivered in other hospitals and those for whom we could not obtain follow-up data after discharge from the NICU because they were transferred to other hospitals or died early (≤28 days).
The NICU where the study was conducted has a nutritional management protocol for preterm newborns that generally adheres to current recommendations1,2: parenteral nutrition from day 0 with an initial protein intake of 2–2.5g/kg/day and an energy intake of approximately 40kcal/kg/day, with intake targets of 3.5–4g/kg/day of protein and 110–120kcal/kg of energy for the end of week 1, early initiation of trophic feedings, discontinuation of parenteral nutrition as soon as the newborn can tolerate 100mL/kg/day of enteral feeding, fortification of maternal milk, etc. Banked human milk was not available during the period under study, and therefore, when maternal milk was not available, patients received preterm formula. There were no significant changes in the protocol during the period under study, except for a switch to a lipid emulsion containing fish oil (SMOF Lipid®) for parenteral nutrition at the end of the first year.
We collected data for anthropometric measurements (weight, length and head circumference) and calculated the corresponding z-scores and/or percentiles using the 2013 Fenton growth charts as reference.18 We defined small for gestational age (SGA) as birth weight below the 10th percentile (P10). The length and head circumference (HC) were measured at admission and at hospital discharge. The weight was measured at discharge from the NICU, at 36 weeks and at hospital discharge. Biochemical markers (blood urea nitrogen, serum total protein and serum albumin) were measured at day 15-post birth. The markers we selected to assess for the presence of bronchopulmonary dysplasia were need for supplemental oxygen at 28 days and at 36 weeks of corrected age. We also collected data on the presence of necrotising enterocolitis (Bell stage 2 or higher) and patent ductus arteriosus.
To calculate postnatal growth velocity (PGV) between 2 periods, we used the exponential method, as has been done in previous studies,9,19 applying the following formula: PGV=(1000×ln [weightfinal/weightinitial])/days.
A sample size of 130 patients allows the estimation of the incidence of malnutrition based on the presence of weight below the P10 for gestational age (GA) at the time of hospital discharge with a 95% confidence level and a precision of ±7% for an assumed proportion of 75%.
We performed a descriptive analysis of all the variables included in the study, summarising quantitative variables as mean±standard deviation, median and interquartile range, and qualitative variables as absolute frequency and percentage distributions. We analysed the association of qualitative variables by means of the chi square test or the Fisher exact test as appropriate. We compared means between 2 groups using the Student's t test or the Mann–Whitney U test as applicable. We compared the means of more than 2 groups using ANOVA or the Kruskal–Wallis test. We calculated the Spearman correlation coefficient to assess the association between quantitative variables. We fit multivariate linear regression models to determine which variables could predict changes in z-score during hospitalisation, including those variables that were significant in the univariate analysis or considered clinically relevant. We performed all the analysis with the software SPSS v 24.0 for Windows.
The study protocol was reviewed and approved by the competent clinical research ethics board.
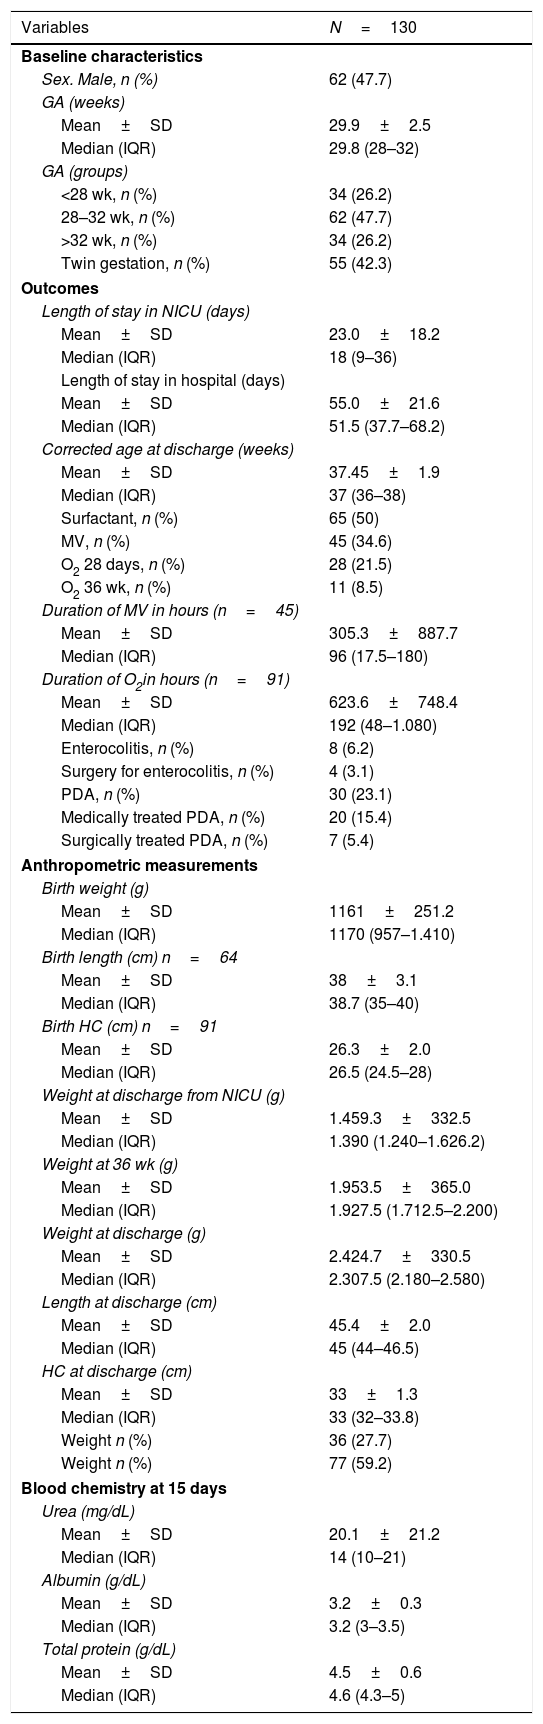
ResultsDuring the period under study, 163 newborns with birth weights of 1500g or less were admitted to the NICU, of whom we excluded those born in other hospitals (n=16) and those for whom we had no follow-up data due to transfer to other hospitals (n=3) or early death (n=14). The final sample included 130 patients. Table 1 presents the baseline characteristics of the patients and the changes in clinical and anthropometric parameters during the followup.
Description of the sample: baseline characteristics, changes in clinical and anthropometric parameters during the followup, and biochemical parameters at 15 days post birth.
| Variables | N=130 |
|---|---|
| Baseline characteristics | |
| Sex. Male, n (%) | 62 (47.7) |
| GA (weeks) | |
| Mean±SD | 29.9±2.5 |
| Median (IQR) | 29.8 (28–32) |
| GA (groups) | |
| <28 wk, n (%) | 34 (26.2) |
| 28–32 wk, n (%) | 62 (47.7) |
| >32 wk, n (%) | 34 (26.2) |
| Twin gestation, n (%) | 55 (42.3) |
| Outcomes | |
| Length of stay in NICU (days) | |
| Mean±SD | 23.0±18.2 |
| Median (IQR) | 18 (9–36) |
| Length of stay in hospital (days) | |
| Mean±SD | 55.0±21.6 |
| Median (IQR) | 51.5 (37.7–68.2) |
| Corrected age at discharge (weeks) | |
| Mean±SD | 37.45±1.9 |
| Median (IQR) | 37 (36–38) |
| Surfactant, n (%) | 65 (50) |
| MV, n (%) | 45 (34.6) |
| O2 28 days, n (%) | 28 (21.5) |
| O2 36 wk, n (%) | 11 (8.5) |
| Duration of MV in hours (n=45) | |
| Mean±SD | 305.3±887.7 |
| Median (IQR) | 96 (17.5–180) |
| Duration of O2in hours (n=91) | |
| Mean±SD | 623.6±748.4 |
| Median (IQR) | 192 (48–1.080) |
| Enterocolitis, n (%) | 8 (6.2) |
| Surgery for enterocolitis, n (%) | 4 (3.1) |
| PDA, n (%) | 30 (23.1) |
| Medically treated PDA, n (%) | 20 (15.4) |
| Surgically treated PDA, n (%) | 7 (5.4) |
| Anthropometric measurements | |
| Birth weight (g) | |
| Mean±SD | 1161±251.2 |
| Median (IQR) | 1170 (957–1.410) |
| Birth length (cm) n=64 | |
| Mean±SD | 38±3.1 |
| Median (IQR) | 38.7 (35–40) |
| Birth HC (cm) n=91 | |
| Mean±SD | 26.3±2.0 |
| Median (IQR) | 26.5 (24.5–28) |
| Weight at discharge from NICU (g) | |
| Mean±SD | 1.459.3±332.5 |
| Median (IQR) | 1.390 (1.240–1.626.2) |
| Weight at 36 wk (g) | |
| Mean±SD | 1.953.5±365.0 |
| Median (IQR) | 1.927.5 (1.712.5–2.200) |
| Weight at discharge (g) | |
| Mean±SD | 2.424.7±330.5 |
| Median (IQR) | 2.307.5 (2.180–2.580) |
| Length at discharge (cm) | |
| Mean±SD | 45.4±2.0 |
| Median (IQR) | 45 (44–46.5) |
| HC at discharge (cm) | |
| Mean±SD | 33±1.3 |
| Median (IQR) | 33 (32–33.8) |
| Weight n (%) | 36 (27.7) |
| Weight n (%) | 77 (59.2) |
| Blood chemistry at 15 days | |
| Urea (mg/dL) | |
| Mean±SD | 20.1±21.2 |
| Median (IQR) | 14 (10–21) |
| Albumin (g/dL) | |
| Mean±SD | 3.2±0.3 |
| Median (IQR) | 3.2 (3–3.5) |
| Total protein (g/dL) | |
| Mean±SD | 4.5±0.6 |
| Median (IQR) | 4.6 (4.3–5) |
GA, gestational age; HC, head circumference; IQR, interquartile range; MV, mechanical ventilation at some point during hospitalisation; NICU, neonatal intensive care unit; O2, supplemental oxygen; PDA, patent ductus arteriosus; P10, 10th percentile based on the 2013 Fenton charts; SD, standard deviation.
The prevalence of weight below the P10 was 27.7% (n=36) at admission, 66.9% (n=87) at 36 weeks of corrected age, 66.2% (n=86) at discharge from the NICU and 59.2% (n=77) at discharge from hospital.
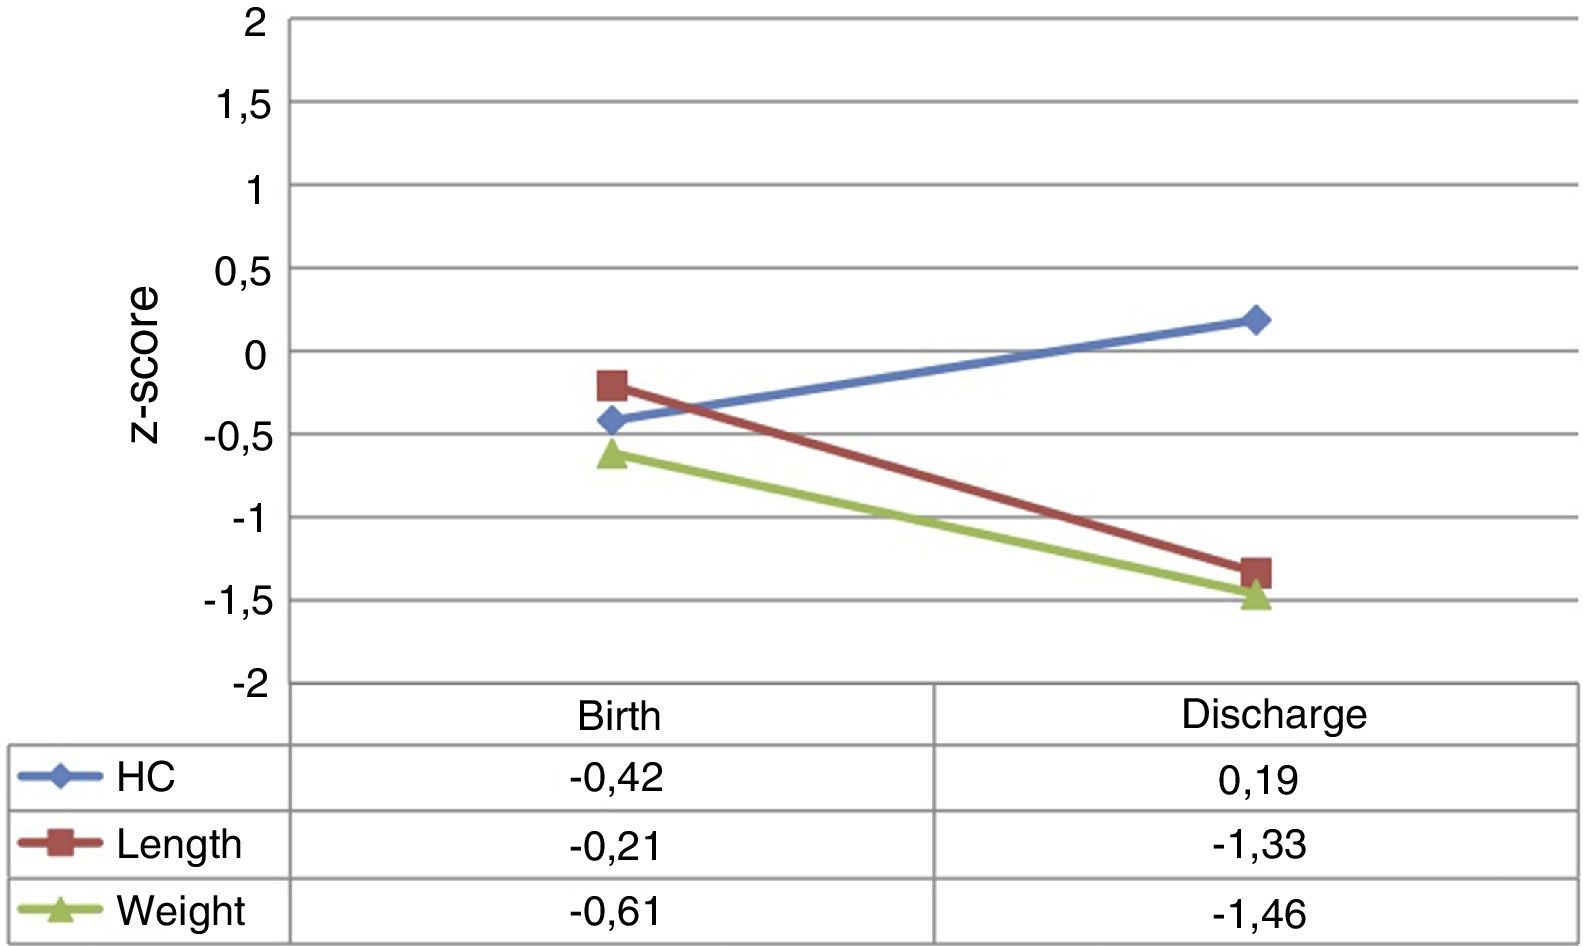
At admission, the z-scores for weight, length and HC were near zero. However, by hospital discharge the weight z-scores for weight and length had decreased by a mean of −0.85±0.79 and −1.09±0.65 points, respectively. The HC z-score remained close to 0 and even improved slightly. Fig. 1 provides a graphic representation of the z-score values at each time point and their trajectory.

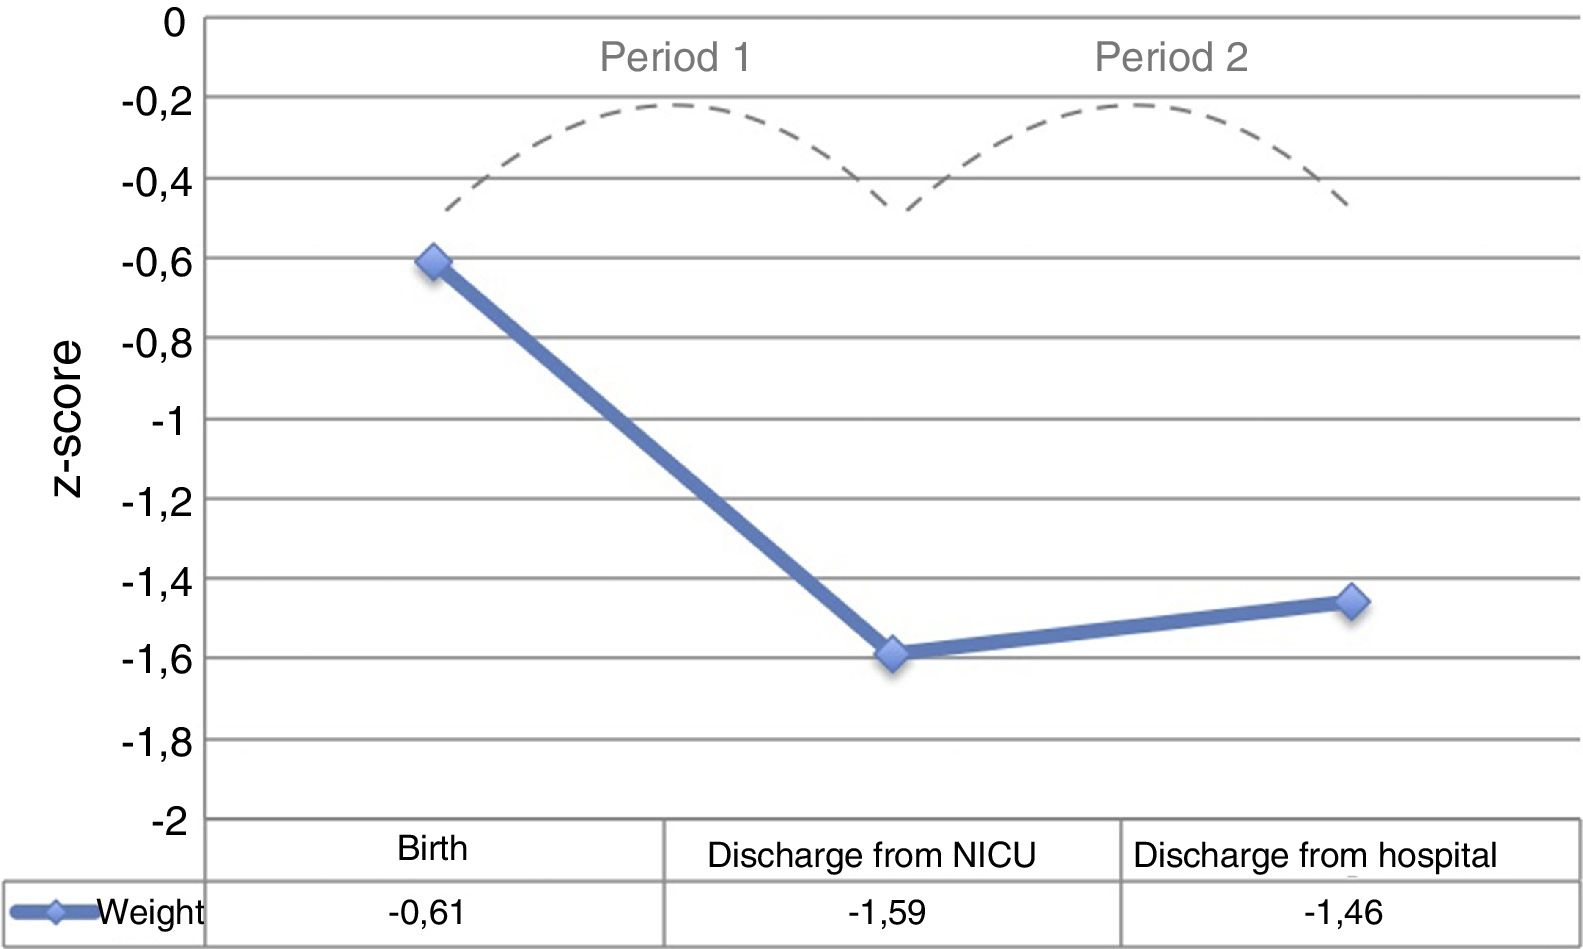
The period with the steepest decline in the weight z-score was the period between admission and discharge from the NICU (period 1), which was followed by a mild improvement before discharge from hospital (period 2), without full recovery of the birth values (Fig. 2).
 and discharge from hospital.")
The mean overall weight gain during hospitalisation was 1263.6±467.7g, with a mean gain of 23.7±5.6g/day. The mean PGV was 13.9±3.8g/kg/day. The mean PGV was significantly lower in period 1 compared to period 2 (6.6±8.8 vs 16.7±3.8g/kg/day; P<.001).
Table 1 presents the blood chemistry results. Only the urea levels were significantly and negatively correlated to the weight z-score during the hospital stay (rs=−0.289, P=.001).
We found that GA at birth was positively correlated to changes in weight z-score during hospitalisation, that is, greater GA corresponded to higher z-scores at discharge (rs=0.324, P<.001). Conversely, it was negatively correlated to the length of stay in the hospital (rs=−0.353, P<.001) and the length of stay in the NICU (rs=−0.178, P=.043). We did not find an association of GA at birth with the duration of oxygen therapy or of mechanical ventilation.
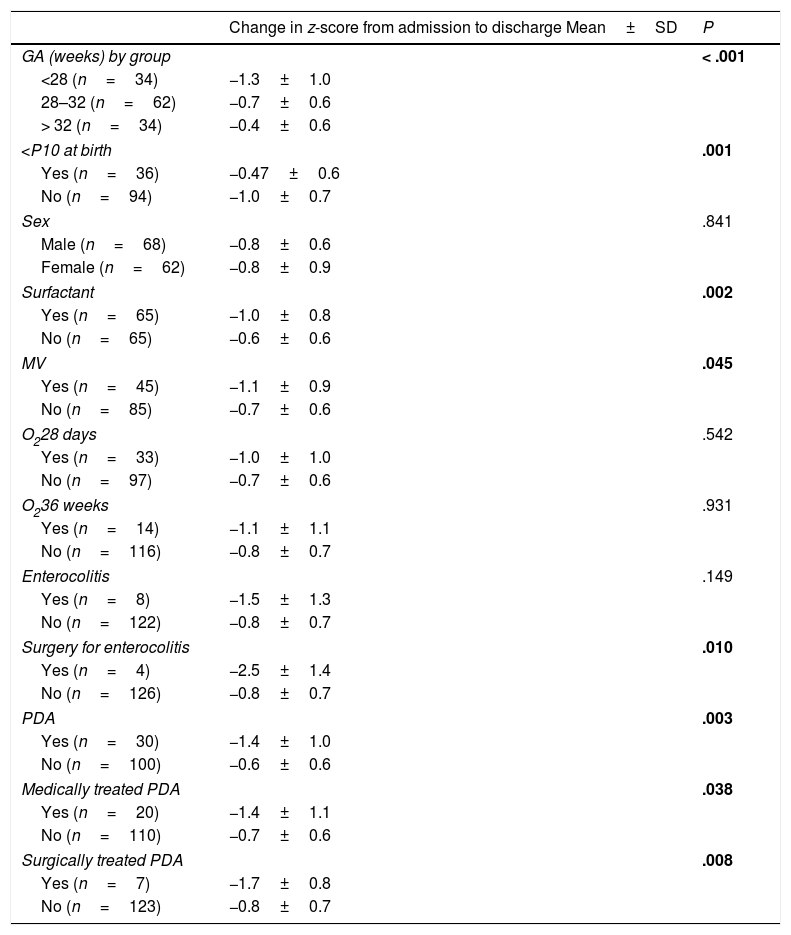
Table 2 presents the results of the univariate analysis of the association of qualitative variables with changes in weight z-scores during the hospital stay.
Association of qualitative variables with changes in z-score during hospitalisation. Univariate analysis.
| Change in z-score from admission to discharge Mean±SD | P | |
|---|---|---|
| GA (weeks) by group | < .001 | |
| <28 (n=34) | −1.3±1.0 | |
| 28–32 (n=62) | −0.7±0.6 | |
| > 32 (n=34) | −0.4±0.6 | |
| <P10 at birth | .001 | |
| Yes (n=36) | −0.47±0.6 | |
| No (n=94) | −1.0±0.7 | |
| Sex | .841 | |
| Male (n=68) | −0.8±0.6 | |
| Female (n=62) | −0.8±0.9 | |
| Surfactant | .002 | |
| Yes (n=65) | −1.0±0.8 | |
| No (n=65) | −0.6±0.6 | |
| MV | .045 | |
| Yes (n=45) | −1.1±0.9 | |
| No (n=85) | −0.7±0.6 | |
| O228 days | .542 | |
| Yes (n=33) | −1.0±1.0 | |
| No (n=97) | −0.7±0.6 | |
| O236 weeks | .931 | |
| Yes (n=14) | −1.1±1.1 | |
| No (n=116) | −0.8±0.7 | |
| Enterocolitis | .149 | |
| Yes (n=8) | −1.5±1.3 | |
| No (n=122) | −0.8±0.7 | |
| Surgery for enterocolitis | .010 | |
| Yes (n=4) | −2.5±1.4 | |
| No (n=126) | −0.8±0.7 | |
| PDA | .003 | |
| Yes (n=30) | −1.4±1.0 | |
| No (n=100) | −0.6±0.6 | |
| Medically treated PDA | .038 | |
| Yes (n=20) | −1.4±1.1 | |
| No (n=110) | −0.7±0.6 | |
| Surgically treated PDA | .008 | |
| Yes (n=7) | −1.7±0.8 | |
| No (n=123) | −0.8±0.7 | |
GA, gestational age; MV, mechanical ventilation at some point during hospitalisation; PDA, patent ductus arteriosus; P10, 10th percentile based on the 2013 Fenton charts; SD, standard deviation.
P-values of less than 0.05 are presented in boldface.
The final multivariate linear regression model to predict decreases in z-score included the following variables: GA, urea level and birth weight below the P10. The only variable that was an independent predictor of decreases in z-score was the blood urea level (P<.001), with the p-value for birth weight below the P10 being close to the threshold of significance (P=.098). When we eliminated GA from the model because it was not significant, we found that both the urea level and birth weight below P10 were independent predictors of decreases in z-score. That is, higher levels (more positive levels) of urea in blood were associated with more negative values in the variable “change in z-score,” that is, with greater decreases in the z-score (P<.001), while a birth weight below the P10 was associated with lower decreases in z-score and therefore less severe EUGR (P=.013).
DiscussionStrictly speaking, a decrease of any magnitude in the z-score or percentile from the time of birth entails some degree of EUGR, although in the literature EUGR is generally defined based on more or less arbitrary cut-off points, among which the most common one is weight below the P10 in foetal growth charts obtained from populations born at term. In our study of a contemporary sample of 130 newborns managed in a single neonatal unit, we found a decrease of about 1 point in the weight and length z-scores during the hospital stay, so that more than half of the newborns had weights below the P10 for GA at the time of hospital discharge. We found that EUGR resulted from a reduction in growth velocity during the stay in the NICU. Furthermore, we used linear regression to attempt to identify biochemical and clinical variables that could be associated with the decline in the weight z-score.
Several studies conducted in other countries have similar findings to those of our study.10,20 A large-scale study published in 2003 found that 34% of the 12 323 newborns delivered before 32 weeks’ gestation in the sample had weights below the P10 at the time of discharge.5 Other articles report significantly higher proportions, of up to 97% of very low birth weight newborns and up to 99% in extremely low birth weight newborns.21
Studies conducted in Spain have also provided reliable data on the frequency of EUGR, chief of which are those by Krauel et al. and by García-Muñoz et al. that used data from the SEN1500 register of newborns with birth weights of less than 1500g,8,9 and the study by Sáenz de Pipaón et al. in a sample of newborns in a single neonatal unit.22 The 2008 study by Krauel et al. analysed a sample of 2317 newborns and found a proportion of weight below the P10 at discharge of 77%. More recently, a thorough and rigorous study led by García-Muñoz Rodrigo analysed postnatal weight gain patterns in a cohort of 4520 newborns delivered at 28 weeks or earlier and found that the weight z-score had decreased by about −1.7 by the time of discharge.9 Both are multicentre studies with large samples, which has multiple obvious advantages, but it is also likely that nutritional practices varied significantly between units.23 Single centre studies, while having intrinsic drawbacks of their own, usually have more homogeneous samples. For instance, in 2014 Sáenz de Pipaón et al. reported the results of a prospective study in a sample of 111 newborns with birth weights of less than 1500g and delivered before 34 weeks’ gestation at the Hospital La Paz de Madrid, describing a decline in the weight z-score of −0.97 in the first 5 weeks, very similar to the decline of −0.85 observed in our sample during the overall stay, despite protein and energy intakes that were very close to those currently recommended.22
In an attempt to pinpoint the origin of EUGR, we analysed the PGV during the NICU stay and during the post-NICU stay through discharge, and found that it was during the first period that growth slowed most significantly. Previous studies had already described this two-stage trend in weight, with an initial period of decreasing percentiles followed by a period of growth with velocities similar to those of intrauterine growth, but without catch-up.9,13,19,24,25 A study by Cole et al. in 5009 newborns delivered before 32 weeks’ gestation in the United Kingdom found an average weight loss of 258g with the nadir in day 8 of life, followed by weight gains of a maximum of up to a maximum of 16g/kg/day.19 This value is very similar to the one we found in our sample in period 2, of 16.7g/kg/day. In a recent study on a cohort of 981 newborns delivered before 34 weeks’ gestation with no relevant complications, Rochow et al. also found that their postnatal growth trajectory started with a reduction in z-score of −0.8 followed by a period of growth that paralleled the expected intrauterine growth trajectory.13
This initial weight loss seems to be independent of energy and protein intake and probably reflects only water losses,7 which has led some authors to propose applying the target percentile curve after the initial weight loss, as opposed to from birth.7,9,19 Other authors consider a drop of −0.7 points in the z-score from birth to day 3 “obligatory”.26
Taking into account the limitations of anthropometric references, we believe it would be very useful to identify a laboratory marker allowing a more accurate assessment of nutritional status.27,28 Since weight gain depends at least in part on protein intake,4,22,29 investigation of the protein status seems particularly attractive. For this reason, routine measurement of serum protein and albumin levels has been recommended as part of the nutritional status evaluation of very low birth weight newborns,27 although we did not find an association between these variables and EUGR in our study. Urea, a product of protein catabolism, has been used traditionally to monitor protein intake, although this practice has also been questioned.30,31 Very few studies have specifically analysed the association between serum urea levels and nutritional variables.28 In our study, in the absence of reliable retrospective data on the daily protein intake, we established an initial hypothesis that higher urea levels would be indicative of a greater protein intake, and therefore associated with milder EUGR. However, higher urea levels were associated with a steeper decrease in the weight z-score (more negative values in the “z-score change” variable). This finding probably reflects the fact that urea levels are affected by hydration status, renal function and catabolic activity.27 Thus, an increase in catabolism associated with greater immaturity and the extracellular fluid loss characteristic of the first days of life could explain the greater elevation of urea in patients with more severe EUGR. In fact, an association between the degree of immaturity and the decline in z-scores has been described in the past.3,22
The clinical relevance of the association between urea levels at 15 days of life with greater severity of EUGR is debatable, for while the association of the values was statistically significant, most of the urea level values were within ranges that could be considered normal in newborns (the interquartile range in the overall sample was 10–21mg/dL), which was even the case in the group of newborns with weights below the P10 at discharge. However, we think that our finding underscores the need to investigate in detail the association between the protein status and postnatal growth.
In our sample, we found that SGA newborns had milder EUGR, as described by other authors.5,8,10,24 To be sure, many of these newborns continued to have a low weight for age at hospital discharge, but what we analysed in our study was the association between SGA and decreases in z-score during hospitalisation, and not only weight below the P10 at discharge. Senterre and Rigo reported that with the implementation of an aggressive nutrition protocol, the change in z-score during hospitalisation in newborns with appropriate weight for GA was of −0.37±0.57, while in SGA newborns it remained unchanged (0.18±0.52).26 Whether this reflects an adaptive process of foetuses with intrauterine growth restriction, differences in the management of the newborns, changes in body composition or to other factors remains to be determined.24
There are limitations to this study. The main limitations have to do with its retrospective design, which precluded the collection of reliable data on the administration of fluids and nutritional management, especially in regard to protein intake. In addition, the low incidence of some of the most severe comorbidities (enterocolitis, patent ductus arteriosus requiring surgery) limited the power of the study to identify significant associations with EUGR. Last of all, all weight, HC and length measurements were performed in a single unit, but without application of a pre-established standardised procedure. With over 1000 measurements included in the study, we believe that the effects of potential measurement errors are probably attenuated.
In conclusion, EUGR continues to be a frequent feature at the time of hospital discharge, observed in more than half of newborns with birth weights of 1500g or less. Extrauterine growth restriction develops between birth and discharge from the NICU.
Infants born SGA also frequently have body weights below the 10th percentile at the time of discharge, but they seem to have EUGR less frequently. We found a negative correlation between urea levels at 15 days post birth and weight gain. Although it is difficult to draw conclusions relevant to clinical practice from this finding, this association should be analysed for confirmation in future prospective studies aimed at studying the relationship between protein status and weight gain.
Conflicts of interestThe authors have no conflicts of interest to declare.
Please cite this article as: Avila-Alvarez A, Solar Boga A, Bermúdez-Hormigo C, Fuentes Carballal J. Restricción del crecimiento extrauterino en recién nacidos de menos de 1500 gramos de peso al nacer. An Pediatr (Barc). 2018;89:325–332.
Previous presentations: this study was presented in part at the xxvi Congress of Neonatología y Medicina Perinatal, September 2017, Zaragoza, Spain, and at the lxviiiCongress of the Sociedad de Pediatría de Galicia, November 2017, Ourense, Spain.
- Documento de manejo clínico del paciente pediátrico con infección por SARS-CoV-2.
(Actualizado el 26 de Noviembre de 2020) - Test de diagnóstico rápido en las consultas de Pediatría de Atención Primaria y Urgencias Pediátricas en la era COVID-19: más que una recomendación
(Actualizado el 21 de septiembre de 2020) - Consenso nacional sobre diagnóstico, estabilización y tratamiento del Síndrome Inflamatorio Multisistémico Pediátrico vinculado a SARS-CoV-2 (SIM-PedS).
(Actualizado el 27 de Julio de 2020) - Recomendaciones para el manejo del recién nacido en relación con la infección por SARS-CoV-2.
(Actualizado el 27 de Mayo de 2020) - Manejo del paciente pediátrico ante sospecha de infección por el nuevo coronavirus SARS-CoV-2 en atención primaria (COVID-19). AEPap-SEIP/AEP-SEPEAP.
(Actualizado el 27 de Abril de 2020) - Propuesta de adaptación de las recomendaciones de reanimación cardiopulmonar pediátrica avanzada a la infección por coronavirus.
(Actualizado el 11 de Abril de 2020)
articles

Anales de Pediatría (English Edition) follows the Recommendations for the Conduct, Reporting, Editing and Publication of Scholarly Work in Medical Journals