
To determine the prevalence of frequent Paediatric Emergency Departments users and to analyse their characteristics, comparing initial consultations and re-consultations.
MethodsThis is a multicentre retrospective cohort study of all patients who made 10 or more visits to the Paediatric Emergency Departments of 5 public hospitals between 1 January 2013 and 31 December 2013. An analysis was performed on the patient demographics and clinical data of the first consultation and consecutive re-consultations.
ResultsFrequent users represented 0.60% (95% CI: 0.56–0.64%) of Emergency Department users, and accounted for 3.93% (95% CI: 3.47–4.39%) of all visits. The most numerous age group consisted of children under 2 years old (66.6%). Frequent users distributed their visits throughout the year (62.3%; P<.001), and did not have a chronic condition associated with their chief complaint (86.4%; P<.001). They were usually classified as non-urgent or less urgent in triage (3186 vs. 1812; P<.001), and often did not require any intervention, such as complementary tests (79.4%) or observation/treatment (60%). Admission rate was similar to the general paediatric population (5.3%). Re-consultations represented 27% of these patient visits, mostly related to persistence of symptoms (56.3%), with 13.8% of them consulting their Primary Care physician before seeking successive medical attention in the Paediatric Emergency Department.
ConclusionsPaediatric frequent users often ask for medical care in the Emergency Department before consulting their Primary Care physician. They present with less urgent processes and do not systematically need diagnostic or therapeutic interventions. Re-consultations make up a significant number of visits, in which more interventions are done and more children are admitted.
Determinar la prevalencia de hiperfrecuentadores en urgencias y analizar sus características, comparando secundariamente las primeras consultas y las reconsultas.
MétodoEstudio multicéntrico de cohorte retrospectivo. Se cuantifican las visitas a urgencias de pediatría de 5 hospitales públicos entre el 1 de enero y 31 de diciembre de 2013 y se seleccionan los pacientes con 10 o más visitas realizadas. Se recogen variables demográficas y clínicas y se analiza cada visita en función de si se trata de una primera consulta o una reconsulta.
ResultadosLos pacientes hiperfrecuentadores constituyeron el 0,60% (IC 95%: 0,56–0,64%) de los usuarios de urgencias y generaron el 3,93% (IC 95%: 3,47–4,39%) de las consultas. Los menores de 2años fueron el grupo de edad más numeroso (66,6%). Distribuyeron sus consultas durante los 4 trimestres (62,3%; p<0,001) y no presentaron patología de base relacionada con el motivo de consulta (86,4%; p<0,001). La mayoría se clasificaron como poco urgentes (3.186 vs. 1.812; p<0,001) y habitualmente no precisaron intervenciones en forma de pruebas complementarias (79,4%) u observación/tratamiento (60%). La tasa de ingreso fue similar a la de la población general pediátrica (5,3%). Las reconsultas representaron el 27% de las visitas de estos pacientes, el 13,82% de ellos consultó en atención primaria antes de las siguientes visitas y fueron justificadas preferentemente por persistencia de los síntomas (56,34%).
ConclusionesEl hiperfrecuentador pediátrico consulta en urgencias como primera opción por procesos generalmente poco urgentes que no requieren intervenciones diagnóstico-terapéuticas de forma sistemática. Las reconsultas constituyen un número importante de visitas, se caracterizan por precisar más intervenciones y se indican más ingresos hospitalarios.
From a purely semantic perspective, we can define frequent users as individuals that attend a certain place excessively, more often than it is considered normal. The problem with this definition arises when we attempt to apply this term to health care settings, trying to identify a set of patients that visit paediatric services (hospital emergency departments, primary care, specialty clinics) more than normal. At times, normal is understood as what is necessary, so that the term frequent users ends up having pejorative connotations.1
The World Health Organization defines a health emergency as the onset of a health problem of varying severity that leads to the perception of need for immediate attention in the affected individual or his or her family.2 Based on this definition, all visits to emergency departments (EDs) would be necessary and frequent users would be patients that perceive this need often. Frequent use would thus depend on various factors that may influence this perception, including factors related to the hospital EDs themselves (accessibility, opening hours, awareness of its presence in the population), the health care system (promotion and availability of hospitals), the patient (underlying diseases, followup in outpatient care) and socioeconomic and cultural status.3–5
There is a generalised belief that a small set of patients exists that consume a large amount of resources and place a considerable burden on heath services,6 which may have a negative impact both on the EDs and on the patients (assessment by different health providers, repetition of diagnostic tests, lower quality of followup…). There is a considerable interest in reducing the impact of frequent use, and this has led to performance of several studies in the adult population.7,8
For the purpose of analysing frequent use, authors in the published literature have attempted to establish cut-off points based on the number of visits made in a given time interval (between 3 and 12 visits per year),8 and there is no consensus on this point. Thus, while some authors propose a fixed number of visits that vary between different studies, others determine the cut-off points based on statistical constructs such as exceeding a certain percentile.9
The magnitude of frequent and super-frequent use in the paediatric emergency setting has not been well defined. We also do not know the frequency of use of paediatric emergency departments (PEDs) in our area. The first step towards optimising the management of paediatric frequent users is to become acquainted with their characteristics and needs to then develop protocols that will result in increased efficiency, understood in terms of health, for these patients.
The aim of this study was to determine the frequency of use and the prevalence of super-frequent users in PEDs of the autonomous community of Madrid and to analyse the demographic and clinical characteristics of paediatric frequent users. A secondary objective was to assess the differences between isolated visits and second or return visits.
Materials and methodsWe conducted a descriptive and inferential multicentre, observational, retrospective cohort study including all patients that sought services in the PEDs of five hospitals in the Autonomous Community of Madrid between January 1 and December 31, 2013.
Population under studyWe selected patients that made ten or more visits during the period under study to emergency departments in the participating hospitals, in which the maximum age for paediatric care ranged between 14 and 15 years.
The participating centres were tertiary care university hospitals (Gregorio Marañón, Doce de Octubre) and general and secondary care hospitals (Getafe, Infanta Cristina and Del Tajo).
We excluded emergency visits for which data were not available in the selected medical records and hospitals whose records did not include at least 80% of the episodes of PED use.
Data collectionWe created a data collection workbook where we entered variables pertaining to demographic characteristics, past medical history, past health care use, reason given for the visit, stratification based on level of urgency (priority given in triage), diagnostic and therapeutic interventions, and discharge destination. We analysed each visit based on whether it was a first or a return visit.
We assigned each visit a five-digit code that corresponded to the hospital, patient number, and visit number. The database was safeguarded by the principal investigator, who assigned consecutive numbers to the original codes to preserve confidentiality.
The data were collected from the electronic health record database of each hospital and of the Autonomous Community of Madrid.
The study was approved by the clinical research ethics committee of the principal investigator's institution (Hospital Gregorio Marañón).
Statistical analysisWe have expressed qualitative variables as absolute frequencies and percentages, and quantitative variables as mean and standard deviation (SD) if they had a normal distribution, and otherwise as median and interquartile range.
We compared the means of two or more groups using the Mann–Whitney U and the Kruskal–Wallis tests, respectively. We used Pearson's χ2 test to analyse the association between categorical variables. Statistical significance was defined as a p-value of less than .05.
Definitions- -
Frequent user: patient that makes more visits than average. At least two visits per year in our study.10
- -
Super-frequent user: patient that made ten or more visits to hospital EDs during the period under study.10–12
- -
Primary care super-frequent user: patient that made ten or more visits to primary care during the period under study.
- -
Age: for the demographic variables, we recorded the age at the time of the first visit, and for variables related to the visits, we recorded the age at which each visit took place.
- -
Health care shift: morning from 8AM to 3PM. Afternoon, from 3PM to 10PM. Night from 10PM to 8AM.
- -
Priority level: triage classification (1: resuscitation, 2: emergent, 3: urgent, 4: less urgent, 5: non-urgent).13
- -
Recurrent acute disease: disease that has led to another visit for the same reason in the past three months.
- -
Return visit: visit that results from a problem for which care was sought at the ED in the past seven days.14
- -
Hospital corresponding to a patient: hospital near the residence of the patient assigned to the patient based on the service distribution of the health area.
- -
Hospital level of care: hospitals were classified by level of care based on the criteria established by the Health Department of Madrid.15
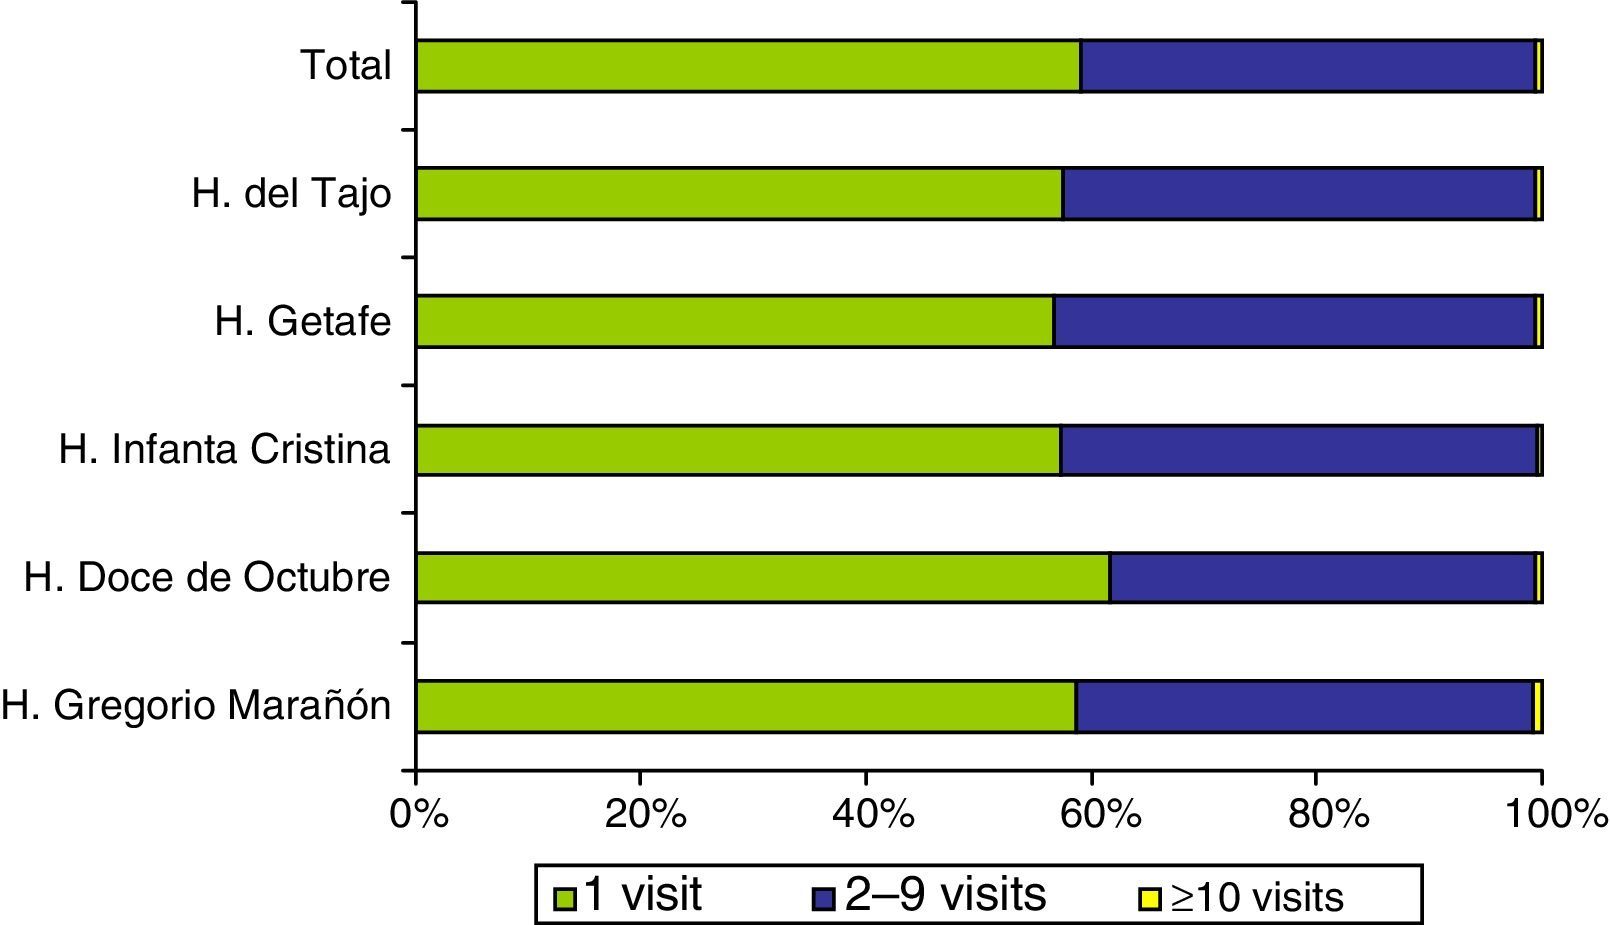
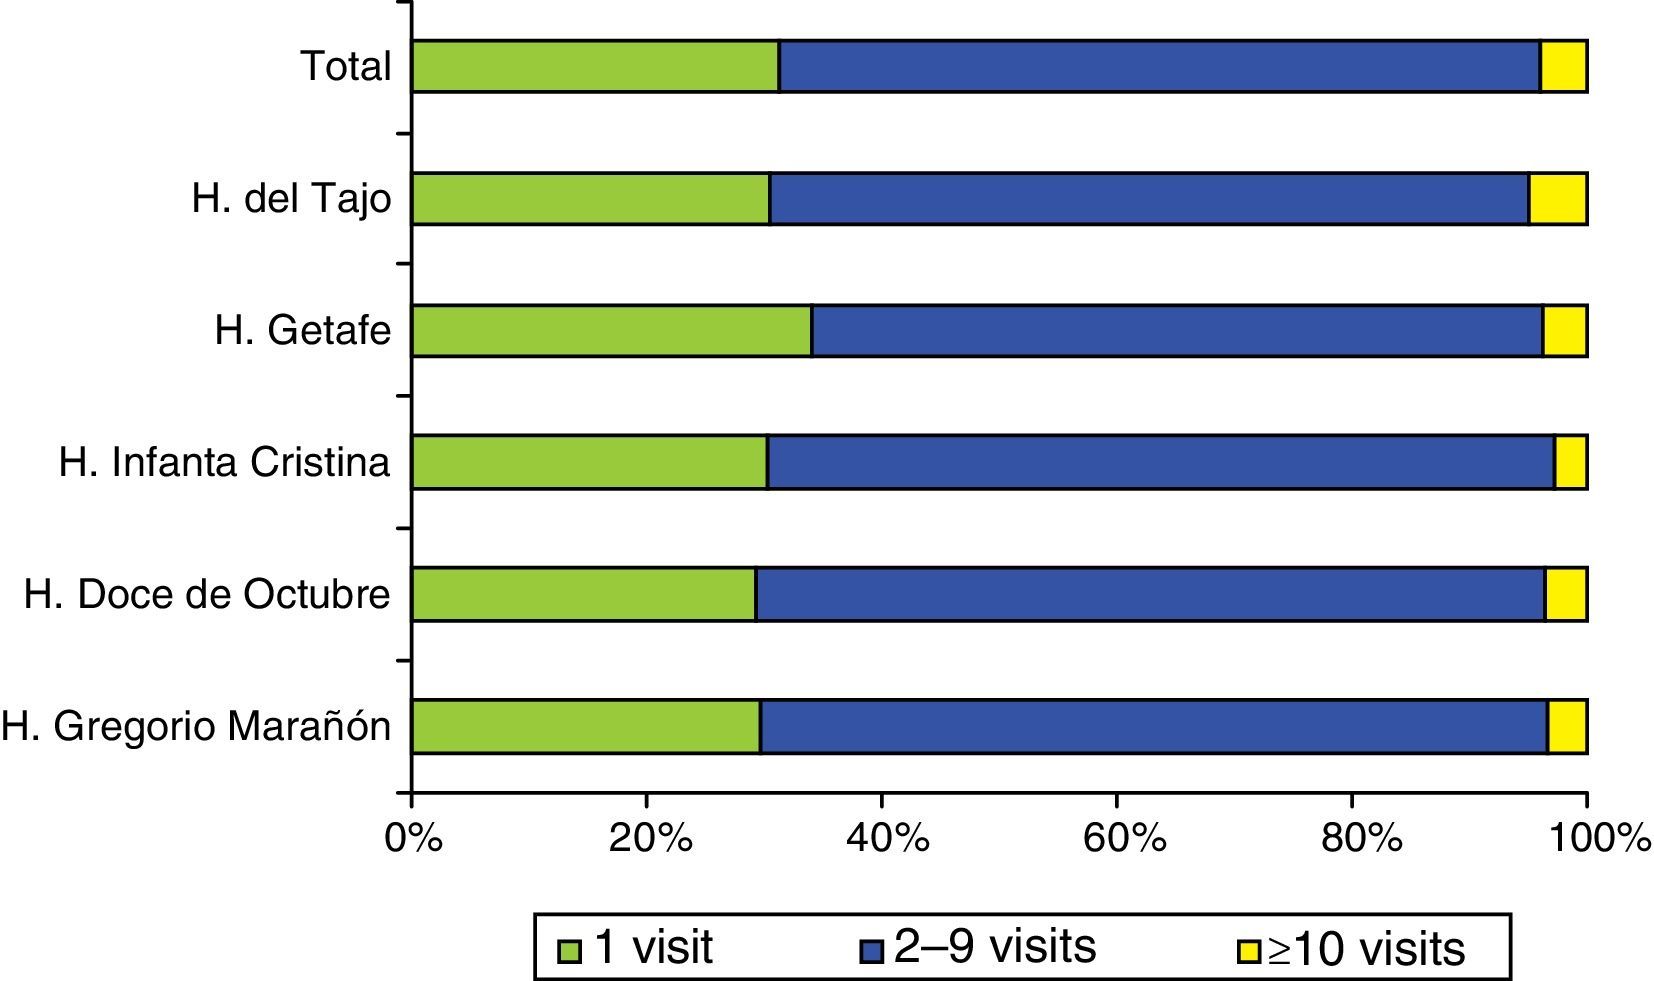
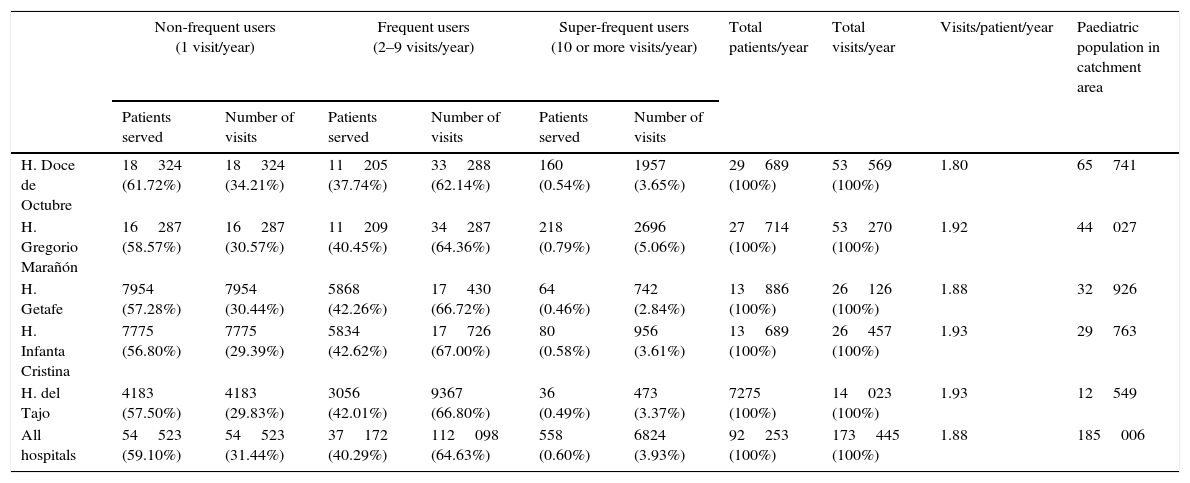
After applying the exclusion criteria, we found a total of 173445 visits corresponding to 92253 patients, with a mean of 1.88 visits per patient. Figures 1 and 2 show the proportions of patients and of the total visits that corresponded to the different frequency-of-use categories. The mean number of visits per patient and the percentages of frequency-of-use categories were similar in all participating hospitals (Table 1).


Distribution of all patients and their visits to paediatric emergency departments in 2013.
| Non-frequent users (1 visit/year) | Frequent users (2–9 visits/year) | Super-frequent users (10 or more visits/year) | Total patients/year | Total visits/year | Visits/patient/year | Paediatric population in catchment area | ||||
|---|---|---|---|---|---|---|---|---|---|---|
| Patients served | Number of visits | Patients served | Number of visits | Patients served | Number of visits | |||||
| H. Doce de Octubre | 18324 (61.72%) | 18324 (34.21%) | 11205 (37.74%) | 33288 (62.14%) | 160 (0.54%) | 1957 (3.65%) | 29689 (100%) | 53569 (100%) | 1.80 | 65741 |
| H. Gregorio Marañón | 16287 (58.57%) | 16287 (30.57%) | 11209 (40.45%) | 34287 (64.36%) | 218 (0.79%) | 2696 (5.06%) | 27714 (100%) | 53270 (100%) | 1.92 | 44027 |
| H. Getafe | 7954 (57.28%) | 7954 (30.44%) | 5868 (42.26%) | 17430 (66.72%) | 64 (0.46%) | 742 (2.84%) | 13886 (100%) | 26126 (100%) | 1.88 | 32926 |
| H. Infanta Cristina | 7775 (56.80%) | 7775 (29.39%) | 5834 (42.62%) | 17726 (67.00%) | 80 (0.58%) | 956 (3.61%) | 13689 (100%) | 26457 (100%) | 1.93 | 29763 |
| H. del Tajo | 4183 (57.50%) | 4183 (29.83%) | 3056 (42.01%) | 9367 (66.80%) | 36 (0.49%) | 473 (3.37%) | 7275 (100%) | 14023 (100%) | 1.93 | 12549 |
| All hospitals | 54523 (59.10%) | 54523 (31.44%) | 37172 (40.29%) | 112098 (64.63%) | 558 (0.60%) | 6824 (3.93%) | 92253 (100%) | 173445 (100%) | 1.88 | 185006 |
H, hospital.
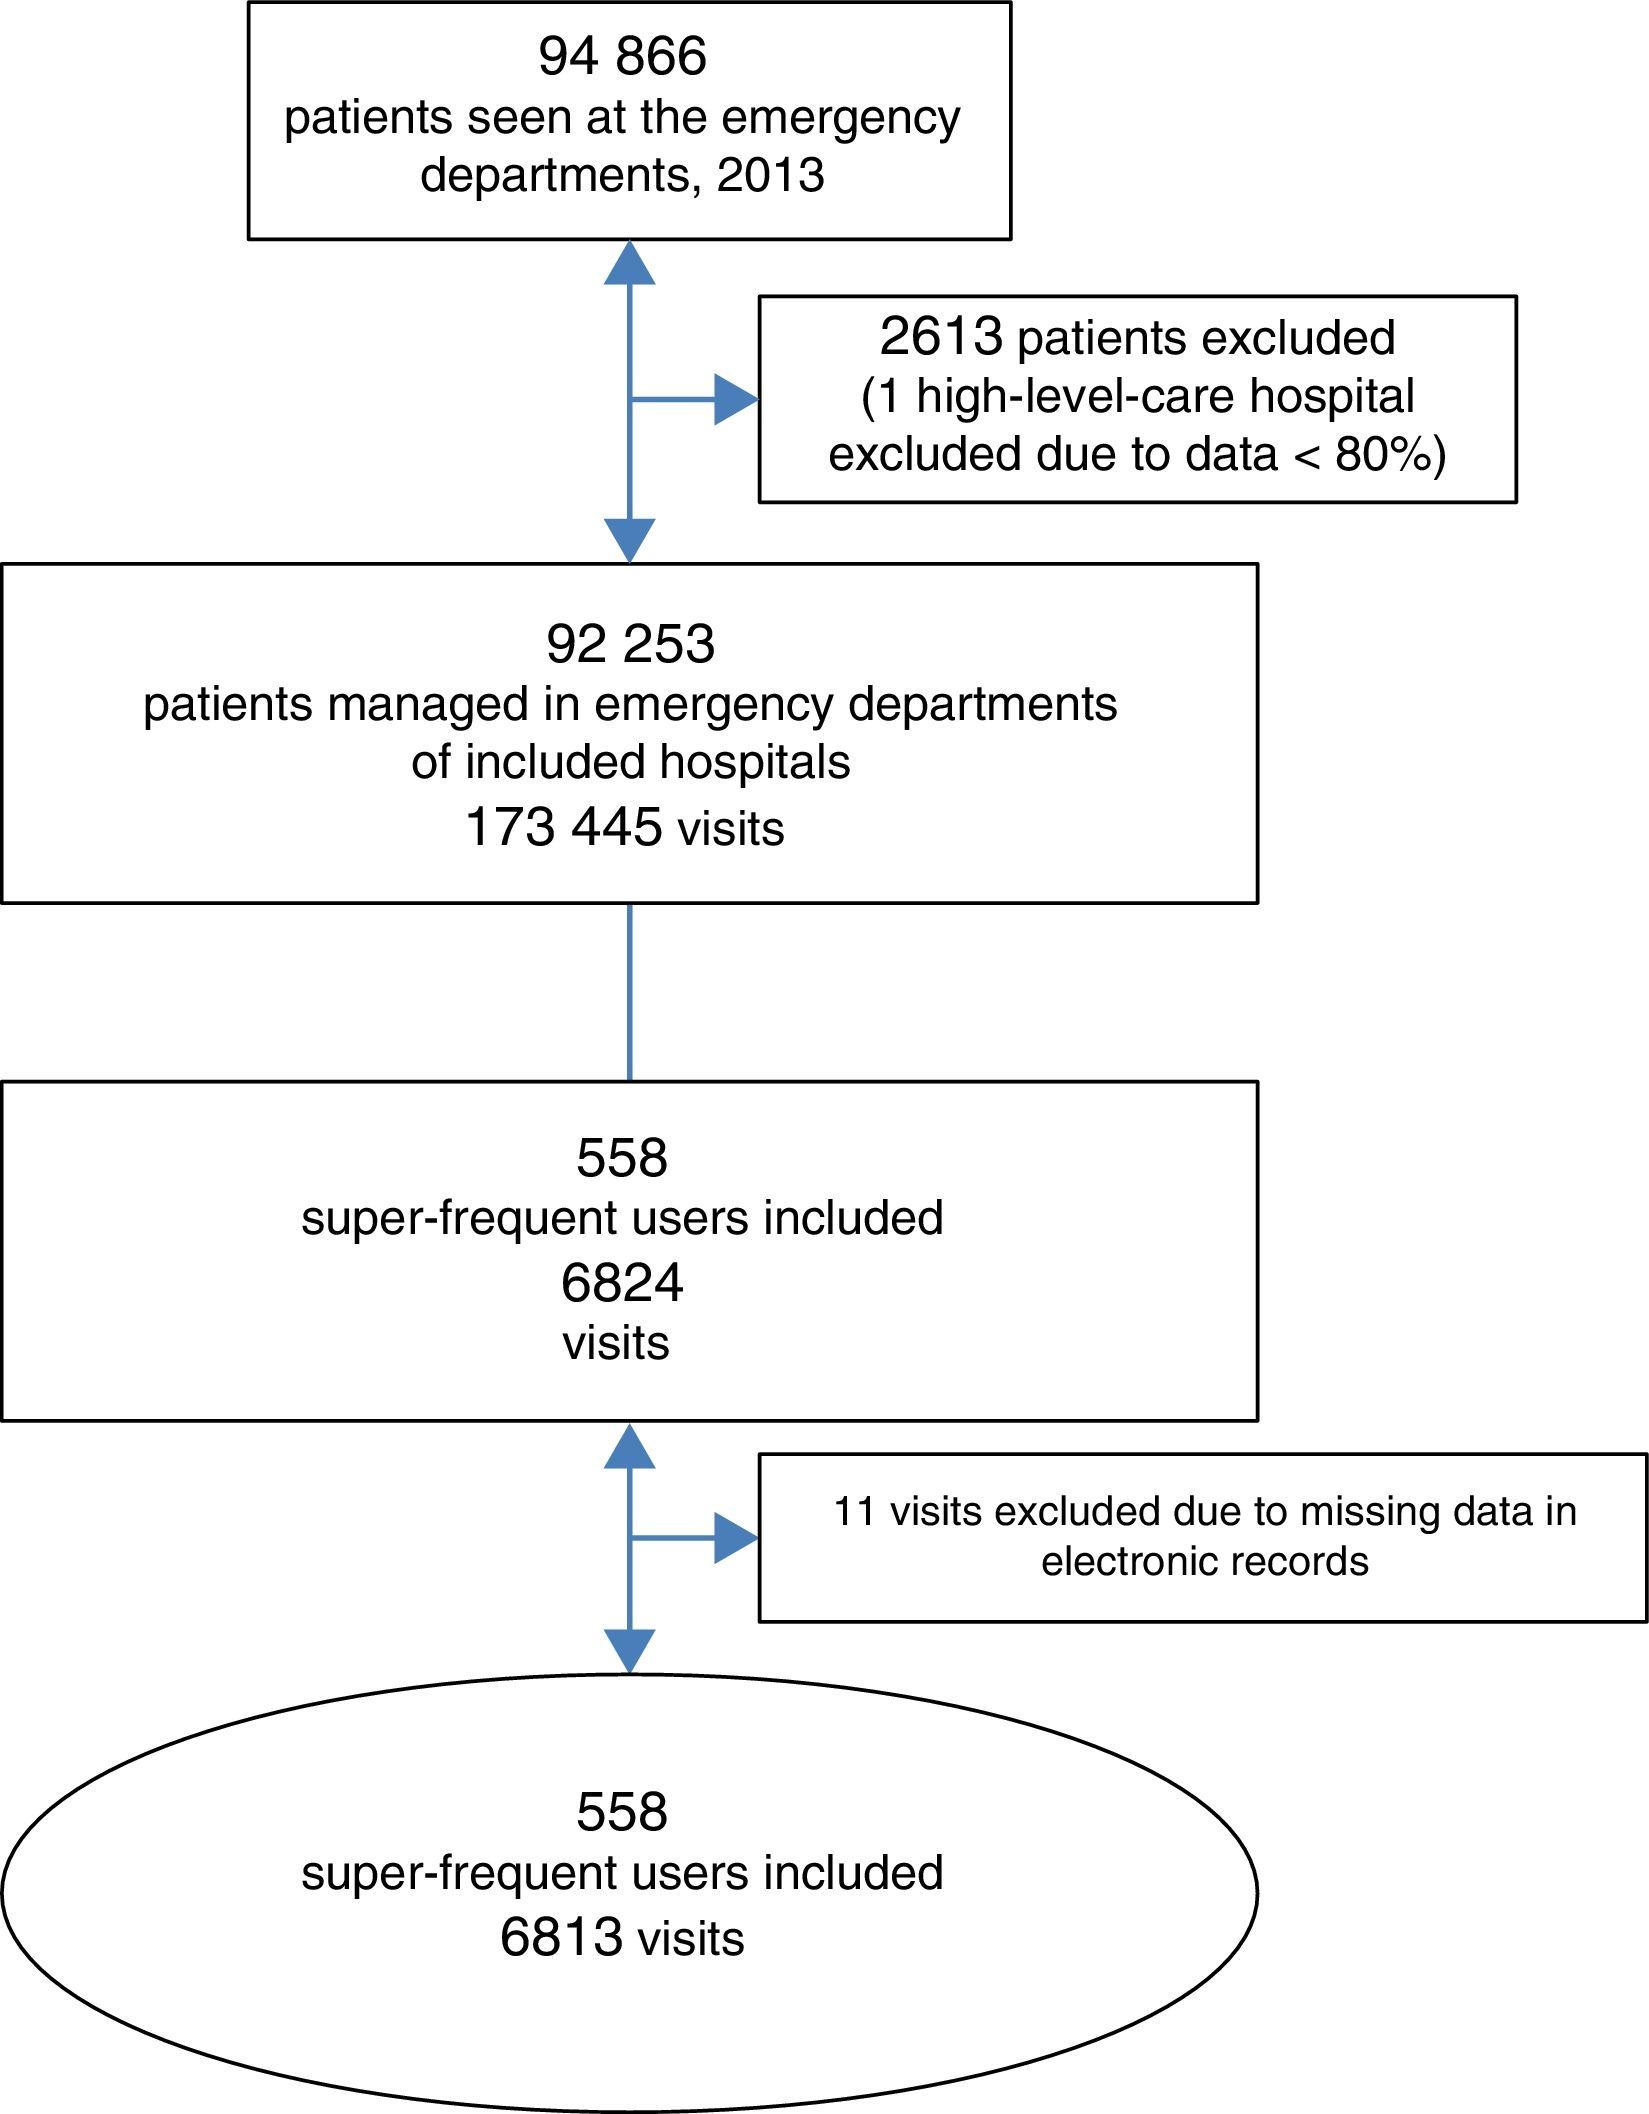
Our study included 558 super-frequent users that made a total of 6813 visits to EDs (Figure 3), which corresponded to a prevalence of 0.60% (95% confidence interval [CI], 0.56–0.64%) in the total users of emergency services in our area. This group made 3.93% of the total number of visits (95% CI, 3.47–4.39%). Super-frequent users made a median of 11 visits per patient (10–13), with no differences between hospitals (P=.827).

The mean age was 2.06 years (SD, 2.55) and the median was 1.5years (0.5–2.5), also with no difference between hospitals (P=.919).
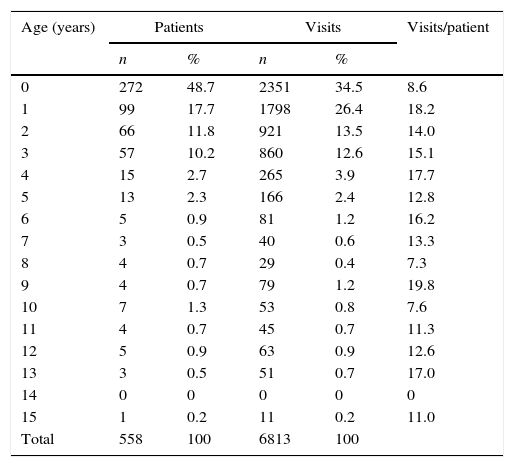
The highest volume of health care use in this group corresponded to children aged less than 2 years (66.6% of the children, who made 60.9% of the visits); especially infants aged less than 1 year (48.7% of children and 34.5% of visits), followed by children aged 1 to 2years (17.7% and 26.4%). However, it was the last group that used the ED most frequently, with 18 visits per patient (Table 2).
Number of identified super-frequent users and visits made by age.
| Age (years) | Patients | Visits | Visits/patient | ||
|---|---|---|---|---|---|
| n | % | n | % | ||
| 0 | 272 | 48.7 | 2351 | 34.5 | 8.6 |
| 1 | 99 | 17.7 | 1798 | 26.4 | 18.2 |
| 2 | 66 | 11.8 | 921 | 13.5 | 14.0 |
| 3 | 57 | 10.2 | 860 | 12.6 | 15.1 |
| 4 | 15 | 2.7 | 265 | 3.9 | 17.7 |
| 5 | 13 | 2.3 | 166 | 2.4 | 12.8 |
| 6 | 5 | 0.9 | 81 | 1.2 | 16.2 |
| 7 | 3 | 0.5 | 40 | 0.6 | 13.3 |
| 8 | 4 | 0.7 | 29 | 0.4 | 7.3 |
| 9 | 4 | 0.7 | 79 | 1.2 | 19.8 |
| 10 | 7 | 1.3 | 53 | 0.8 | 7.6 |
| 11 | 4 | 0.7 | 45 | 0.7 | 11.3 |
| 12 | 5 | 0.9 | 63 | 0.9 | 12.6 |
| 13 | 3 | 0.5 | 51 | 0.7 | 17.0 |
| 14 | 0 | 0 | 0 | 0 | 0 |
| 15 | 1 | 0.2 | 11 | 0.2 | 11.0 |
| Total | 558 | 100 | 6813 | 100 | |
There was a predominance of male compared to female patients (60% versus 40%, P<.001), and we found no difference in the mean number of visits between them (mean±SD, 12.40±3.68 per year vs 12±2.72 per year; P=.468).
Super-frequent users made between none and sixty-seven visits to their paediatrician at the primary health care centre, with a median of 10visits per patient (5–17). We did not find a substantial predominance of super-frequent users in primary care compared to patients that made fewer visits (230 versus 204 children).
The visits of most of the children were distributed across four trimesters (62.3%) or three trimesters (32.5%), while the visits of 4.8% were concentrated in two trimesters and those of 0.4% in a single trimester (P<.001). The total volume of visits was similar in all months of the year save for a decline in July and August (482 and 368 emergency visits, respectively) and a surge in the last three months (631, 647 and 750 emergency visits) (P<.001). Patients visited more often during the afternoon shift (42.5% of visits), while the volume of visits was similar in the morning shift (29.6%) and the night shift (27.9%) (P<.001).
As for visits to hospitals that did not correspond to the geographical area where the patient resided, they mostly took place in high-level-care rather than low-level-care hospitals (79.8 vs 20.2%; P<.001). Consistent with this, patients that visited low level of care hospitals tended to live in the same geographical area (69.3%; P<.001), while patients that visited high level of care hospitals came from different areas, although the difference was not marked (53.3 vs 45.6%; P<.001).
As for their previous medical history, 13.6% of patients were in followup for a health condition related to the presenting complaint, 30.5% were in followup for reasons unrelated to the presenting complaint, and 56% were not in any type of followup at the hospital (P<.001).
Most of the visits were classified during triage as less urgent or non-urgent (level ≥4, 3186 visits, and level ≤3, 1812 visits; P<.001), although in 27%, the priority level was unknown at the expense of low-level-care hospitals (93.2% of missing data).
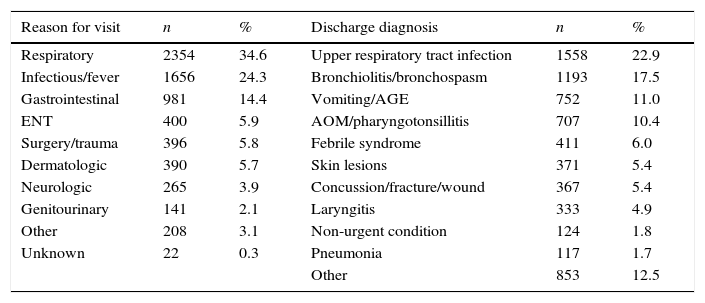
The most common reasons for seeking care were respiratory conditions (34.6%), followed by infectious conditions (24.3%), and the most frequent diagnoses were upper respiratory tract infection (22.9%) followed by bronchiolitis/bronchospasm (17.5%) (Table 3).
Presenting complaint and final diagnosis of the visits made by super-frequent users.
| Reason for visit | n | % | Discharge diagnosis | n | % |
|---|---|---|---|---|---|
| Respiratory | 2354 | 34.6 | Upper respiratory tract infection | 1558 | 22.9 |
| Infectious/fever | 1656 | 24.3 | Bronchiolitis/bronchospasm | 1193 | 17.5 |
| Gastrointestinal | 981 | 14.4 | Vomiting/AGE | 752 | 11.0 |
| ENT | 400 | 5.9 | AOM/pharyngotonsillitis | 707 | 10.4 |
| Surgery/trauma | 396 | 5.8 | Febrile syndrome | 411 | 6.0 |
| Dermatologic | 390 | 5.7 | Skin lesions | 371 | 5.4 |
| Neurologic | 265 | 3.9 | Concussion/fracture/wound | 367 | 5.4 |
| Genitourinary | 141 | 2.1 | Laryngitis | 333 | 4.9 |
| Other | 208 | 3.1 | Non-urgent condition | 124 | 1.8 |
| Unknown | 22 | 0.3 | Pneumonia | 117 | 1.7 |
| Other | 853 | 12.5 |
AGE, acute gastroenteritis; AOM, acute otitis media; ENT, ear-throat-nose.
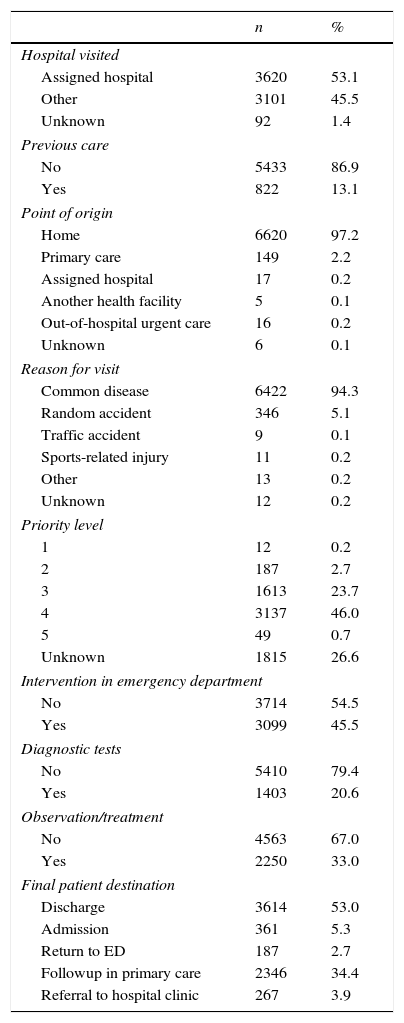
In more than half of the visits, no interventions consisting of diagnostic tests, observation or treatment were performed at the ED (54.5%). The most frequently requested diagnostic tests were radiology tests (8.2% of visits), blood tests (7.1%) and urine tests (5.7%). Patients were most frequently discharged to their homes (Table 4).
Characteristics of the visits made by super-frequent users.
| n | % | |
|---|---|---|
| Hospital visited | ||
| Assigned hospital | 3620 | 53.1 |
| Other | 3101 | 45.5 |
| Unknown | 92 | 1.4 |
| Previous care | ||
| No | 5433 | 86.9 |
| Yes | 822 | 13.1 |
| Point of origin | ||
| Home | 6620 | 97.2 |
| Primary care | 149 | 2.2 |
| Assigned hospital | 17 | 0.2 |
| Another health facility | 5 | 0.1 |
| Out-of-hospital urgent care | 16 | 0.2 |
| Unknown | 6 | 0.1 |
| Reason for visit | ||
| Common disease | 6422 | 94.3 |
| Random accident | 346 | 5.1 |
| Traffic accident | 9 | 0.1 |
| Sports-related injury | 11 | 0.2 |
| Other | 13 | 0.2 |
| Unknown | 12 | 0.2 |
| Priority level | ||
| 1 | 12 | 0.2 |
| 2 | 187 | 2.7 |
| 3 | 1613 | 23.7 |
| 4 | 3137 | 46.0 |
| 5 | 49 | 0.7 |
| Unknown | 1815 | 26.6 |
| Intervention in emergency department | ||
| No | 3714 | 54.5 |
| Yes | 3099 | 45.5 |
| Diagnostic tests | ||
| No | 5410 | 79.4 |
| Yes | 1403 | 20.6 |
| Observation/treatment | ||
| No | 4563 | 67.0 |
| Yes | 2250 | 33.0 |
| Final patient destination | ||
| Discharge | 3614 | 53.0 |
| Admission | 361 | 5.3 |
| Return to ED | 187 | 2.7 |
| Followup in primary care | 2346 | 34.4 |
| Referral to hospital clinic | 267 | 3.9 |
Return visits amounted to 27% of the visits, with the reason for the visit being persistence of symptoms in 56.3% and worsening in 32.3%; while in 11.1% the patient was referred back from primary care or from the ED itself or a hospital clinic. Also, 13.8% had been preceded by a visit to the primary care health centre while in 79.5% the patient had only previously visited the same ED. First visits accounted for the remaining 73% of the total visits. Sixty-seven percent of first visits were due to isolated acute conditions, while 26.6% were due to a recurrent acute condition and 6.4% to a chronic condition.
We did not find differences in the mean age of patients that made return visits compared to patients that did not (P=.063).
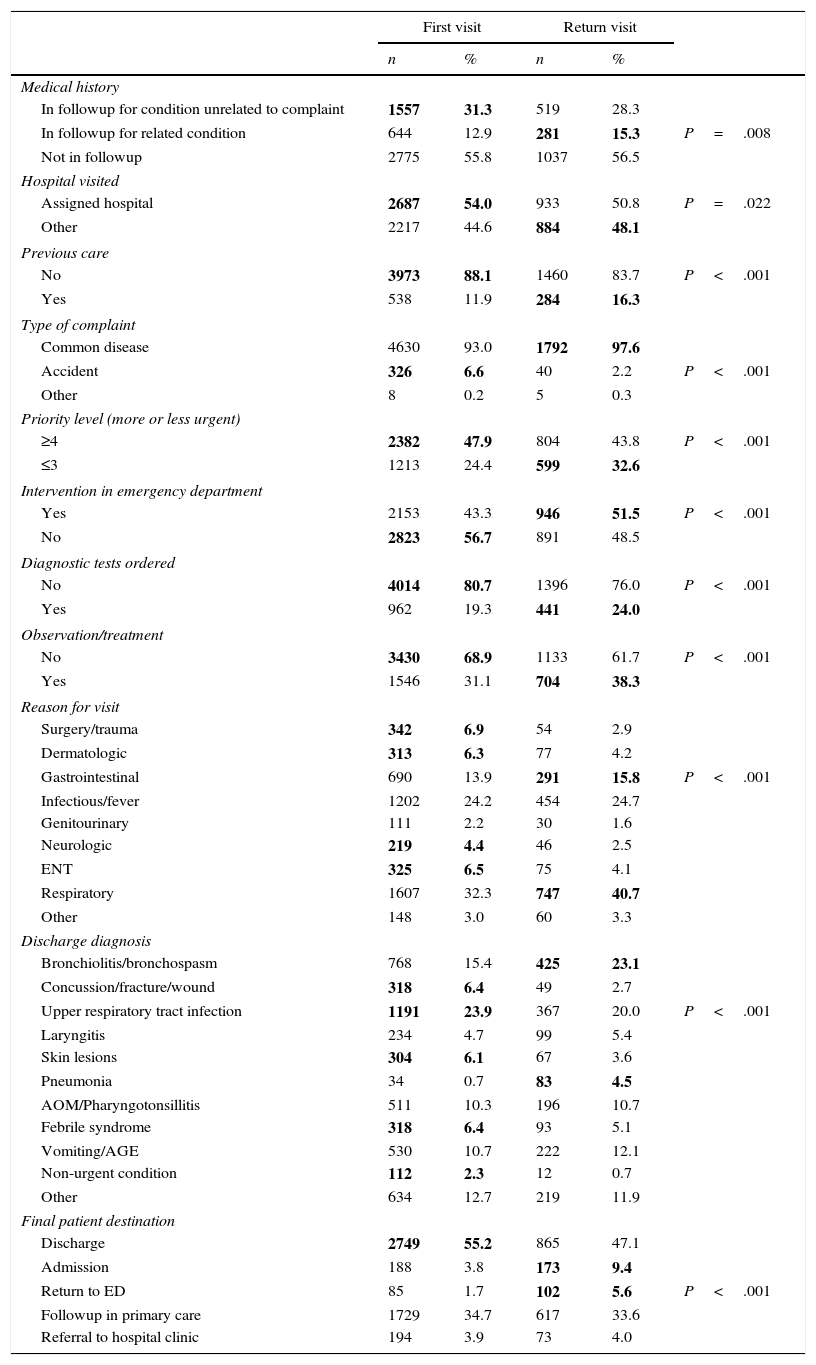
Table 5 presents the differences in the characteristics of first visits and return visits.
Analysis of first visits and return visits made by super-frequent users.
| First visit | Return visit | ||||
|---|---|---|---|---|---|
| n | % | n | % | ||
| Medical history | |||||
| In followup for condition unrelated to complaint | 1557 | 31.3 | 519 | 28.3 | |
| In followup for related condition | 644 | 12.9 | 281 | 15.3 | P=.008 |
| Not in followup | 2775 | 55.8 | 1037 | 56.5 | |
| Hospital visited | |||||
| Assigned hospital | 2687 | 54.0 | 933 | 50.8 | P=.022 |
| Other | 2217 | 44.6 | 884 | 48.1 | |
| Previous care | |||||
| No | 3973 | 88.1 | 1460 | 83.7 | P<.001 |
| Yes | 538 | 11.9 | 284 | 16.3 | |
| Type of complaint | |||||
| Common disease | 4630 | 93.0 | 1792 | 97.6 | |
| Accident | 326 | 6.6 | 40 | 2.2 | P<.001 |
| Other | 8 | 0.2 | 5 | 0.3 | |
| Priority level (more or less urgent) | |||||
| ≥4 | 2382 | 47.9 | 804 | 43.8 | P<.001 |
| ≤3 | 1213 | 24.4 | 599 | 32.6 | |
| Intervention in emergency department | |||||
| Yes | 2153 | 43.3 | 946 | 51.5 | P<.001 |
| No | 2823 | 56.7 | 891 | 48.5 | |
| Diagnostic tests ordered | |||||
| No | 4014 | 80.7 | 1396 | 76.0 | P<.001 |
| Yes | 962 | 19.3 | 441 | 24.0 | |
| Observation/treatment | |||||
| No | 3430 | 68.9 | 1133 | 61.7 | P<.001 |
| Yes | 1546 | 31.1 | 704 | 38.3 | |
| Reason for visit | |||||
| Surgery/trauma | 342 | 6.9 | 54 | 2.9 | |
| Dermatologic | 313 | 6.3 | 77 | 4.2 | |
| Gastrointestinal | 690 | 13.9 | 291 | 15.8 | P<.001 |
| Infectious/fever | 1202 | 24.2 | 454 | 24.7 | |
| Genitourinary | 111 | 2.2 | 30 | 1.6 | |
| Neurologic | 219 | 4.4 | 46 | 2.5 | |
| ENT | 325 | 6.5 | 75 | 4.1 | |
| Respiratory | 1607 | 32.3 | 747 | 40.7 | |
| Other | 148 | 3.0 | 60 | 3.3 | |
| Discharge diagnosis | |||||
| Bronchiolitis/bronchospasm | 768 | 15.4 | 425 | 23.1 | |
| Concussion/fracture/wound | 318 | 6.4 | 49 | 2.7 | |
| Upper respiratory tract infection | 1191 | 23.9 | 367 | 20.0 | P<.001 |
| Laryngitis | 234 | 4.7 | 99 | 5.4 | |
| Skin lesions | 304 | 6.1 | 67 | 3.6 | |
| Pneumonia | 34 | 0.7 | 83 | 4.5 | |
| AOM/Pharyngotonsillitis | 511 | 10.3 | 196 | 10.7 | |
| Febrile syndrome | 318 | 6.4 | 93 | 5.1 | |
| Vomiting/AGE | 530 | 10.7 | 222 | 12.1 | |
| Non-urgent condition | 112 | 2.3 | 12 | 0.7 | |
| Other | 634 | 12.7 | 219 | 11.9 | |
| Final patient destination | |||||
| Discharge | 2749 | 55.2 | 865 | 47.1 | |
| Admission | 188 | 3.8 | 173 | 9.4 | |
| Return to ED | 85 | 1.7 | 102 | 5.6 | P<.001 |
| Followup in primary care | 1729 | 34.7 | 617 | 33.6 | |
| Referral to hospital clinic | 194 | 3.9 | 73 | 4.0 | |
In bold face: significantly higher group of visits.
AGE, acute gastroenteritis; AOM, acute otitis media; ENT, ear-throat-nose.
This is the first multicentre study conducted in the paediatric population during a prolonged period that includes return visits.
The study was conducted in the Autonomous Community of Madrid, where there is a public health system with universal and free coverage both at the hospital and the primary care levels. Previous studies have found a higher frequency of use in public health users compared to private insurance users or the uninsured,16,17 so we would expect the prevalence of super-frequent users in the population of our study to be higher than that reported in the literature. We cannot compare our results with those of other studies in the paediatric population, as there are very few of them4,16–18 and the cut-off point that defines super-frequent users is not consistent between studies. We can say that the percentage of super-frequent users found in our study was slightly higher than the one reported in the adult population (0.4% of the population; 2.6% of visits).10–12
Despite the variability in the definition of frequent use, we decided to use the definition applied in the literature to super-frequent users12 as it is the group that makes the most visits and because it is also the subset analysed by the working group on high-frequency users in the adult population of our autonomous community.10,11
The follow-up period varies between published studies. Most research groups have established a predetermined time period6,19,20; while others propose a follow-up period relative to the first visit made.16
Our study was consisted with the results of other studies in the paediatric age group in that the highest proportion of super-frequent users corresponded to infants aged less than 1 year,16,17 although we were unable to compare the number of visits made by each age band, since these results have not been reported in the existing literature. The fact that the highest proportion of super-frequent users is found in the youngest children may be explained by the inexperience of parents, the frequent recurrence of infectious diseases at these ages, and the anxiety produced by disease in the parents of such young children.21
We found different frequencies of use of primary care in our sample, so we could not establish the presence of specific user profiles in this setting. Our results also did not provide grounds to state, as has been proposed, that adequate primary care is one of the factors that would contribute to reduce ED overuse.4,8
The distribution of visits throughout the year supports the description of these patients as loyal.11 This loyalty, combined with the lack of an association with the frequency of use of primary care, suggests that the factors that contribute to super-frequent ED use are not only the physical proximity and convenient hours of hospital settings,22 but also the immediacy of care, the available resources and the good reputation of EDs in the population.1,5,18,23
Although the published literature has shown an association between chronic disease and increased frequency of ED use,16 the proportion of children in our case series that were in followup for diseases related to their presenting complaint was relatively low.
We did not find a clear predominance of the need versus lack thereof for diagnostic tests or treatment, although as described in the literature, we found that the majority of visits involved less urgent conditions, at least in high-level-care hospitals, that did not require intervention of any kind.14,16 However, we did find a higher number of interventions in children that made second or successive visits. The level of priority assigned in triage was not documented routinely in low-level-care hospitals, so our results cannot be extrapolated to the entire population.
The diagnoses at discharge were consistent with those reported in the literature,16,17,24 with diseases that are known to have more protracted courses, such as bronchiolitis and bronchospasm, diagnosed most frequently in patients that made return visits. Super-frequent users did not require admission to the hospital more frequently that the general paediatric population in our area,25 although admissions were more frequent in the subset that made return visits.
The proportion of return visits in super-frequent users was nearly double than that of the proportion in the general paediatric population.14 However, and despite most of these visits being due to persisting symptoms, the percentage of patients that visited primary care before returning to the ED was much lower than those described in other studies.26
Considering all of the above, while most super-frequent users present with complaints that are not urgent and do not require intervention, in many cases the course of disease cannot be predicted and they may require urgent care at some point during the process. We may need to promote health education, encourage visiting primary care facilities, give detailed information on the possible course of the diseases that patients experience, and ensure an adequate understanding of the warning signs and the situations that require urgent evaluation. Providing adequate information and increasing the availability of primary care paediatricians during afternoon shifts could reduce the anxiety experienced by parents in relation to disease, and consequently lead to a reduction in the demand for urgent care.
Despite the difficulty of identifying frequent and super-frequent users prospectively, further research is required to explore not only clinical, but also sociocultural parameters in order to gain a broader understanding of the underlying causes of frequent use patterns.
LimitationsSince our study was conducted in a closed time interval, we had difficulty interpreting the variables related to patient age. While the clinical data are accurate, demographic variables refer to the age of the patient at the time of the first visit. Furthermore, patients changed age bands during the period under study, so there was a selection bias that was particularly marked in children aged less than 1 year. While these are the patients that visit most frequently, we probably underestimated the proportion of super-frequent users in this age group.
Comparing the results we obtained with those of the few other existing studies in the paediatric population would pose significant challenges, as the number of visits used to define frequent users varies widely among studies.
We performed a descriptive analysis of the super-frequent user population, and did not identify any characteristics that differed from those of the general population.
Since we conducted a retrospective study, not all patient records had data for all the variables under study.
ConclusionsThe characteristic super-frequent user profile in our study was a male patient of young age (less than 2 years) with visits distributed throughout the year, that visits the hospital nearest home in the afternoon shift, or otherwise a high-level-care hospital due to an acute condition for which care has not been previously sought at a primary care facility that does not usually require diagnostic tests or urgent treatment, and is discharged to the home or to primary care followup.
Return visits account for a considerable number of emergency department visits among super-frequent users, and their characteristics differ slightly from those of first visits. We would highlight that most are motivated by the persistence of symptoms, that they often involve conditions requiring urgent care, require more interventions—diagnostic tests, observation or treatment—and lead to hospital admission more frequently.
FundingThere is no financial gain for this study. None of the main or collaborating researchers will receive remuneration for actively participating in developing the study or data collection and processing.
Conflict of interestsThe authors have no conflict of interests to declare.
Hospital Gregorio Marañón: Vázquez López P, Marañón Pardillo R, Míguez Navarro MC, Mora Capín A, Lorente Romero J.
Hospital Universitario Doce de Octubre: Martínez Sobrino I, Espinós Martínez A, García Cárdaba LM.
Hospital Universitario de Getafe: González Arias M, Sánchez Rodríguez I.
Hospital Universitario del Tajo: García de Diego I.
Hospital Universitario Infanta Leonor: Muñoz López MC.
Hospital Universitario Ramón y Cajal: Vázquez Ordóñez C.
Hospital Universitario Clínico San Carlos: Gil López C.
Please cite this article as: Rivas García A, Manrique Martín G, Butragueño Laiseca L, Mesa García S, Campos Segura A, Fernández Iglesia V, et al. Hiperfrecuentadores en urgencias. ¿Quiénes son? ¿Por qué consultan? An Pediatr (Barc). 2017;86:67–75.
The members of the Working Group of the Pediatric Fidelized Patient of the Community of Madrid are presented in Anexo 1.
- Documento de manejo clínico del paciente pediátrico con infección por SARS-CoV-2.
(Actualizado el 26 de Noviembre de 2020) - Test de diagnóstico rápido en las consultas de Pediatría de Atención Primaria y Urgencias Pediátricas en la era COVID-19: más que una recomendación
(Actualizado el 21 de septiembre de 2020) - Consenso nacional sobre diagnóstico, estabilización y tratamiento del Síndrome Inflamatorio Multisistémico Pediátrico vinculado a SARS-CoV-2 (SIM-PedS).
(Actualizado el 27 de Julio de 2020) - Recomendaciones para el manejo del recién nacido en relación con la infección por SARS-CoV-2.
(Actualizado el 27 de Mayo de 2020) - Manejo del paciente pediátrico ante sospecha de infección por el nuevo coronavirus SARS-CoV-2 en atención primaria (COVID-19). AEPap-SEIP/AEP-SEPEAP.
(Actualizado el 27 de Abril de 2020) - Propuesta de adaptación de las recomendaciones de reanimación cardiopulmonar pediátrica avanzada a la infección por coronavirus.
(Actualizado el 11 de Abril de 2020)

Anales de Pediatría (English Edition) follows the Recommendations for the Conduct, Reporting, Editing and Publication of Scholarly Work in Medical Journals