
The school canteen plays today an essential role in child nutrition and for consolidating appropriate eating habits. In Spain, the guidelines for school meals have been established by the NAOS strategy and the Perseus programme, and are especially aimed at school children of 6–10 years. However, there is a lack of information on menus offered in pre-school education centres, which take in children of pre-school age. The aim of this study was to evaluate the composition and the food supplied in pre-schools of the province of Granada.
Material and methodsA study was conducted on the menus offered in public pre-schools in Granada, with a population of 420 children aged 2–6 years old. A total of 20 menus were analyzed, and details were collected including direct information on the ingredients used, the proportion of these in each dish, and the form of preparation. The daily intake of energy and nutrients, as well as the frequency of weekly supply of the different food groups were studied.
ResultsThe average energy content of the menus was 512.5kcal, distributed into protein (17.3%), carbohydrates (48.8%), and lipids (33.9%). A suitable supply of fibre (7.8g/day) was observed, but content of calcium and zinc did not reach recommended levels. The supply of vegetables was adequate, with a daily presence of salad, as well as vegetables, meat, fish and fruit.
ConclusionMenus evaluated represent an adequate content of energy, and proper supply of the different groups of foods, especially vegetables, fruits and salads. A great effort is observed in the centres to adapt meals to nutritional recommendations.
El comedor escolar realiza hoy día un papel esencial en la nutrición infantil y en la consolidación de los hábitos alimentarios. En España, existen directrices para los menús escolares dirigidas especialmente a niños de 6-10 años, pero hay una falta de información sobre los centros de educación infantil, que acogen a niños en edad preescolar. El objetivo de este trabajo fue evaluar la composición y la oferta alimentaria en centros de educación infantil de la provincia de Granada.
Material y métodosSe realizó un estudio de los menús ofertados en escuelas municipales de Granada, con una población de 420 comensales de 2-6 años de edad. Se analizaron 20 menús, recogiendo información sobre ingredientes utilizados, proporción de los mismos en cada plato y forma de preparación. Se estudiaron el aporte de energía y nutrientes, y la frecuencia de la oferta semanal de los distintos grupos de alimentos.
ResultadosEl contenido energético medio de los menús fue de 512,5kcal, distribuido en proteínas (17,3%), hidratos de carbono (48,8%) y lípidos (33,9%). Se observó un aporte de fibra adecuado (7,8g/día), pero escaso de calcio y cinc. La oferta de verduras y hortalizas fue adecuada, con una presencia diaria de ensalada, así como la de legumbres, carnes, pescados y frutas.
ConclusiónLos menús evaluados suponen un aporte energético adecuado, y una oferta correcta de los diferentes grupos de alimentos, especialmente verduras, frutas y ensaladas. Se aprecia un gran esfuerzo de los centros para adecuar las comidas a las recomendaciones nutricionales.
Childhood may be the most delicate stage of life when it comes to nutrition, on one hand due to the intense growth experienced by the child that demands additional nutrients for tissue development, and on the other because it is in this period that individuals acquire the dietary habits that will persist through adulthood and influence the prevention of multiple diseases related to nutrition.1 Furthermore, children are a population subset that is particularly receptive to dietary changes and nutrition education.
The school lunchroom plays a key role in this stage, both in providing adequate nutrition for optimal growth and development and in the consolidation of appropriate dietary habits. It can become a cornerstone in the prevention of obesity, which is a priority objective in Western societies.2 The demand for school dining services has increased considerably in recent times, in part due to parental time constraints associated to the incorporation of women to the workforce, and also due to increasing distances between homes and schools. According to recent statistics from the Ministry of Education, Culture and Sports, approximately 60% of schools registered in Spain offer dining services, but this figure rises to 75% in nurseries and preschools (ages 1–6 years).3 These centres have experienced substantial growth in Spain: while the total increase in the number of schools in the past 10 years has been of 20%, preschools have increased by more than 60%. It is estimated that 25% of schoolchildren in Spain use the dining services, with children enrolled in preschool and primary school amounting to 87.2% of the total users.4 This is because nearly all children enrolled in preschool use the school dining services. There is also a huge demand for school dining services in other countries: it is estimated that three million children in the United Kingdom5 and thirty million in the United States6 eat in school every day.
Given the importance of school cafeterias, most developed countries have created legislation to define nutrition standards for the preparation of school menus, drawing specific plans that aim at health promotion through nutrition in the paediatric population.7,8 In Spain, a Consensus Document on Nutrition in Schools was developed in the context of the Nutrition, Physical Activity and Obesity Prevention strategy (Nutrición, Actividad física y Prevención de la Obesidad [NAOS]), approved by the Consejo Interterritorial (Interterritorial Council) of the Spanish Health System and reviewed by the Federación Española de Sociedades de Nutrición, Alimentación y Dietética (Spanish Federation of Societies on Nutrition, Diet and Dietetics) and other associations of experts. The document established nutritional standards for the planning of school menus and the conditions that must be met by school canteens.9 In addition, the Pilot School-Based Reference Programme for Health and Exercise against Obesity (Programa Piloto Escolar de Referencia para la Salud y el Ejercicio contra la Obesidad [PERSEO])10 aims at promoting healthy dietary and exercise habits in schools settings. Its Guideline on School Canteens presents the guidelines for the preparation of school menus and the standards that must be met by school canteens, and is aimed at children aged 6–10 years. However, the legislation and dietary guidelines for lunchrooms in early childhood education centres serving children aged 2–6 years are very limited both in Spain and in other countries, probably because meals consumed at home are considered more important in this age group. Yet, as noted above, an increasing number of children attend nurseries and preschools and have lunch in these facilities. Lunch is the most important meal of the day, as it is meant to contribute between 30% and 35% of the total daily energy intake.1 Several previous studies have analyzed the nutrient composition of school menus in different Spanish cities,11–13 but there is a dearth of data on the meals consumed in nurseries and preschools.
The aim of this study was to conduct a nutritional assessment of the menus offered in preschools in the province of Granada, analysing their energy and nutrient contents and the frequency with which different food groups were consumed.
Materials and methodsWe conducted a study of the menus offered at the public preschools of the city of Granada that are under the administrative authority of the Fundación Granada Educa.14 These schools serve a total of 420 children aged 2–6 years, 100% of whom use the school dining services.
We analyzed the menus corresponding to four weeks, a total of 20, all of which consisted of first course, second course and dessert. The menus are repeated on a four-week cycle. We held meetings with the heads of dining services in each school, whose cooperation in the study was invaluable for learning the exact composition of the menus (Table 1), the ingredients used, the cooking methods employed, and the portions served. To make the nutritional assessment, we used the mean amounts offered in the canteen, keeping in mind that those amounts might have been adjusted based on children's ages. We converted the foods to energy and nutrient intakes using the Tablas de Composición de Alimentos Españoles15 (Spanish Food Composition Tables) and the software Alimentación y Salud (ASDE, SA, Valencia, Spain). Furthermore, we analyzed the menus based on the relative contribution of each macronutrient to the total energy intake, and compared the results to the dietary recommendations for the 4- to 6-year age group.16 We assessed how frequently different food groups were offered weekly, by group and relative to total consumption, and compared the results with the recommendations of the PERSEO programme for school canteens10 and the NAOS strategy for schools.9 We quantified portions by considering each dish one portion and each side dish a half portion.
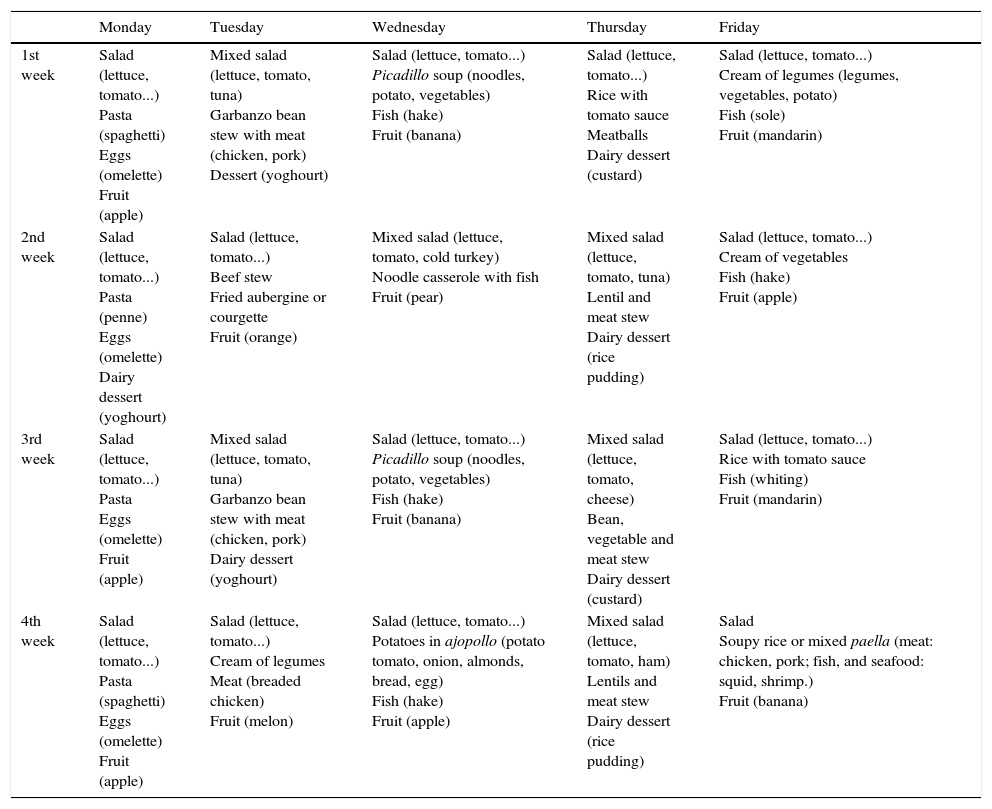
Menus offered in school canteens.
| Monday | Tuesday | Wednesday | Thursday | Friday | |
|---|---|---|---|---|---|
| 1st week | Salad (lettuce, tomato...) Pasta (spaghetti) Eggs (omelette) Fruit (apple) | Mixed salad (lettuce, tomato, tuna) Garbanzo bean stew with meat (chicken, pork) Dessert (yoghourt) | Salad (lettuce, tomato...) Picadillo soup (noodles, potato, vegetables) Fish (hake) Fruit (banana) | Salad (lettuce, tomato...) Rice with tomato sauce Meatballs Dairy dessert (custard) | Salad (lettuce, tomato...) Cream of legumes (legumes, vegetables, potato) Fish (sole) Fruit (mandarin) |
| 2nd week | Salad (lettuce, tomato...) Pasta (penne) Eggs (omelette) Dairy dessert (yoghourt) | Salad (lettuce, tomato...) Beef stew Fried aubergine or courgette Fruit (orange) | Mixed salad (lettuce, tomato, cold turkey) Noodle casserole with fish Fruit (pear) | Mixed salad (lettuce, tomato, tuna) Lentil and meat stew Dairy dessert (rice pudding) | Salad (lettuce, tomato...) Cream of vegetables Fish (hake) Fruit (apple) |
| 3rd week | Salad (lettuce, tomato...) Pasta Eggs (omelette) Fruit (apple) | Mixed salad (lettuce, tomato, tuna) Garbanzo bean stew with meat (chicken, pork) Dairy dessert (yoghourt) | Salad (lettuce, tomato...) Picadillo soup (noodles, potato, vegetables) Fish (hake) Fruit (banana) | Mixed salad (lettuce, tomato, cheese) Bean, vegetable and meat stew Dairy dessert (custard) | Salad (lettuce, tomato...) Rice with tomato sauce Fish (whiting) Fruit (mandarin) |
| 4th week | Salad (lettuce, tomato...) Pasta (spaghetti) Eggs (omelette) Fruit (apple) | Salad (lettuce, tomato...) Cream of legumes Meat (breaded chicken) Fruit (melon) | Salad (lettuce, tomato...) Potatoes in ajopollo (potato tomato, onion, almonds, bread, egg) Fish (hake) Fruit (apple) | Mixed salad (lettuce, tomato, ham) Lentils and meat stew Dairy dessert (rice pudding) | Salad Soupy rice or mixed paella (meat: chicken, pork; fish, and seafood: squid, shrimp.) Fruit (banana) |
All menus included one serving of bread (15g), except on days when pasta was offered.
Olive oil was used for cooking and salad dressings.
We calculated the means and standard deviations (SDs) of these values using the application StatGraphics Centurion XV, version 15.2.06 (StatPoint Inc).
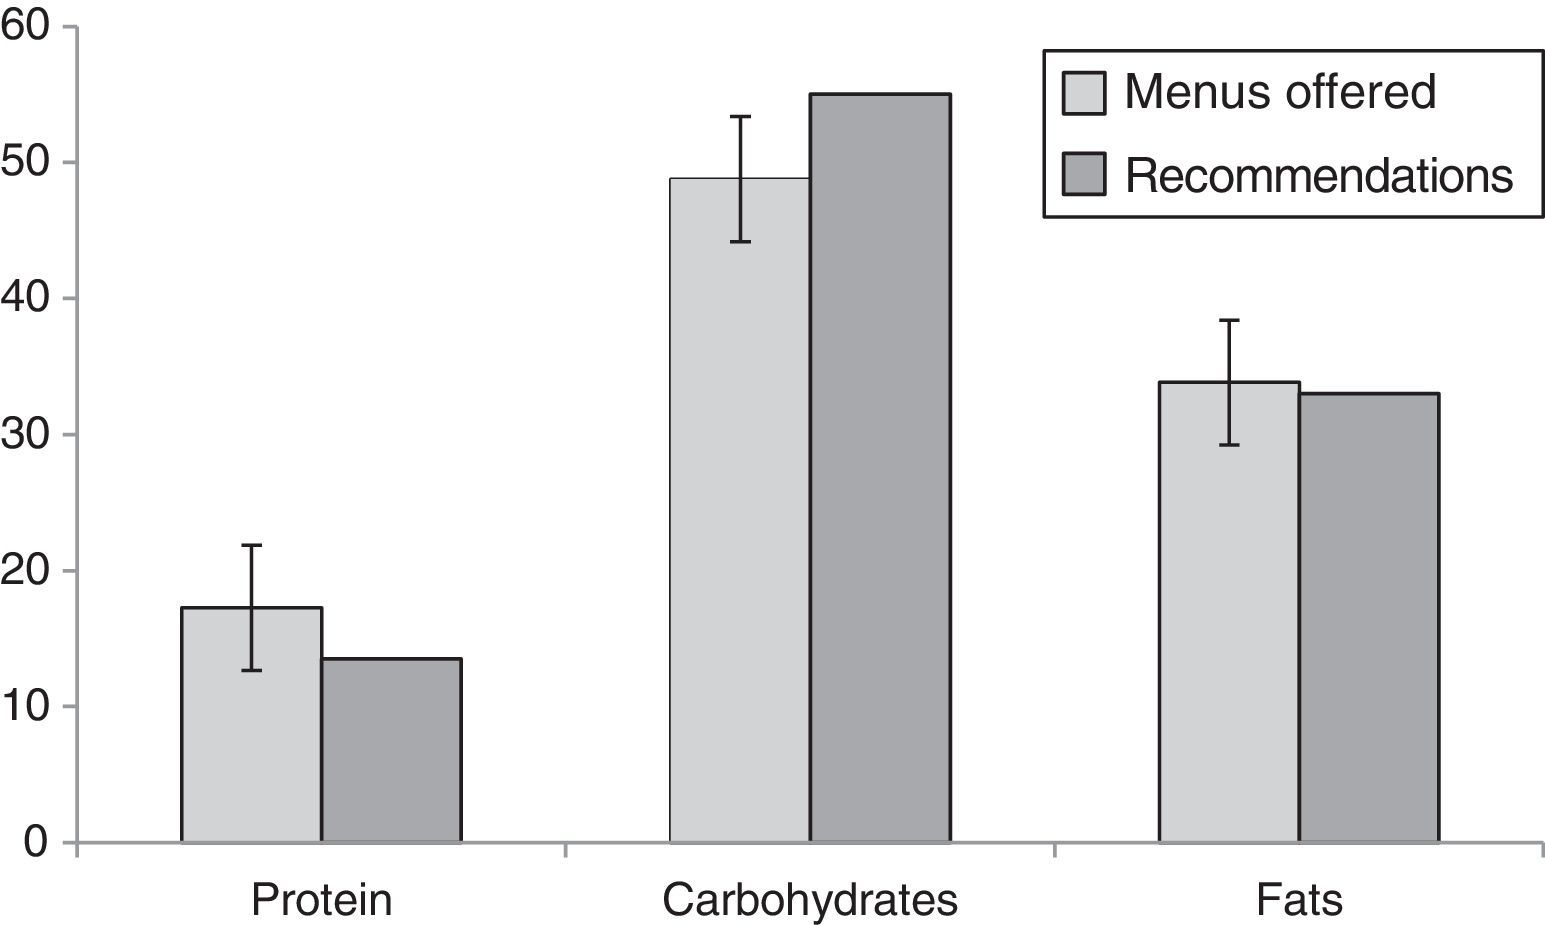
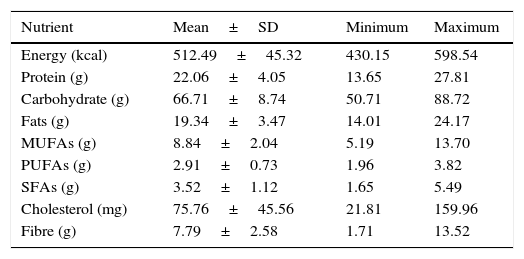
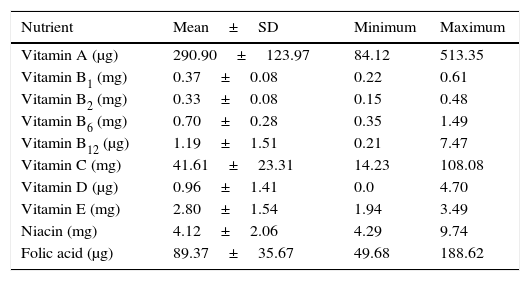
ResultsTable 2 shows the mean, standard deviation, minimum and maximum of the energy and nutrients contained in the assessed menus. Tables 3 and 4 show the mean values of vitamins and minerals, respectively. Fig. 1 shows the distribution of energy intake by macronutrient in the menus, comparing it to recommended values. The percentage of the total energy contributed by proteins, carbohydrates and fats in the menus was 17.3%, 48.8% and 33.8%, respectively.
Energy and macronutrient content of menus offered in public preschools in Granada.
| Nutrient | Mean±SD | Minimum | Maximum |
|---|---|---|---|
| Energy (kcal) | 512.49±45.32 | 430.15 | 598.54 |
| Protein (g) | 22.06±4.05 | 13.65 | 27.81 |
| Carbohydrate (g) | 66.71±8.74 | 50.71 | 88.72 |
| Fats (g) | 19.34±3.47 | 14.01 | 24.17 |
| MUFAs (g) | 8.84±2.04 | 5.19 | 13.70 |
| PUFAs (g) | 2.91±0.73 | 1.96 | 3.82 |
| SFAs (g) | 3.52±1.12 | 1.65 | 5.49 |
| Cholesterol (mg) | 75.76±45.56 | 21.81 | 159.96 |
| Fibre (g) | 7.79±2.58 | 1.71 | 13.52 |
Vitamin content of menus offered in public preschools in Granada.
| Nutrient | Mean±SD | Minimum | Maximum |
|---|---|---|---|
| Vitamin A (μg) | 290.90±123.97 | 84.12 | 513.35 |
| Vitamin B1 (mg) | 0.37±0.08 | 0.22 | 0.61 |
| Vitamin B2 (mg) | 0.33±0.08 | 0.15 | 0.48 |
| Vitamin B6 (mg) | 0.70±0.28 | 0.35 | 1.49 |
| Vitamin B12 (μg) | 1.19±1.51 | 0.21 | 7.47 |
| Vitamin C (mg) | 41.61±23.31 | 14.23 | 108.08 |
| Vitamin D (μg) | 0.96±1.41 | 0.0 | 4.70 |
| Vitamin E (mg) | 2.80±1.54 | 1.94 | 3.49 |
| Niacin (mg) | 4.12±2.06 | 4.29 | 9.74 |
| Folic acid (μg) | 89.37±35.67 | 49.68 | 188.62 |
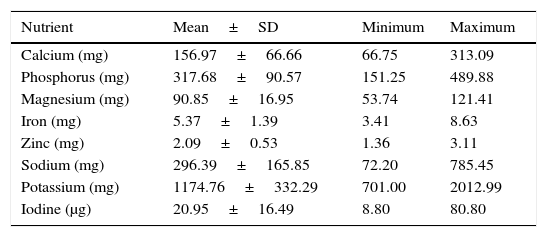
Mineral content of menus offered in public preschools in Granada.
| Nutrient | Mean±SD | Minimum | Maximum |
|---|---|---|---|
| Calcium (mg) | 156.97±66.66 | 66.75 | 313.09 |
| Phosphorus (mg) | 317.68±90.57 | 151.25 | 489.88 |
| Magnesium (mg) | 90.85±16.95 | 53.74 | 121.41 |
| Iron (mg) | 5.37±1.39 | 3.41 | 8.63 |
| Zinc (mg) | 2.09±0.53 | 1.36 | 3.11 |
| Sodium (mg) | 296.39±165.85 | 72.20 | 785.45 |
| Potassium (mg) | 1174.76±332.29 | 701.00 | 2012.99 |
| Iodine (μg) | 20.95±16.49 | 8.80 | 80.80 |

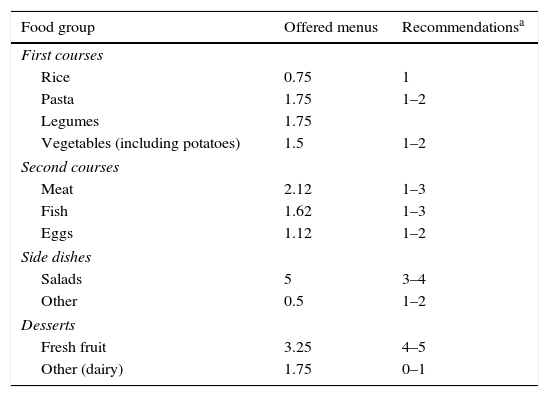
The menu offered daily (Table 1) consisted of salad, first course, second course and dessert. The sole drink was tap water, served on demand. The first course was eliminated on days that the menu included legumes cooked with meat. First courses were mostly prepared with pasta, legumes, rice and vegetables. Second courses consisted mostly of high-protein foods, such as meat, fish and eggs. Fruit was the most frequent dessert, although dairy desserts were also offered. Table 5 presents how frequently different food groups were consumed, expressed in portions per week, and grouped into vegetables (differentiating between raw and cooked), pasta/rice, potatoes, legumes, meat, fish, eggs, fruit, dairy, bread and prepackaged meals, while Table 6 presents the consumption of foods distributed into first and second courses, side dishes and desserts.
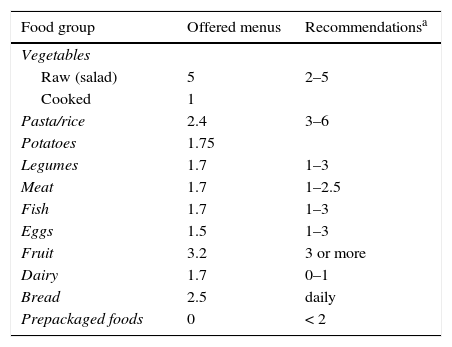
Frequency of consumption of foods (portions/week) offered in public preschools in Granada by food group. Comparison with recommendations.
| Food group | Offered menus | Recommendationsa |
|---|---|---|
| Vegetables | ||
| Raw (salad) | 5 | 2–5 |
| Cooked | 1 | |
| Pasta/rice | 2.4 | 3–6 |
| Potatoes | 1.75 | |
| Legumes | 1.7 | 1–3 |
| Meat | 1.7 | 1–2.5 |
| Fish | 1.7 | 1–3 |
| Eggs | 1.5 | 1–3 |
| Fruit | 3.2 | 3 or more |
| Dairy | 1.7 | 0–1 |
| Bread | 2.5 | daily |
| Prepackaged foods | 0 | < 2 |
Frequency of consumption (mean number of portions/week) of food groups by meal course in the offered menus. Comparison with recommendations.
| Food group | Offered menus | Recommendationsa |
|---|---|---|
| First courses | ||
| Rice | 0.75 | 1 |
| Pasta | 1.75 | 1–2 |
| Legumes | 1.75 | |
| Vegetables (including potatoes) | 1.5 | 1–2 |
| Second courses | ||
| Meat | 2.12 | 1–3 |
| Fish | 1.62 | 1–3 |
| Eggs | 1.12 | 1–2 |
| Side dishes | ||
| Salads | 5 | 3–4 |
| Other | 0.5 | 1–2 |
| Desserts | ||
| Fresh fruit | 3.25 | 4–5 |
| Other (dairy) | 1.75 | 0–1 |
The school canteen can provide the ideal framework for children to have a healthy and balanced diet adjusted to their nutritional needs, and can be a useful tool in the learning and adoption of healthy dietary habits that may have a positive impact on health development and promotion at later ages.
Lunch, which is given at the school canteen, is the main meal of the day and must contribute between 30% and 35% of the total daily energy and nutrient intake. This easily explains the importance attributed to the menus served at school canteens. The menus of preschools in Granada contributed a mean of 512.49kcal/day, which corresponded to 30.15% of the recommended intake for the 4- to 6-year age group16 (1700kcal/day), and thus were adequate from an energy standpoint. There are few data on the composition of meals offered in preschools, so the findings of this study provide novel information. However, previous studies have analyzed the menus offered in Spanish schools, for instance in Madrid,17 Tenerife12 or Granada,11 which contributed between 35% and 38% of the recommended daily energy intake, percentages that were higher than those found in our study.
Although the energy contribution of each nutrient needs to be assessed taking into account the total intake for the day, we observed that the lunches had a high protein content (exceeding 17% of the total energy, compared to the recommended 10–15%), which is a common occurrence in school meals, whose protein content can contribute up to 20% of the total daily energy intake.11 In contrast, carbohydrates contributed fewer than the recommended calories (55%), while fats contributed more than the recommended 30%. The excessive energy contribution of proteins and fats to the detriment of carbohydrates found in our study was consistent with the findings of other studies of school canteens conducted in Spain11–13 and with the assessment conducted in the PERSEO programme that included school menus in eight autonomous communities,10 the results of which showed that proteins, fats and carbohydrates contributed a mean of 18%, 40% and 44% of the total energy, respectively. Evidence from various sources suggests that even from the first year of life, an excessive intake of proteins and fats may be associated with the future onset and development of obesity,18,19 and thus it is advisable that the food consumed the rest of the day compensates for these imbalances.
The quality of fats is related to their lipid profile, which corresponds to the proportion of the three types of fatty acids – saturated (SFAs), monounsaturated (MUFAs) and polyunsaturated (PUFAs) – relative to the total energy. We found that MUFAs contributed 15.5% of the total energy intake, PUFAs 5.11% and SFAs 6.2%, values that were within the established nutritional objectives for the Spanish population20 (MUFAs, 15%–20%; PUFAs, 5%; SFAs, <7–8% of the total energy intake). The exclusive use of olive oil in the preparation of the menus ensures an adequate MUFA content. There are additional measures to assess the quality of fats, such as the PUFA/SFA ratio, which was 0.8 in the menus under study and therefore met the nutritional objectives20 (PUFA/SFA ≥0.5). Still, it would be even more appropriate to include MUFAs in this ratio, given the higher consumption of olive oil in the Mediterranean diet. In this case, the value obtained for the (PUFA+MUFA)/SFA ratio in the assessed menus was greater than 2, which is the minimum recommended. The mean cholesterol content was 148mg/1000kcal, which exceeded the maximum recommended amount of 120mg/1000kcal by slightly more than 20%.
When it comes to the intake of fibre, the American Health Foundation recommends that children aged more than 2 years to 18 years consume a minimal amount of dietary fibre equivalent to “age plus 5” grams per day.21 The menus contained a mean of 7.79g/day of fibre from their vegetables, fruits and salads, a significant contribution to the recommended daily intake. The fact that a plate of salad is offered every day guarantees an adequate intake of fibre and other nutrients (vitamins, minerals and complex carbohydrates). It is important to get preschoolers accustomed to consuming adequate amounts of these foods, which have a positive influence on the establishment of healthy dietary habits.
The vitamin contents of the menus (Table 3) were adequate in general, and the amounts of several (vitamin A, vitamin C and folic acid) exceeded the contribution required of school menus,22 which was consistent with the meals analyzed in other schools.11–13 The vitamin D content, however, was low, although this is not particularly worrisome taking into account that this lower intake can be compensated in the other meals of the day, in addition to the potential endogenous synthesis of this vitamin resulting from exposure to sunlight.
When it came to minerals (Table 4), the mean calcium content contributed 16% of the recommended daily allowance,16 and the mean zinc content 21%. We found higher values for the amounts of phosphorus, magnesium and iron, which contributed up to 64%, 45% and 60% of the recommended daily intake. The calcium content of the menus amounted to approximately half of the 300mg recommended for school lunches.22 However, we must take into account that dairy is the main source of dietary calcium, and that dairy products are mostly consumed during breakfast and the afternoon snack in Spain, meals that typically contribute 75% of the daily calcium intake.23 Thus, it could be argued that the recommendation that school lunches provide 30% of the daily calcium intake (300mg of the 1000mg/day) is excessive, as other meals tend to compensate for the lower consumption of dairy during lunch.
Our study shows that the weekly offering of foods (Table 5) includes a wide range of vegetables, usually seasonal and consumed raw, in the form of salad or side dishes for the first course. According to the recommendations of the PERSEO programme, vegetables should be included in the school menu every day of the week either in the first course or as a side dish. This was clearly fulfilled in the analyzed menus, which offered six portions of vegetables per week, exceeding the amounts offered by other school canteens.13,24 Several studies13,24–26 have shown that vegetables and fruits are among the foods rejected most often by children and adolescents, and thus public schools in Granada are making a significant contribution in this regard by including these foods in a consistent and varied manner in the menus offered in their canteens.
The offer of starches (pasta, rice, potatoes) and legumes consisted of 4, 15 and 1.7 portions/week, respectively, which seems to adhere to recommendations adequately. On the other hand, the supply of foods with high protein contents (meat, fish and eggs) was also adequate and always stayed within the recommended ranges for school canteens. Other studies have found a higher supply of meat in school canteens, ranging between 2.5 and 3.3 portions a week, with a lower supply of fish (1.4 portions/week).2,13 Fruit was given 3.2 times a week, surpassing the recommended minimum of three portions. There was an excessive supply of dairy desserts, as recommendations state that they should only be served occasionally. However, this recommendation is not consistent with the amount of calcium that should be supplied through the school menu, which would be hard to achieve excluding dairy from the diet. The supply of bread was below the recommended amount, which calls for it being given daily.
The distribution of the different food groups in the various courses of the assessed menus adhered to a great extent to the school meal standards of the NAOS strategy9 (Table 6), although the supply of pasta, salads and dairy desserts exceeded recommendations. According to a study of school canteens in various autonomous communities,24 on average, the food offered as first course (in times/week) was pasta (1), potatoes (1), rice (1), legumes (1) and vegetable dishes (1); the food offered for second course included meat twice a week and fish once a week; and the desserts consisted of fruit three times a week and dairy twice a week. Compared to these data, the means of canteens in public preschools in Granada were of better quality, as they offered greater amounts of legumes, vegetables, salads, fish and fruit.
ConclusionThere are few data on the food offerings in preschool lunchrooms in Spain, despite the importance of establishing healthy dietary habits from early childhood. This study offers novel data on the menu composition in preschools in Granada and relevant results that allow for coordinated interventions in the school and home settings. We observed that these preschools have strived to offer school meals that adhere to the nutritional recommendations of various organizations, as, despite them having a slightly high protein content, they contained adequate amounts of vegetables (mainly salads), legumes, fish and fruit. The composition of these menus could serve as an example to establish adequate nutritional foundations in early childhood.
Conflicts of interestThe authors have no conflict of interests to declare.
Please cite this article as: Seiquer I, Haro A, Cabrera-Vique C, Muñoz-Hoyos A, Galdó G. Evaluación nutricional de los menús servidos en las escuelas infantiles municipales de Granada. An Pediatr (Barc). 2016;85:197–203.