
The objective of the study was to analyse the nutritional patterns of children under three years of age and to compare the results against the recommendations for energy and nutrient intake.
Patients and methodsIn this cross-sectional epidemiological study, parents completed a dietary diary on their food intake of their children on 4 non-consecutive days. The percentage of children with mean intakes below the recommendations for each age and nutrient was analysed using the “Estimated Average Requirement (EAR) cut-point method.”
ResultsA total of 186 paediatricians included 1701 children in the study. A total of 95.9% (n=1320) of the children between 7 and 36 months had a protein consumption more than twice that of the Recommended Daily Allowances. The deficiencies observed (%P=.013) and of carbohydrates (P<.0001), and a lower percentage of total lipids (P<.0001), were related to a greater body mass index, regardless of energy intake.
ConclusionsThe study presents a very detailed view of the eating patterns of Spanish children less than three years of age. The encouragement of healthy feeding should be directed towards the correction of the dietary imbalances detected, in order to promote the future health of children.
El objetivo del estudio fue analizar el patrón de alimentación de niños menores de 3 años y comparar los resultados con las recomendaciones de consumo energético y de nutrientes.
Pacientes y métodosEn este estudio epidemiológico transversal, los padres completaron un diario dietético sobre el consumo de alimentos de sus hijos, durante 4 días no consecutivos. Se analizó la proporción de niños con ingestas medias inferiores a las recomendaciones para cada edad y nutriente, mediante el método «Estimated Average Requirement (EAR) cut-point method».
ResultadosParticiparon 186 pediatras, que incluyeron a 1.701 niños. El 95,9% (n=1320) de los niños de 7 a 36 meses consumieron proteínas por encima del doble de las Recommended Dietary Allowances. Las deficiencias observadas (% < EAR) en los grupos de edad de 13-24 meses y 25-36 meses, respectivamente, fueron: vitamina D en el 81,7 y el 92,1%; vitamina E en el 39,3 y el 53,4%; ácido fólico en el el 12,5 y el 14,8%; calcio en el 10,1 y el 5,5%; yodo en el 27,1 y el 31%. Se observó que una mayor proporción en el consumo diario de proteínas (p=0,013) y de hidratos de carbono (p<0,0001), y una menor proporción de lípidos totales (p<0,0001), estaban relacionadas con un mayor índice de masa corporal, independientemente del consumo energético.
ConclusionesEl estudio mostró una visión muy detallada de los patrones de alimentación de los niños españoles menores de 3 años. La promoción de una alimentación saludable debería ir dirigida a la corrección de los desequilibrios dietéticos detectados, para favorecer la salud futura de los niños.
Nutrition is one of the main determinants of health in humans. An adequate nutrition is essential across the lifespan, but it is of particular importance during childhood, as nutritional deficiencies and imbalances in this period may not only have deleterious effects on children's health, but also impact on their future health as adults. An inadequate nutrition may increase the risk of developing several chronic disorders (cancer, high blood pressure, coronary artery disease and other cardiovascular diseases, cerebrovascular diseases, type 2 diabetes mellitus, obesity, osteoporosis) that are the main causes of morbidity and mortality.1,2
If we take action during childhood, we can influence the learning and development of future dietary habits and lifestyle. But the first step is to observe the baseline, to recognise the deviation from the recommended dietary patterns and assess the magnitude of this problem. The ALSALMA study was created to this end, a three-phase project designed to explore the clinical perception of paediatricians and the opinion of parents regarding the main nutritional problems in children.3 The third phase of the project consisted of an epidemiological study, preceded by a pilot study,4 the purpose of which was to assess the actual nutrient intake of a representative sample of Spanish children less than 3 years of age. This study is the first of its kind in this age group in Spain, and this article presents the results of the quantitative analysis of nutrient intakes.
MethodsStudy design and ethical principlesWe designed an observational cross-sectional epidemiological study adhering to the principles applicable to observational studies in Spain and to the Declaration of Helsinki. The study was approved by the Ethics Board of the Hospital Clínic i Provincial de Barcelona (2.013/8.152). All parents signed an informed consent to participate in the study.
Selection criteriaThe sample size was calculated on the basis of the energy intake data obtained in the ALSALMA-pilot study,4 and the minimum size was estimated to be 200 children 0–6 months of age (precision, 24.08; power [β], 81.3%); 200 children 7–12 months of age (precision, 32.57; β, 85.3%); 800 children 13–24 months of age (precision, 22.41; β 86.5%), and 800 children 25–36 months of age (precision, 25.32; β, 87.2%). The sample was stratified by province.5
The parents included in the study had to have children that met the following criteria: (a) of any ethnicity or sex; (b) 0–36 months of age; (c) meeting the criteria for a healthy child, with no chronic condition that might affect their dietary intake, and (d) not following a specific diet.
Data collectionWe designed a 24-h diet diary for the parents, who were instructed by the paediatricians on how to complete it, writing down the type of food, time of day, and quantities consumed. The diary included the weight of the foods, measured uncooked and unpeeled. The full name of product and brand was recorded for processed child nutrition products. When the volume of breast milk could not be measured, it was estimated according to the child's age: 700–900mL/day in children younger than 6 months and 600mL/day in children older than 6 months.6,7
The diaries were completed over 4 non-consecutive days during the week and at the weekend. The paediatricians recorded the child's date of birth, sex, birth and current weight and height, weeks of gestation, physical activity level (light, moderate, vigorous), whether the child ate at the day care centre, and intake of vitamin supplements (description and dosage). The anthropometric data of the parents, whether the mother smoked during the pregnancy, and the parents’ educational level were also recorded.
Quality controlThe information collected in the diaries was reviewed by the paediatricians, who entered the data in the study's website (www.estudioalsalma.es). A centralised quality control of the data was performed by a specially trained coordinating medical team.
Statistical analysisWe analysed the frequencies and percentages for qualitative variables, and the mean±standard deviation, median, minimum, maximum, and 95% confidence interval for quantitative variables.
We converted each consumed food to its macronutrient and energy contents using the DIAL foods database and other Spanish and international databases, analysing the edible portion.8–11 We created a new database of more than 460 nutrition datasheets with the composition of child formulas and nutrition products.
We calculated the mean daily intake of energy and of each nutrient based on the data collected in the diaries using repeated-measure split–plot analysis of variance (ANOVA). We studied the energy intake profile or energy distribution by macronutrient for every 100kcal.
We compared the results of our study with the Dietary Reference Intake (DRI) recommendations of the National Academy of Sciences (2002/2005) and the recommendations of the Comité de Nutrición de la Asociación Española de Pediatría (Committee on Nutrition of the Spanish Association of Paediatrics).12–14 The calculations for the estimated average requirement (EAR) of energy were made based on weight and sex for children 7–11 months of age, and based on the child's sex for children older than 12 months. We did not calculate the energy EAR for infants younger than 6 months, which can only be evaluated in exclusively breastfed infants.15 We used the Estimated Average Requirement cut-point method, which is recommended by the Institute of Medicine16 and was adopted by the EFSA in 2010,17 to determine the population prevalence of intakes below those recommended.
We used one-factor ANOVA to analyse differences in weight, height and body mass index (BMI) between age groups, using a Bonferroni or Games Howell adjustment to correct for multiple comparisons. Proportions were compared by means of Fisher's exact test or the chi square test.
We conducted the exploratory assessments of the association between nutrient intake and BMI by means of a multiple linear regression analysis that included all the variables recorded for children and their parents. Macronutrients were assessed by the mean intake and by contribution to the total energy intake using different equations. We adjusted the significance levels based on the number of variables included in the equation.
We set the level of significance at .05. The software used in the statistical analysis was SPSS 14.0, C-SIDE (Iowa State University) for the EAR assessment, and WHO Anthro for the anthropometric assessment.18
ResultsSample dataThere were 186 participating paediatricians that included 1701 children in the study between April 4 and October 14, 2013. The sample reached 85% of the initial sample size estimation (2000 children; power>80%). The data of 1559 children, who amounted to 91.7% of the patients selected for the study, was valid and could be used in the nutritional analysis.
Demographic and anthropometric data of the childrenThe sample, which included children from 51 provinces, matched the national distribution and was representative of the Spanish population.19 Out of all children, 54% were male (n=919) and 46% female (n=782), with a mean age of 20 months (95% CI, 19.5–20.5) and a median age of 20 months; 99.9% were Caucasian (n=1699). The age distribution was: 10.8% (n=183) 0–6 months; 10.9% (n=186) 7–12 months; 40.6% (n=690) 13–24 months; and 37.7% (n=642) 25–36 months.
The mean gestational age was 39 weeks (95% CI, 38.9–39.1; median 39), with no differences between sexes or age groups.
We did not observe any differences in the birth weight, height or BMI between children in the 4 age groups. The current BMI of children was 16.5kg/m2 (95% CI, 16.4–16.6). Using the standards of the World Health Organization (WHO Anthro) as a reference, we determined that 6.1% of the children were 2 standard deviations (SDs) above the mean BMI (95% CI, 4.2–8.7%) and 1.5% of the children were 3 SDs above (1.1–2.1%). The physical activity level was light in 15.2% of the children (n=259), moderate in 53.9% (n=916) and vigorous in 30.9% (n=526).
Of all children, 32.9% (n=559) ate at the day care centre. This proportion increased significantly with the child's age (P<.0001).
Also, 14.6% of the children (n=248) took vitamin supplements, in greater proportion the younger the children (P<.01). The supplement was vitamin D3 in 74.5% of them (n=173 children).
Parent dataThe mean age was 34.7 years in mothers (95% CI, 34.5–34.9; median 35) and 36.8 years in fathers (95% CI, 36.5–37; median 36). Of all mothers, 7.2% smoked during pregnancy (n=123). The educational level of mothers and fathers, respectively, was: no studies 0.1%, 0.2%; elementary school 6.8%, 9.2%; secondary education 14.5%, 16.2%; middle vocational education 14.3%, 16.2%; superior vocational education 12.8%, 15.3%, and post-secondary education 51.4%, 42.9%.
Mean daily energy and nutrient intake and comparison with Dietary Reference Intakes (Estimated Average Requirement and Upper limits)
We analysed 76,472 intakes of 1265 different foods. Tables 1–4 summarise the results of the mean daily intake for each macronutrient by age group and the proportion of children with intakes below the EAR or above the upper limit (UL).11–13
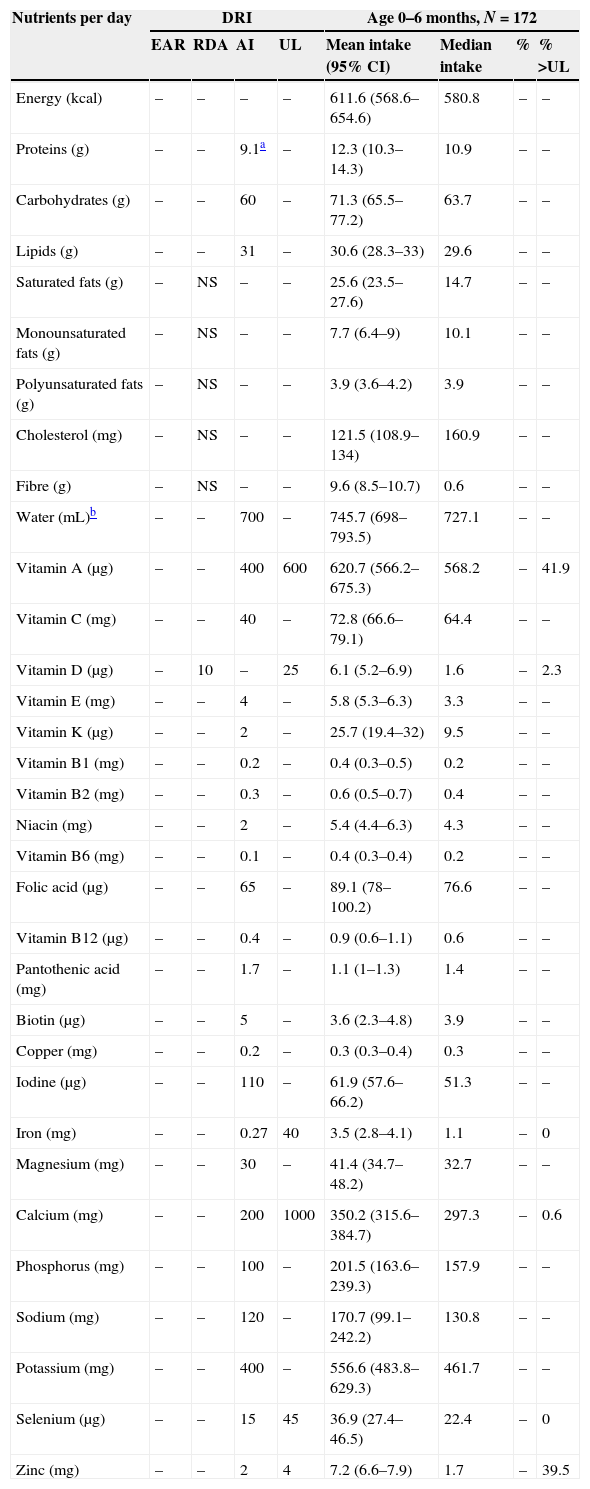
Mean nutrient intakes and proportion of children younger than 6 months with inadequate intakes below the EARs or above the ULs.
| Nutrients per day | DRI | Age 0–6 months, N=172 | ||||||
|---|---|---|---|---|---|---|---|---|
| EAR | RDA | AI | UL | Mean intake (95% CI) | Median intake | % | % >UL | |
| Energy (kcal) | – | – | – | – | 611.6 (568.6–654.6) | 580.8 | – | – |
| Proteins (g) | – | – | 9.1a | – | 12.3 (10.3–14.3) | 10.9 | – | – |
| Carbohydrates (g) | – | – | 60 | – | 71.3 (65.5–77.2) | 63.7 | – | – |
| Lipids (g) | – | – | 31 | – | 30.6 (28.3–33) | 29.6 | – | – |
| Saturated fats (g) | – | NS | – | – | 25.6 (23.5–27.6) | 14.7 | – | – |
| Monounsaturated fats (g) | – | NS | – | – | 7.7 (6.4–9) | 10.1 | – | – |
| Polyunsaturated fats (g) | – | NS | – | – | 3.9 (3.6–4.2) | 3.9 | – | – |
| Cholesterol (mg) | – | NS | – | – | 121.5 (108.9–134) | 160.9 | – | – |
| Fibre (g) | – | NS | – | – | 9.6 (8.5–10.7) | 0.6 | – | – |
| Water (mL)b | – | – | 700 | – | 745.7 (698–793.5) | 727.1 | – | – |
| Vitamin A (μg) | – | – | 400 | 600 | 620.7 (566.2–675.3) | 568.2 | – | 41.9 |
| Vitamin C (mg) | – | – | 40 | – | 72.8 (66.6–79.1) | 64.4 | – | – |
| Vitamin D (μg) | – | 10 | – | 25 | 6.1 (5.2–6.9) | 1.6 | – | 2.3 |
| Vitamin E (mg) | – | – | 4 | – | 5.8 (5.3–6.3) | 3.3 | – | – |
| Vitamin K (μg) | – | – | 2 | – | 25.7 (19.4–32) | 9.5 | – | – |
| Vitamin B1 (mg) | – | – | 0.2 | – | 0.4 (0.3–0.5) | 0.2 | – | – |
| Vitamin B2 (mg) | – | – | 0.3 | – | 0.6 (0.5–0.7) | 0.4 | – | – |
| Niacin (mg) | – | – | 2 | – | 5.4 (4.4–6.3) | 4.3 | – | – |
| Vitamin B6 (mg) | – | – | 0.1 | – | 0.4 (0.3–0.4) | 0.2 | – | – |
| Folic acid (μg) | – | – | 65 | – | 89.1 (78–100.2) | 76.6 | – | – |
| Vitamin B12 (μg) | – | – | 0.4 | – | 0.9 (0.6–1.1) | 0.6 | – | – |
| Pantothenic acid (mg) | – | – | 1.7 | – | 1.1 (1–1.3) | 1.4 | – | – |
| Biotin (μg) | – | – | 5 | – | 3.6 (2.3–4.8) | 3.9 | – | – |
| Copper (mg) | – | – | 0.2 | – | 0.3 (0.3–0.4) | 0.3 | – | – |
| Iodine (μg) | – | – | 110 | – | 61.9 (57.6–66.2) | 51.3 | – | – |
| Iron (mg) | – | – | 0.27 | 40 | 3.5 (2.8–4.1) | 1.1 | – | 0 |
| Magnesium (mg) | – | – | 30 | – | 41.4 (34.7–48.2) | 32.7 | – | – |
| Calcium (mg) | – | – | 200 | 1000 | 350.2 (315.6–384.7) | 297.3 | – | 0.6 |
| Phosphorus (mg) | – | – | 100 | – | 201.5 (163.6–239.3) | 157.9 | – | – |
| Sodium (mg) | – | – | 120 | – | 170.7 (99.1–242.2) | 130.8 | – | – |
| Potassium (mg) | – | – | 400 | – | 556.6 (483.8–629.3) | 461.7 | – | – |
| Selenium (μg) | – | – | 15 | 45 | 36.9 (27.4–46.5) | 22.4 | – | 0 |
| Zinc (mg) | – | – | 2 | 4 | 7.2 (6.6–7.9) | 1.7 | – | 39.5 |
DRI met through diet;11–13 EAR represents the average daily nutrient intake level estimated to meet the requirement of half the healthy individuals in a particular life stage and sex group; NS, there are no current recommendations for this nutrient in this age group; RDA is the reference value for each nutrient sufficient to meet the requirements of 97–98% of healthy individuals in a particular life stage or sex group; AI is the value estimated to meet the requirements of all healthy individuals in each age group based on observations made in apparently healthy individuals for which it is assumed to be adequate. This value is used as a reference in the absence of an established EAR for a given nutrient and age group; UL represents the highest average daily nutrient intake level that is likely to pose no risk of adverse health effects to almost all individuals in the general population. As intake increases above the UL, the potential risk of adverse effects may increase.
AI: Adequate Intake; DRI: Dietary Reference Intakes; EAR: Estimated Average Requirement; 95% CI: 95% confidence interval for the mean; NS: not specified; RDA: Recommended Dietary Allowances; UL: Tolerable Upper Intake Level; %
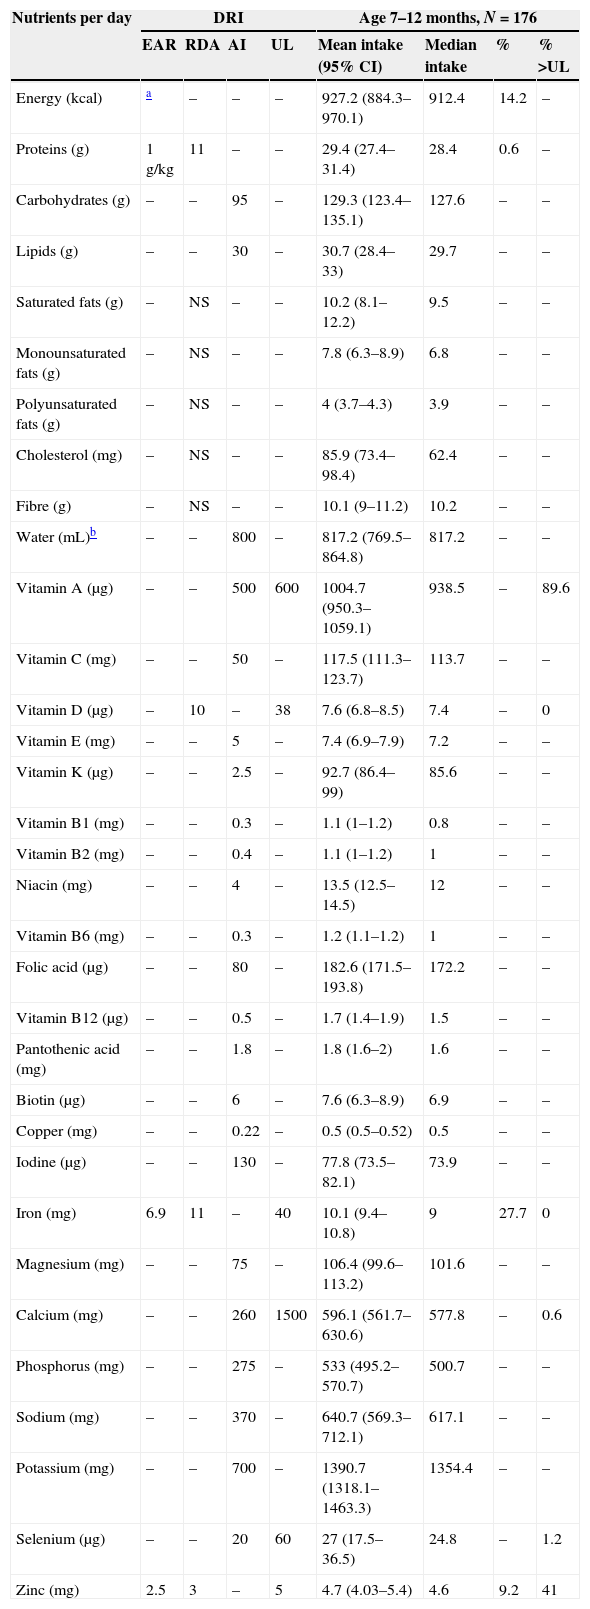
Mean nutrient intakes and proportion of children 7–12 months of age with inadequate intakes below the EARs or above the ULs.
| Nutrients per day | DRI | Age 7–12 months, N=176 | ||||||
|---|---|---|---|---|---|---|---|---|
| EAR | RDA | AI | UL | Mean intake (95% CI) | Median intake | % | % >UL | |
| Energy (kcal) | a | – | – | – | 927.2 (884.3–970.1) | 912.4 | 14.2 | – |
| Proteins (g) | 1g/kg | 11 | – | – | 29.4 (27.4–31.4) | 28.4 | 0.6 | – |
| Carbohydrates (g) | – | – | 95 | – | 129.3 (123.4–135.1) | 127.6 | – | – |
| Lipids (g) | – | – | 30 | – | 30.7 (28.4–33) | 29.7 | – | – |
| Saturated fats (g) | – | NS | – | – | 10.2 (8.1–12.2) | 9.5 | – | – |
| Monounsaturated fats (g) | – | NS | – | – | 7.8 (6.3–8.9) | 6.8 | – | – |
| Polyunsaturated fats (g) | – | NS | – | – | 4 (3.7–4.3) | 3.9 | – | – |
| Cholesterol (mg) | – | NS | – | – | 85.9 (73.4–98.4) | 62.4 | – | – |
| Fibre (g) | – | NS | – | – | 10.1 (9–11.2) | 10.2 | – | – |
| Water (mL)b | – | – | 800 | – | 817.2 (769.5–864.8) | 817.2 | – | – |
| Vitamin A (μg) | – | – | 500 | 600 | 1004.7 (950.3–1059.1) | 938.5 | – | 89.6 |
| Vitamin C (mg) | – | – | 50 | – | 117.5 (111.3–123.7) | 113.7 | – | – |
| Vitamin D (μg) | – | 10 | – | 38 | 7.6 (6.8–8.5) | 7.4 | – | 0 |
| Vitamin E (mg) | – | – | 5 | – | 7.4 (6.9–7.9) | 7.2 | – | – |
| Vitamin K (μg) | – | – | 2.5 | – | 92.7 (86.4–99) | 85.6 | – | – |
| Vitamin B1 (mg) | – | – | 0.3 | – | 1.1 (1–1.2) | 0.8 | – | – |
| Vitamin B2 (mg) | – | – | 0.4 | – | 1.1 (1–1.2) | 1 | – | – |
| Niacin (mg) | – | – | 4 | – | 13.5 (12.5–14.5) | 12 | – | – |
| Vitamin B6 (mg) | – | – | 0.3 | – | 1.2 (1.1–1.2) | 1 | – | – |
| Folic acid (μg) | – | – | 80 | – | 182.6 (171.5–193.8) | 172.2 | – | – |
| Vitamin B12 (μg) | – | – | 0.5 | – | 1.7 (1.4–1.9) | 1.5 | – | – |
| Pantothenic acid (mg) | – | – | 1.8 | – | 1.8 (1.6–2) | 1.6 | – | – |
| Biotin (μg) | – | – | 6 | – | 7.6 (6.3–8.9) | 6.9 | – | – |
| Copper (mg) | – | – | 0.22 | – | 0.5 (0.5–0.52) | 0.5 | – | – |
| Iodine (μg) | – | – | 130 | – | 77.8 (73.5–82.1) | 73.9 | – | – |
| Iron (mg) | 6.9 | 11 | – | 40 | 10.1 (9.4–10.8) | 9 | 27.7 | 0 |
| Magnesium (mg) | – | – | 75 | – | 106.4 (99.6–113.2) | 101.6 | – | – |
| Calcium (mg) | – | – | 260 | 1500 | 596.1 (561.7–630.6) | 577.8 | – | 0.6 |
| Phosphorus (mg) | – | – | 275 | – | 533 (495.2–570.7) | 500.7 | – | – |
| Sodium (mg) | – | – | 370 | – | 640.7 (569.3–712.1) | 617.1 | – | – |
| Potassium (mg) | – | – | 700 | – | 1390.7 (1318.1–1463.3) | 1354.4 | – | – |
| Selenium (μg) | – | – | 20 | 60 | 27 (17.5–36.5) | 24.8 | – | 1.2 |
| Zinc (mg) | 2.5 | 3 | – | 5 | 4.7 (4.03–5.4) | 4.6 | 9.2 | 41 |
DRI met through diet;11–13 EAR represents the average daily nutrient intake level estimated to meet the requirement of half the healthy individuals in a particular life stage and sex group; NS, there are no current recommendations for this nutrient in this age group; RDA is the reference value for each nutrient sufficient to meet the requirements of 97–98% of healthy individuals in a particular life stage or sex group; AI is the value estimated to meet the requirements of all healthy individuals in each age group based on observations made in apparently healthy individuals and that is supposed to be adequate. This value is used as a reference in the absence of an established EAR for a given nutrient and age group; UL represents the highest average daily nutrient intake level that is likely to pose no risk of adverse health effects to almost all individuals in the general population. As intake increases above the UL, the potential risk of adverse effects may increase.
AI: Adequate Intake; DRI: Dietary Reference Intakes; EAR: Estimated Average Requirement; 95% CI: 95% confidence interval for the mean; NS: not specified; RDA: Recommended Dietary Allowances; UL: Tolerable Upper Intake Level; %
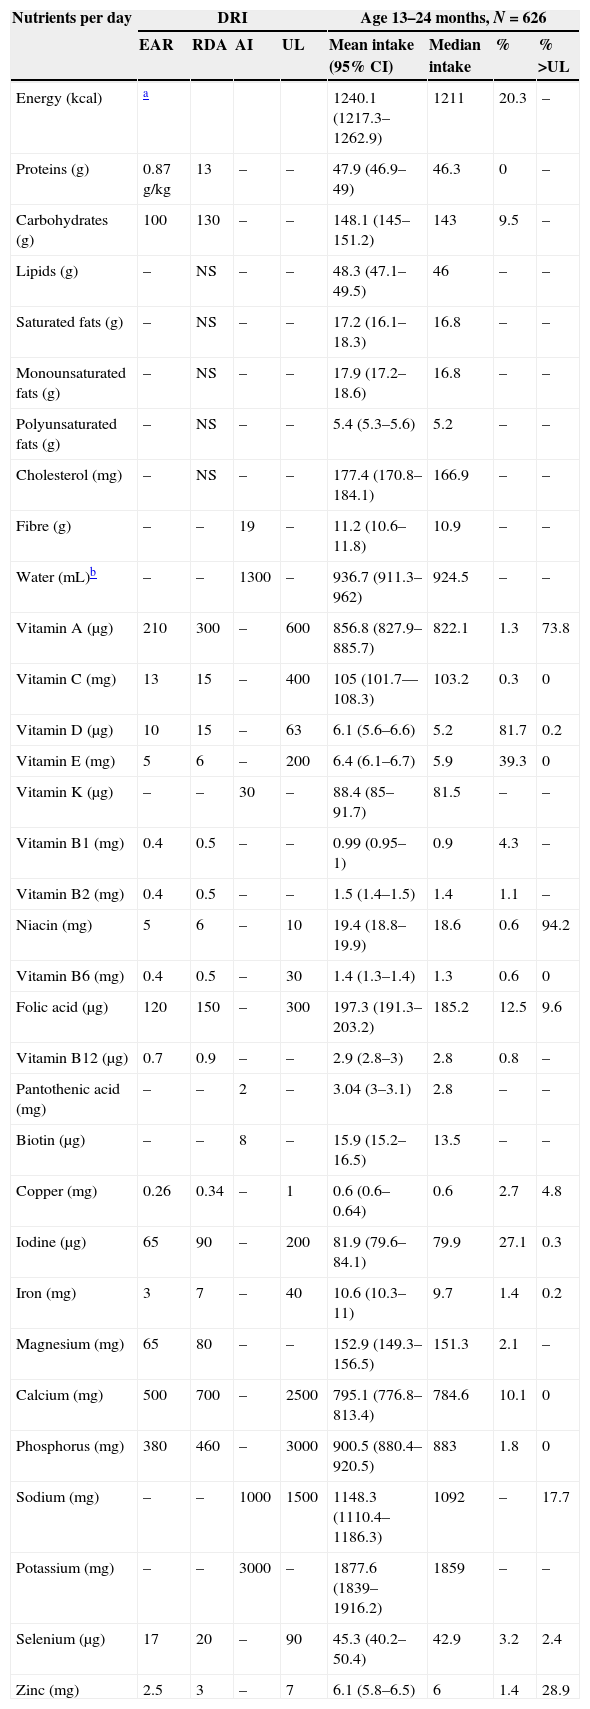
Mean nutrient intakes and proportion of children 13–24 months of age with inadequate intakes below the EARs or above the ULs.
| Nutrients per day | DRI | Age 13–24 months, N=626 | ||||||
|---|---|---|---|---|---|---|---|---|
| EAR | RDA | AI | UL | Mean intake (95% CI) | Median intake | % | % >UL | |
| Energy (kcal) | a | 1240.1 (1217.3–1262.9) | 1211 | 20.3 | – | |||
| Proteins (g) | 0.87g/kg | 13 | – | – | 47.9 (46.9–49) | 46.3 | 0 | – |
| Carbohydrates (g) | 100 | 130 | – | – | 148.1 (145–151.2) | 143 | 9.5 | – |
| Lipids (g) | – | NS | – | – | 48.3 (47.1–49.5) | 46 | – | – |
| Saturated fats (g) | – | NS | – | – | 17.2 (16.1–18.3) | 16.8 | – | – |
| Monounsaturated fats (g) | – | NS | – | – | 17.9 (17.2–18.6) | 16.8 | – | – |
| Polyunsaturated fats (g) | – | NS | – | – | 5.4 (5.3–5.6) | 5.2 | – | – |
| Cholesterol (mg) | – | NS | – | – | 177.4 (170.8–184.1) | 166.9 | – | – |
| Fibre (g) | – | – | 19 | – | 11.2 (10.6–11.8) | 10.9 | – | – |
| Water (mL)b | – | – | 1300 | – | 936.7 (911.3–962) | 924.5 | – | – |
| Vitamin A (μg) | 210 | 300 | – | 600 | 856.8 (827.9–885.7) | 822.1 | 1.3 | 73.8 |
| Vitamin C (mg) | 13 | 15 | – | 400 | 105 (101.7––108.3) | 103.2 | 0.3 | 0 |
| Vitamin D (μg) | 10 | 15 | – | 63 | 6.1 (5.6–6.6) | 5.2 | 81.7 | 0.2 |
| Vitamin E (mg) | 5 | 6 | – | 200 | 6.4 (6.1–6.7) | 5.9 | 39.3 | 0 |
| Vitamin K (μg) | – | – | 30 | – | 88.4 (85–91.7) | 81.5 | – | – |
| Vitamin B1 (mg) | 0.4 | 0.5 | – | – | 0.99 (0.95–1) | 0.9 | 4.3 | – |
| Vitamin B2 (mg) | 0.4 | 0.5 | – | – | 1.5 (1.4–1.5) | 1.4 | 1.1 | – |
| Niacin (mg) | 5 | 6 | – | 10 | 19.4 (18.8–19.9) | 18.6 | 0.6 | 94.2 |
| Vitamin B6 (mg) | 0.4 | 0.5 | – | 30 | 1.4 (1.3–1.4) | 1.3 | 0.6 | 0 |
| Folic acid (μg) | 120 | 150 | – | 300 | 197.3 (191.3–203.2) | 185.2 | 12.5 | 9.6 |
| Vitamin B12 (μg) | 0.7 | 0.9 | – | – | 2.9 (2.8–3) | 2.8 | 0.8 | – |
| Pantothenic acid (mg) | – | – | 2 | – | 3.04 (3–3.1) | 2.8 | – | – |
| Biotin (μg) | – | – | 8 | – | 15.9 (15.2–16.5) | 13.5 | – | – |
| Copper (mg) | 0.26 | 0.34 | – | 1 | 0.6 (0.6–0.64) | 0.6 | 2.7 | 4.8 |
| Iodine (μg) | 65 | 90 | – | 200 | 81.9 (79.6–84.1) | 79.9 | 27.1 | 0.3 |
| Iron (mg) | 3 | 7 | – | 40 | 10.6 (10.3–11) | 9.7 | 1.4 | 0.2 |
| Magnesium (mg) | 65 | 80 | – | – | 152.9 (149.3–156.5) | 151.3 | 2.1 | – |
| Calcium (mg) | 500 | 700 | – | 2500 | 795.1 (776.8–813.4) | 784.6 | 10.1 | 0 |
| Phosphorus (mg) | 380 | 460 | – | 3000 | 900.5 (880.4–920.5) | 883 | 1.8 | 0 |
| Sodium (mg) | – | – | 1000 | 1500 | 1148.3 (1110.4–1186.3) | 1092 | – | 17.7 |
| Potassium (mg) | – | – | 3000 | – | 1877.6 (1839–1916.2) | 1859 | – | – |
| Selenium (μg) | 17 | 20 | – | 90 | 45.3 (40.2–50.4) | 42.9 | 3.2 | 2.4 |
| Zinc (mg) | 2.5 | 3 | – | 7 | 6.1 (5.8–6.5) | 6 | 1.4 | 28.9 |
DRI met through diet;11–13 EAR represents the average daily nutrient intake level estimated to meet the requirement of half the healthy individuals in a particular life stage and sex group; NS, there are no current recommendations for this nutrient in this age group; RDA is the reference value for each nutrient sufficient to meet the requirements of 97–98% of healthy individuals in a particular life stage or sex group; AI is the value estimated to meet the requirements of all healthy individuals in each age group based on observations made in apparently healthy individuals and that is supposed to be adequate. This value is used as a reference in the absence of an established EAR for a given nutrient and age group; UL represents the highest average daily nutrient intake level that is likely to pose no risk of adverse health effects to almost all individuals in the general population. As intake increases above the UL, the potential risk of adverse effects may increase.
AI: Adequate Intake; DRI: Dietary Reference Intakes; EAR: Estimated Average Requirement; 95% CI: 95% confidence interval for the mean; NS: not specified; RDA: Recommended Dietary Allowances; UL: Tolerable Upper Intake Level; %
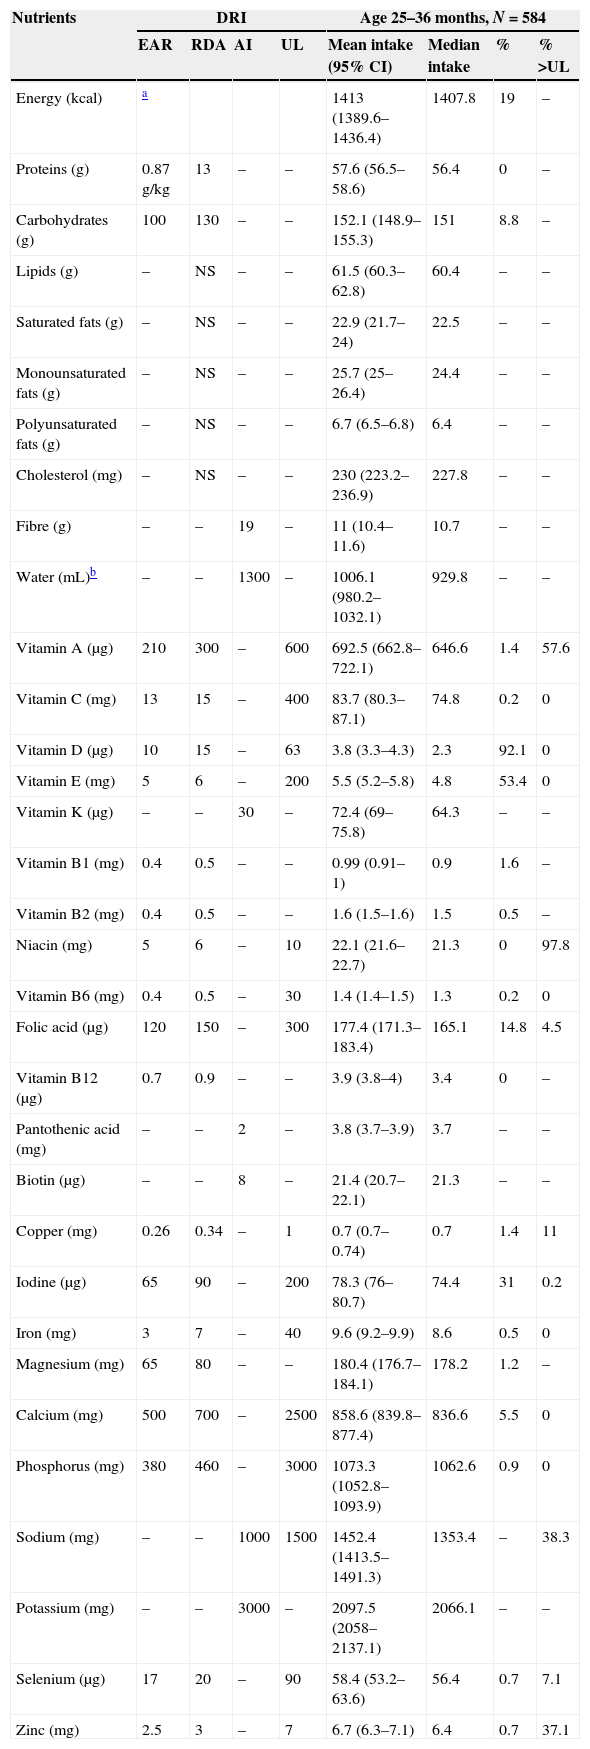
Mean nutrient intakes and proportion of children 25–36 months of age with inadequate intakes below the EARs or above the ULs.
| Nutrients | DRI | Age 25–36 months, N=584 | ||||||
|---|---|---|---|---|---|---|---|---|
| EAR | RDA | AI | UL | Mean intake (95% CI) | Median intake | % | % >UL | |
| Energy (kcal) | a | 1413 (1389.6–1436.4) | 1407.8 | 19 | – | |||
| Proteins (g) | 0.87g/kg | 13 | – | – | 57.6 (56.5–58.6) | 56.4 | 0 | – |
| Carbohydrates (g) | 100 | 130 | – | – | 152.1 (148.9–155.3) | 151 | 8.8 | – |
| Lipids (g) | – | NS | – | – | 61.5 (60.3–62.8) | 60.4 | – | – |
| Saturated fats (g) | – | NS | – | – | 22.9 (21.7–24) | 22.5 | – | – |
| Monounsaturated fats (g) | – | NS | – | – | 25.7 (25–26.4) | 24.4 | – | – |
| Polyunsaturated fats (g) | – | NS | – | – | 6.7 (6.5–6.8) | 6.4 | – | – |
| Cholesterol (mg) | – | NS | – | – | 230 (223.2–236.9) | 227.8 | – | – |
| Fibre (g) | – | – | 19 | – | 11 (10.4–11.6) | 10.7 | – | – |
| Water (mL)b | – | – | 1300 | – | 1006.1 (980.2–1032.1) | 929.8 | – | – |
| Vitamin A (μg) | 210 | 300 | – | 600 | 692.5 (662.8–722.1) | 646.6 | 1.4 | 57.6 |
| Vitamin C (mg) | 13 | 15 | – | 400 | 83.7 (80.3–87.1) | 74.8 | 0.2 | 0 |
| Vitamin D (μg) | 10 | 15 | – | 63 | 3.8 (3.3–4.3) | 2.3 | 92.1 | 0 |
| Vitamin E (mg) | 5 | 6 | – | 200 | 5.5 (5.2–5.8) | 4.8 | 53.4 | 0 |
| Vitamin K (μg) | – | – | 30 | – | 72.4 (69–75.8) | 64.3 | – | – |
| Vitamin B1 (mg) | 0.4 | 0.5 | – | – | 0.99 (0.91–1) | 0.9 | 1.6 | – |
| Vitamin B2 (mg) | 0.4 | 0.5 | – | – | 1.6 (1.5–1.6) | 1.5 | 0.5 | – |
| Niacin (mg) | 5 | 6 | – | 10 | 22.1 (21.6–22.7) | 21.3 | 0 | 97.8 |
| Vitamin B6 (mg) | 0.4 | 0.5 | – | 30 | 1.4 (1.4–1.5) | 1.3 | 0.2 | 0 |
| Folic acid (μg) | 120 | 150 | – | 300 | 177.4 (171.3–183.4) | 165.1 | 14.8 | 4.5 |
| Vitamin B12 (μg) | 0.7 | 0.9 | – | – | 3.9 (3.8–4) | 3.4 | 0 | – |
| Pantothenic acid (mg) | – | – | 2 | – | 3.8 (3.7–3.9) | 3.7 | – | – |
| Biotin (μg) | – | – | 8 | – | 21.4 (20.7–22.1) | 21.3 | – | – |
| Copper (mg) | 0.26 | 0.34 | – | 1 | 0.7 (0.7–0.74) | 0.7 | 1.4 | 11 |
| Iodine (μg) | 65 | 90 | – | 200 | 78.3 (76–80.7) | 74.4 | 31 | 0.2 |
| Iron (mg) | 3 | 7 | – | 40 | 9.6 (9.2–9.9) | 8.6 | 0.5 | 0 |
| Magnesium (mg) | 65 | 80 | – | – | 180.4 (176.7–184.1) | 178.2 | 1.2 | – |
| Calcium (mg) | 500 | 700 | – | 2500 | 858.6 (839.8–877.4) | 836.6 | 5.5 | 0 |
| Phosphorus (mg) | 380 | 460 | – | 3000 | 1073.3 (1052.8–1093.9) | 1062.6 | 0.9 | 0 |
| Sodium (mg) | – | – | 1000 | 1500 | 1452.4 (1413.5–1491.3) | 1353.4 | – | 38.3 |
| Potassium (mg) | – | – | 3000 | – | 2097.5 (2058–2137.1) | 2066.1 | – | – |
| Selenium (μg) | 17 | 20 | – | 90 | 58.4 (53.2–63.6) | 56.4 | 0.7 | 7.1 |
| Zinc (mg) | 2.5 | 3 | – | 7 | 6.7 (6.3–7.1) | 6.4 | 0.7 | 37.1 |
DRI met through diet;11–13 EAR represents the average daily nutrient intake level estimated to meet the requirement of half the healthy individuals in a particular life stage and sex group; NS, there are no current recommendations for this nutrient in this age group; RDA is the reference value for each nutrient sufficient to meet the requirements of 97–98% of healthy individuals in a particular life stage or sex group; AI is the value estimated to meet the requirements of all healthy individuals in each age group based on observations made in apparently healthy individuals and that is supposed to be adequate. This value is used as a reference in the absence of an established EAR for a given nutrient and age group; UL represents the highest average daily nutrient intake level that is likely to pose no risk of adverse health effects to almost all individuals in the general population. As intake increases above the UL, the potential risk of adverse effects may increase.
AI: Adequate Intake; DRI: Dietary Reference Intakes; EAR: Estimated Average Requirement; 95% CI: 95% confidence interval for the mean; NS: not specified; RDA: Recommended Dietary Allowances; UL: Tolerable Upper Intake Level; %
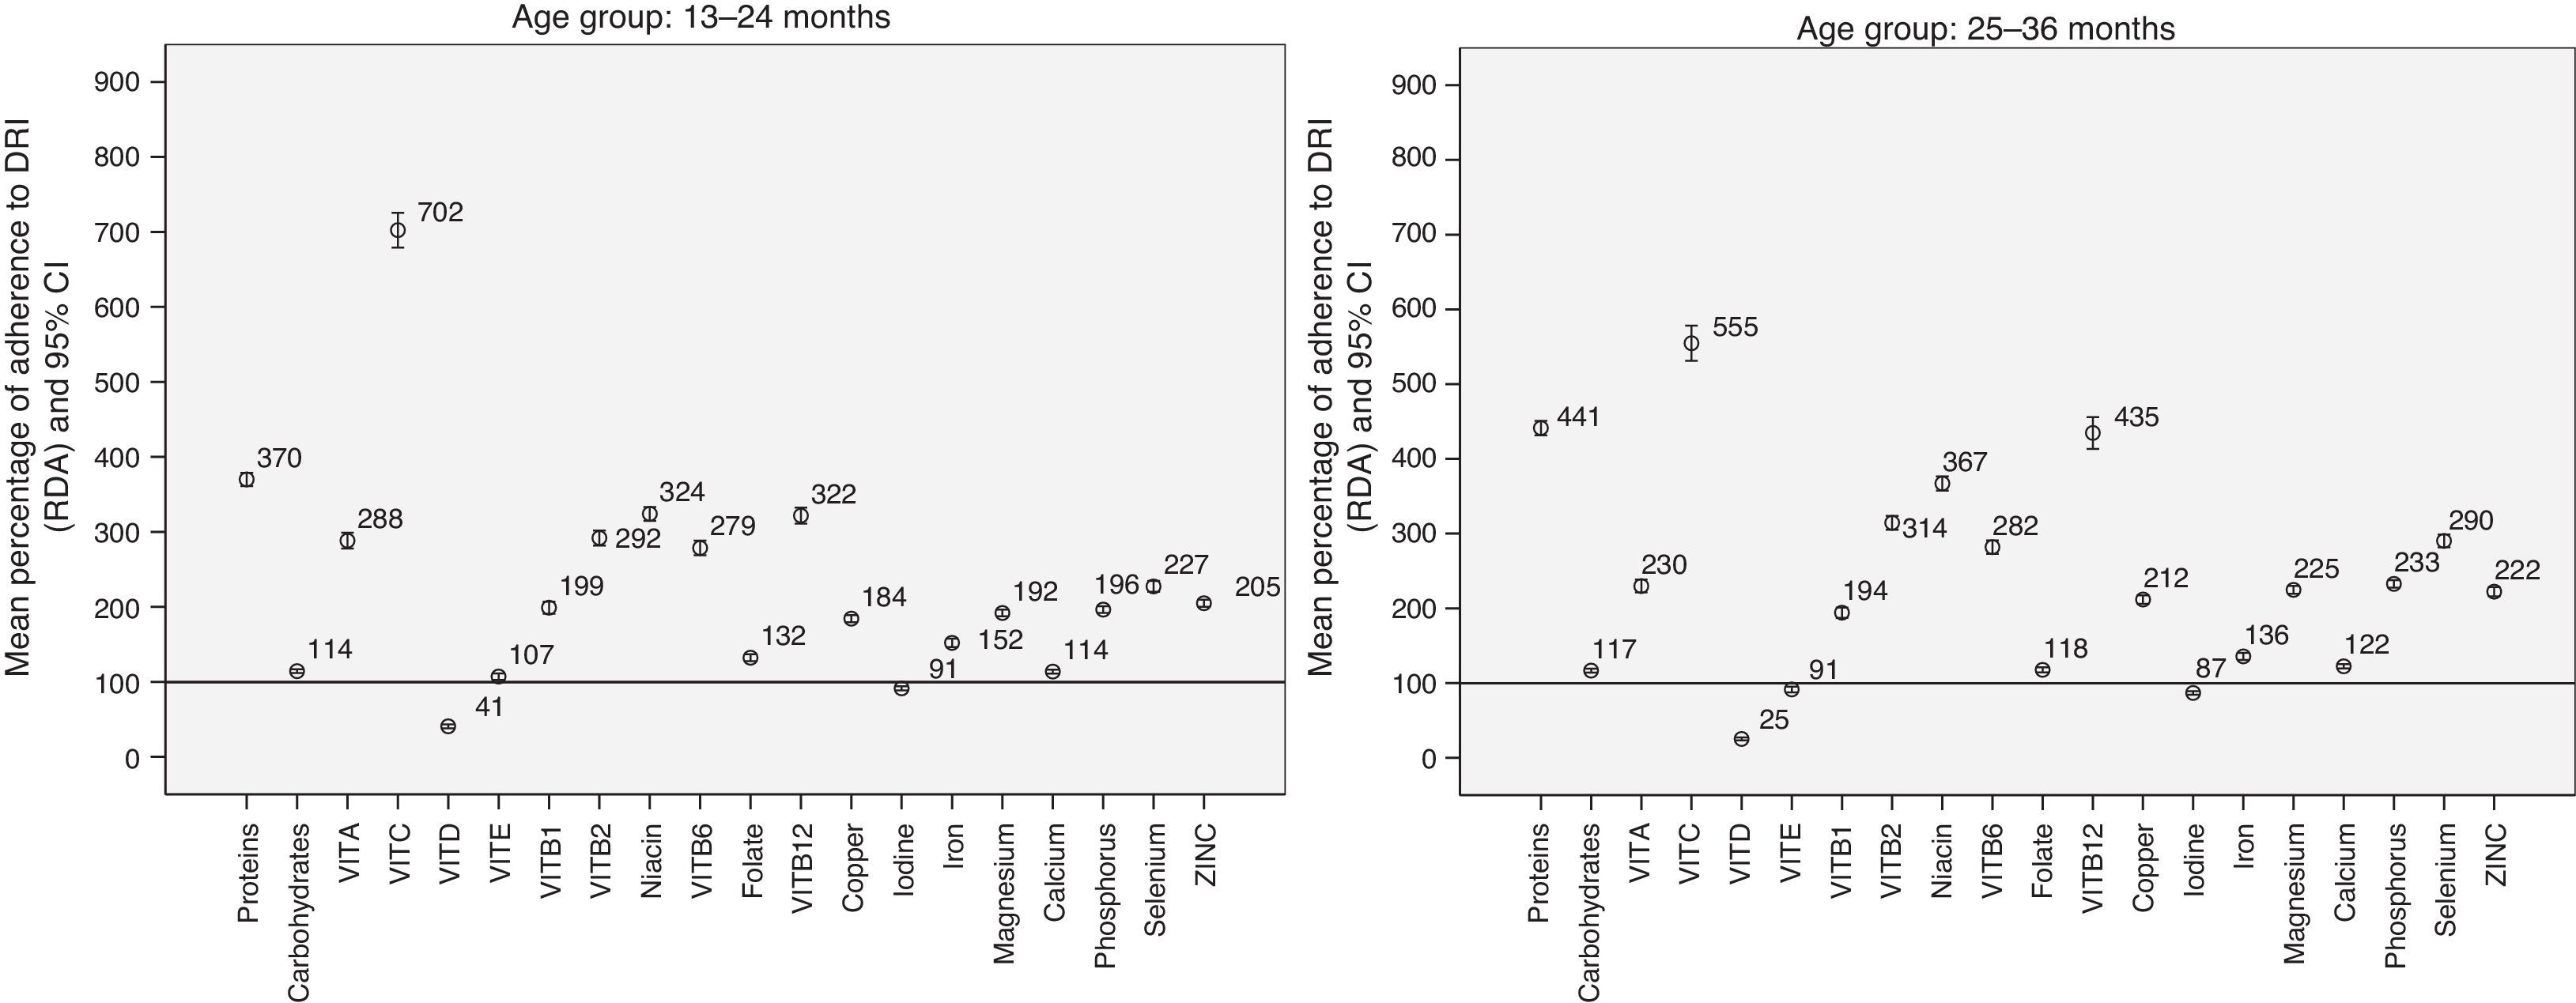
Fig. 1 shows the results of the analysis of the mean percentage and the 95% CI for the adherence to RDAs from 13 months of age. At 7–12 months, the mean percentage of adherence to RDAs was 267% (95% CI, 254–279) for protein, 91% (95% CI, 84–98) for iron, and 157% (95% CI, 149–166) for zinc.
 in the daily nutrient intake. An adequate adherence to DRIs (RDA/AI) corresponds to a 100% adherence (horizontal line at 100%). Values below 100% represent energy or nutrient intakes below the recommended values. Values above 100% represent energy or nutrient intakes above the recommended values.")
Mean percentage of adherence to DRIs (RDAs) in the daily nutrient intake. An adequate adherence to DRIs (RDA/AI) corresponds to a 100% adherence (horizontal line at 100%). Values below 100% represent energy or nutrient intakes below the recommended values. Values above 100% represent energy or nutrient intakes above the recommended values.
The proportion of adherence for energy intake was 135% (95% CI, 130–140) in the 7–12 month group, 123% (95% CI, 121–125) in the 13–24 month group, and 124% (95% CI, 122–126) in the 25–36 month group. Adherence was 125% (95% CI, 123–127) in children 7–36 months of age.
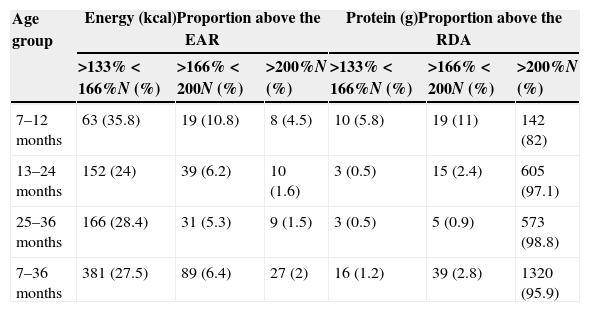
Proportion of children with energy and protein intakes above the Recommended Dietary AllowancesTable 5 shows the proportion of children with energy (EAR) and protein (RDA) intakes 1/3 (133–166%), 2/3 (166–200%) and twice (>200%) above the DRI.
Energy and protein intake: proportion of children with values above 133%, 166% and 200% of the EARs and RDAs.
| Age group | Energy (kcal)Proportion above the EAR | Protein (g)Proportion above the RDA | ||||
|---|---|---|---|---|---|---|
| >133%<166%N (%) | >166%<200N (%) | >200%N (%) | >133%<166%N (%) | >166%<200N (%) | >200%N (%) | |
| 7–12 months | 63 (35.8) | 19 (10.8) | 8 (4.5) | 10 (5.8) | 19 (11) | 142 (82) |
| 13–24 months | 152 (24) | 39 (6.2) | 10 (1.6) | 3 (0.5) | 15 (2.4) | 605 (97.1) |
| 25–36 months | 166 (28.4) | 31 (5.3) | 9 (1.5) | 3 (0.5) | 5 (0.9) | 573 (98.8) |
| 7–36 months | 381 (27.5) | 89 (6.4) | 27 (2) | 16 (1.2) | 39 (2.8) | 1320 (95.9) |
EAR: minimum reference value that meets the requirements of 50% of the population for each age group.
RDA: reference value that meets the requirements of 97–98% of healthy individuals for each age group.
EAR: Estimated Average Requirement; RDA: Recommended Dietary Allowances.
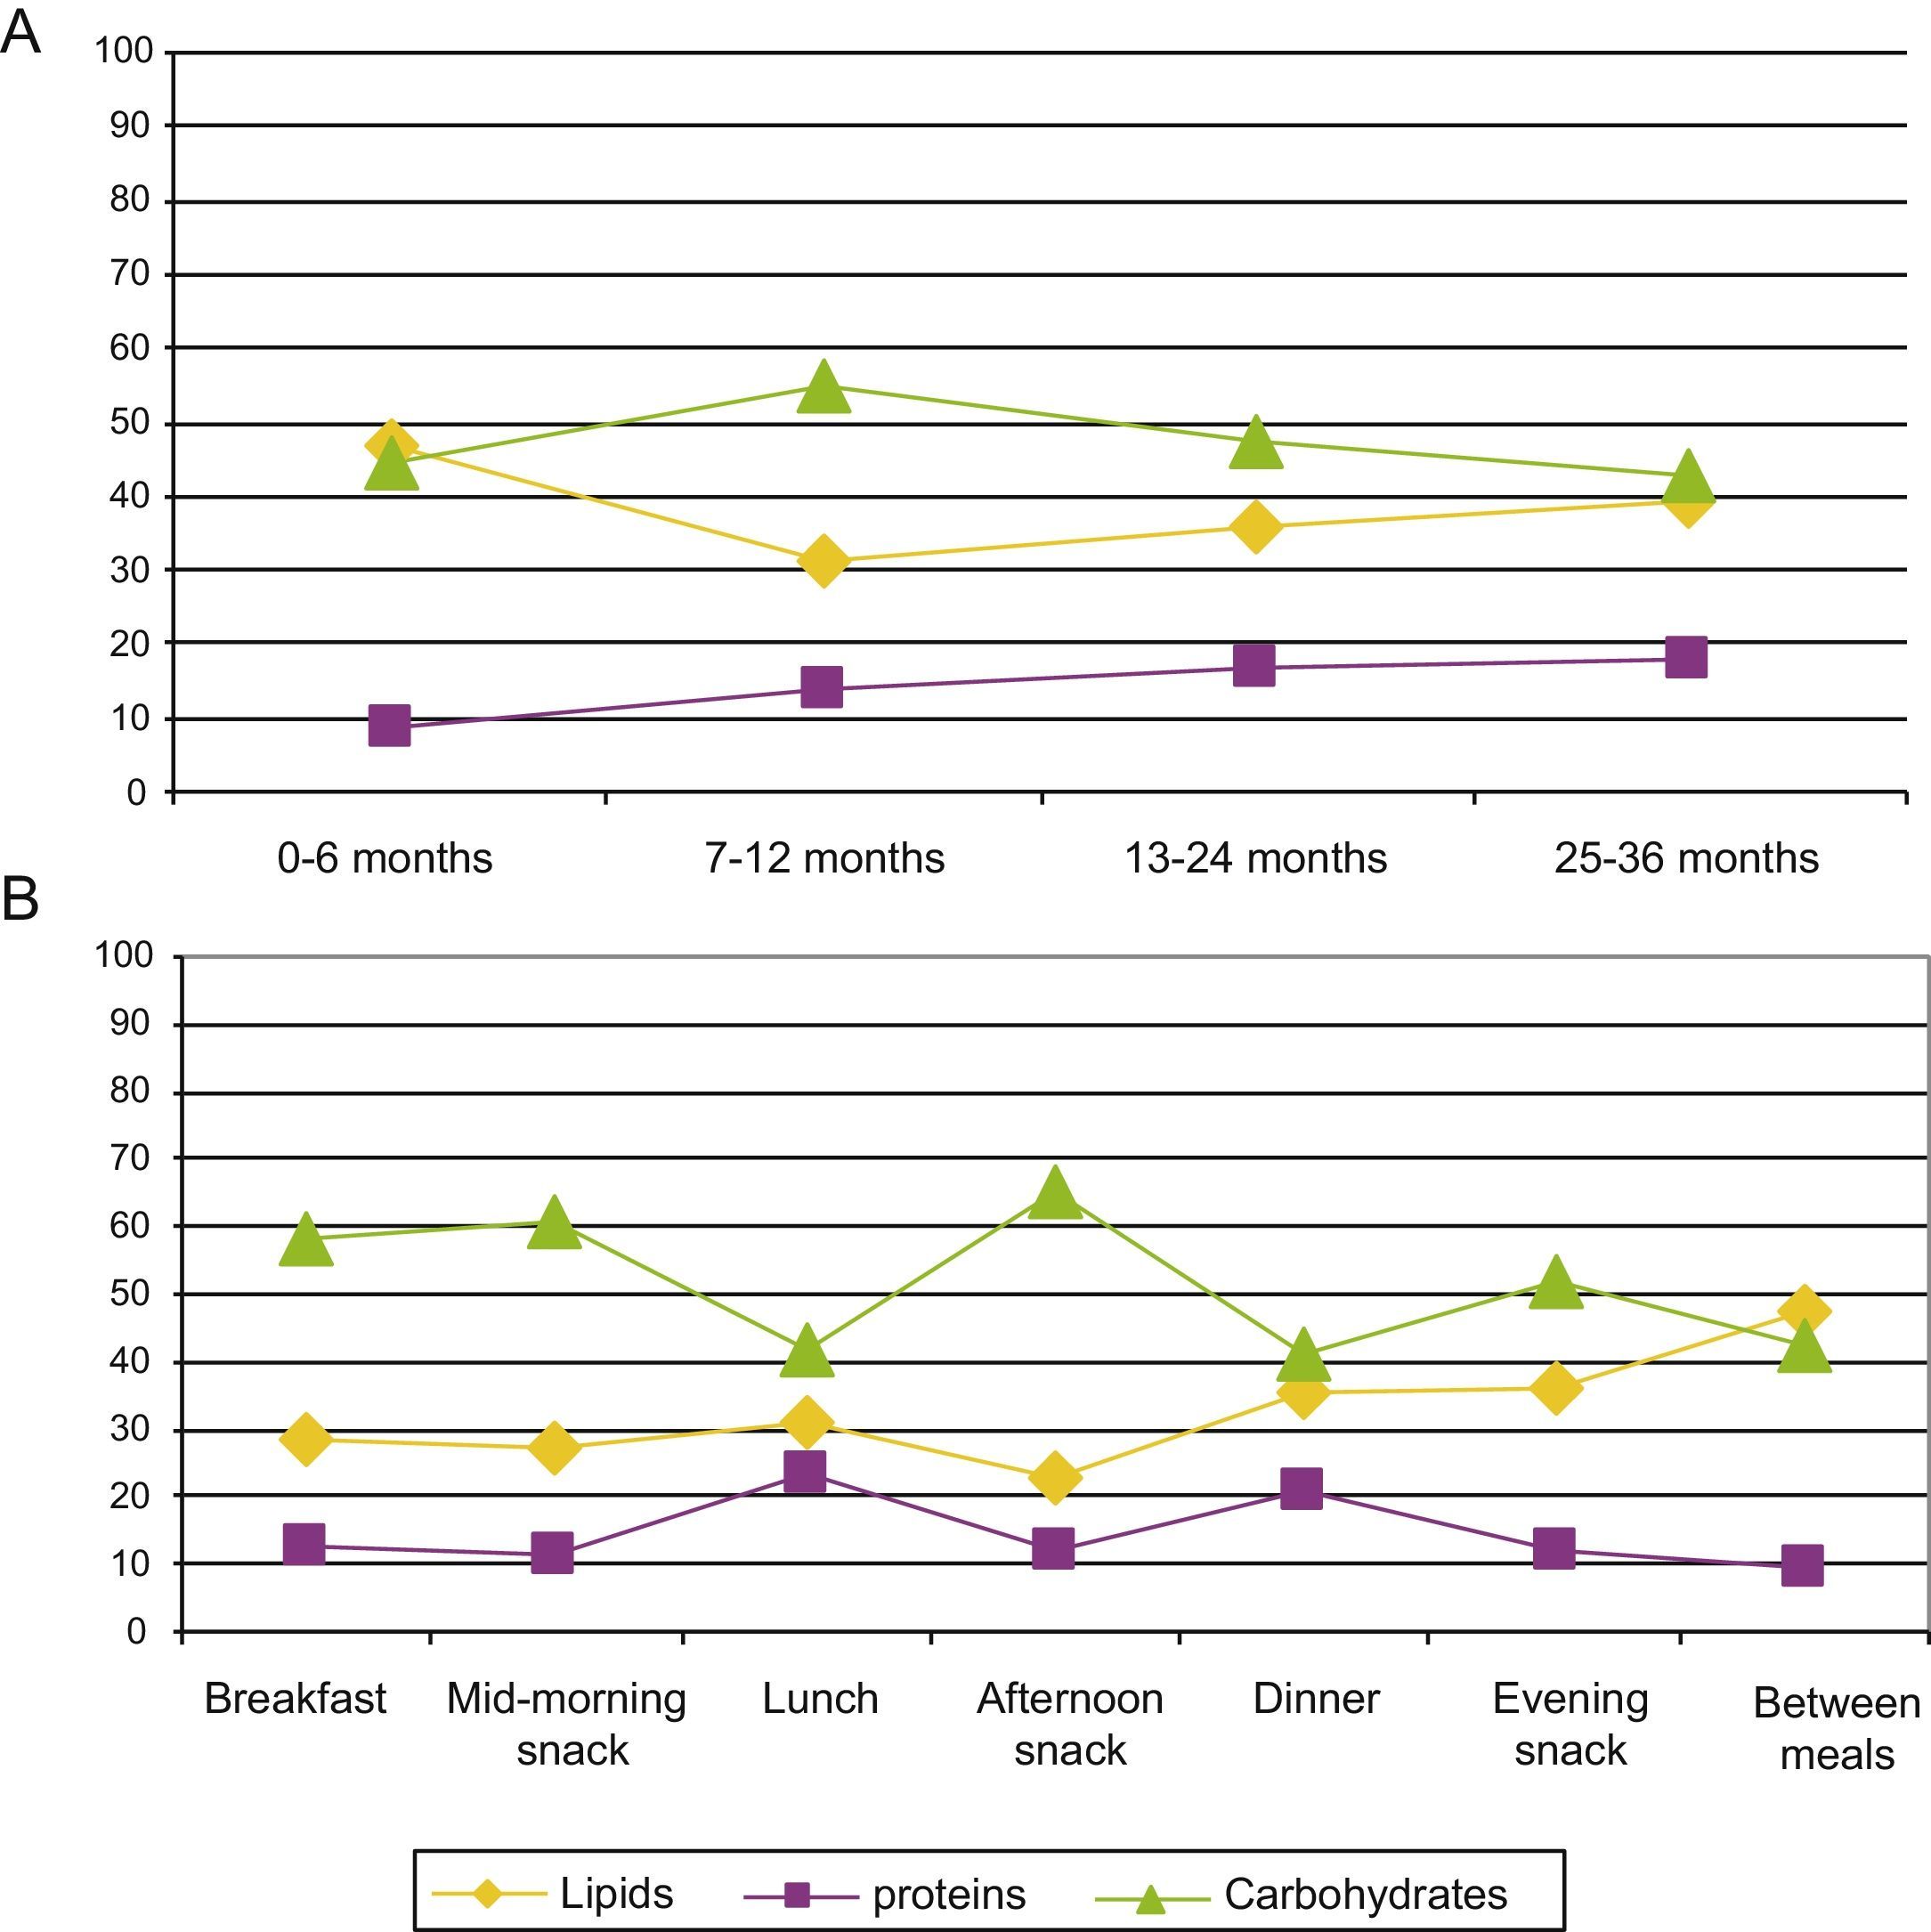
Fig. 2 shows the proportion of energy contributed by each macronutrient per 100kcal consumed by age and time of day. We observed a significant increase in the proportion of energy contributed by proteins as age increased (P<.05), as well as a significant reduction in the lipid contribution to the energy intake (P<.05). We did not observe any differences in the carbohydrate contribution to the total energy intake between the age groups.
Relationship between body mass index and nutrient intake and time of day (B), per 100kcal of energy intake.")
We performed a multiple linear regression analysis to study the variables with a potential association to current BMI. The data of 1495 children were valid and could be used in the analysis (r2=0.069). We found that BMI decreased as the child's age increased, an association that was statistically significant (0.024kg/m2 per month of age; 95% CI, 0.011–0.037; P<.0001). The BMI was lower in girls than in boys (0.293kg/m2; 95% CI, 0.112–0.475; P=.002). The children that had higher BMIs at birth also had higher current BMIs (0.222kg/m2: 95% CI, 0.159–0.284; P<.0001). Higher levels of physical activity correlated to lower BMIs (0.148kg/m2; 95% CI, 0.002–0.295; P=.048). Higher current energy intakes were associated with higher current BMIs, as each additional 100kcal in energy intake was associated with a 0.5kg/m2 increase in IMC (95% CI, 0–1; P=.032). Higher dietary lipid intakes were significantly associated with lower BMIs (0.054kg/m2; 95% CI, 0.012–0.97; P=.013).
We observed that higher contributions of protein to the total energy intake were associated to higher BMIs (0.029kg/m2; 95% CI, 0.006–0.051; P=.013). Higher contributions of carbohydrates were associated with higher BMIs (0.021kg/m2; 95% CI, 0.009–0.033; P<.0001). Higher contributions of lipids corresponded to lower BMIs (0.028kg/m2; 95% CI, 0.016–0.039; P<.0001).
Our analysis of the relationship between BMI and the mean daily micronutrient intake (r2=0.095) showed that higher intakes of vitamin D correlated to lower BMIs (4.4μg, 95% CI, 1.9–10.2, P=.001).
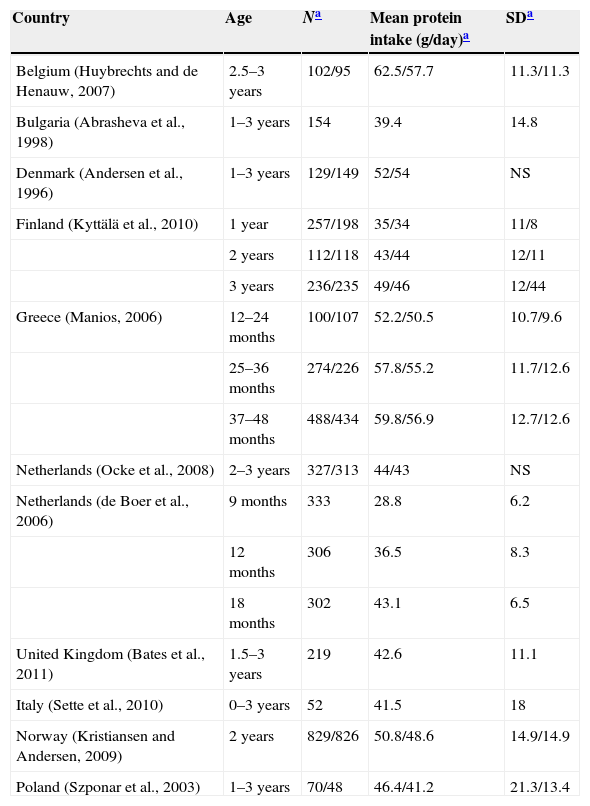
DiscussionThe high protein intake in children's diets was the most remarkable finding of our study. Similar results have been found in other European countries (Table 6) for the same age groups.20 Data from the United States are also similar.21
Protein intake in children 1–3 years of age in European countries.
| Country | Age | Na | Mean protein intake (g/day)a | SDa |
|---|---|---|---|---|
| Belgium (Huybrechts and de Henauw, 2007) | 2.5–3 years | 102/95 | 62.5/57.7 | 11.3/11.3 |
| Bulgaria (Abrasheva et al., 1998) | 1–3 years | 154 | 39.4 | 14.8 |
| Denmark (Andersen et al., 1996) | 1–3 years | 129/149 | 52/54 | NS |
| Finland (Kyttälä et al., 2010) | 1 year | 257/198 | 35/34 | 11/8 |
| 2 years | 112/118 | 43/44 | 12/11 | |
| 3 years | 236/235 | 49/46 | 12/44 | |
| Greece (Manios, 2006) | 12–24 months | 100/107 | 52.2/50.5 | 10.7/9.6 |
| 25–36 months | 274/226 | 57.8/55.2 | 11.7/12.6 | |
| 37–48 months | 488/434 | 59.8/56.9 | 12.7/12.6 | |
| Netherlands (Ocke et al., 2008) | 2–3 years | 327/313 | 44/43 | NS |
| Netherlands (de Boer et al., 2006) | 9 months | 333 | 28.8 | 6.2 |
| 12 months | 306 | 36.5 | 8.3 | |
| 18 months | 302 | 43.1 | 6.5 | |
| United Kingdom (Bates et al., 2011) | 1.5–3 years | 219 | 42.6 | 11.1 |
| Italy (Sette et al., 2010) | 0–3 years | 52 | 41.5 | 18 |
| Norway (Kristiansen and Andersen, 2009) | 2 years | 829/826 | 50.8/48.6 | 14.9/14.9 |
| Poland (Szponar et al., 2003) | 1–3 years | 70/48 | 46.4/41.2 | 21.3/13.4 |
SD: standard deviation; NS: not specified.
Data for both sexes or for boys/girls.
Taken from the EFSA Panel on Dietetic Products, Nutrition and Allergies (NSA).20
The percentage of children that consumed more than twice the recommended daily amount of protein was 95.9% (Table 5). Although current evidence is insufficient to establish upper limits (ULs) for protein intake, the EFSA estimates than intakes up to twice the recommended value are safe in adults.20 Protein contributions above 20% of the energy intake can seriously impair the water balance in children, so high protein intakes must be avoided, especially in the first year of life.20 Our study showed that the mean protein intake was 370% of the recommended intake in children 13–24 months of age, and 441% of the recommended intake in children 25–36 months of age (Fig. 1), that is, intakes up to 4 times the recommended values. This increasing trend in protein intake has also been observed in children between 1 and 3 years of age in other European countries, with energy intakes of 131% of the RDA/adequate intake (AI) in Italy,22 138% in France,23 and 284% in the United Kingdom.24 Yet the contribution of protein did not go over 20% of the energy intake in any age group (Fig. 2A), demonstrating an adequate energy distribution overall, albeit with a tendency to consume more protein as age increases, especially during lunch and supper (Fig. 2B). The high absolute values of the protein intake could be due to an excessive energy intake, as they exceeded recommended values by 135% at 7–12 months, by 123% at 13–24 months and by 124% at 25–36 months. Furthermore, 27.5% of children had energy intakes 1/3 greater than the recommended values (Table 5). We must take into account that the intake recommendations for protein and other nutrients are based on the determination of minimum values below which intakes would be insufficient and could lead to nutritional deficiencies. More specifically, the calculation of the recommended protein intake is based on an adequate nitrogen balance.20 An association between high protein intakes and greater weights in children younger than 2 years has been reported,25 which increases the risk of future obesity.26–30 It is believed that protein consumption stimulates the secretion of insulin-like growth factor i, which leads to cellular proliferation, accelerated growth and increased body fat.30,31 In this regard, our study showed that higher contributions of protein and carbohydrates to the total energy intake were associated with a significantly higher BMI. We observed a rate of overweight and obesity (>2 SD) of 6.1%. The most recent data on 8-year-old children in Spain (ALADINO study) showed an 11.6% prevalence of obesity.32 This means that the prevalence of obesity doubles between 3 and 8 years of age. This is a crucial period for intervention and to counsel children and parents on what constitutes a balanced diet, as it is the time when children develop their dietary habits.
We observed the most important deficiencies in the vitamin D intake in 81.7% and 92.1% of the children (Tables 3 and 4). The use of vitamin supplements was lower from 12 months of age, so these were actual deficiencies. This finding may be important when it comes to future health in light of the association between vitamin D and risk factors for cardiovascular and metabolic disease.33,34 Our study also showed an inverse correlation between vitamin D intake and BMI. This finding is consistent with the results of different studies on increased body fat and its association with vitamin D.35–38
We observed that 27.1% of children 13–24 months of age and 31% of children 25–36 months of age had iodine intakes below the EAR. Iodine deficiency is considered to be the most frequent and preventable cause of intellectual disability. Although Spain is among the countries with adequate iodine intakes, the percentage of children with an insufficient intake found in our study was surprising.39 It is possible that the consumption of iodised salt was underreported in the diet diaries, as considering that 17.7% and 38.3% of children had a sodium intake in excess of the ULs (Tables 3 and 4), it is likely that some of the salt consumed was iodised.
To conclude, similar to what occurs in other European countries and the United States, children younger than 3 years in Spain consume an imbalanced diet with an excessive protein intake, which indicates the need for a nutritional intervention in this age group. The paediatricians or doctors that monitor children, scientific associations and government institutions should make dietary recommendations to decrease the protein intake and facilitate the development of healthy dietary habits, which are of utmost importance in this life stage, when they get established. The role of this imbalance in overweight, obesity and low vitamin D levels, which was demonstrated by our study, are the subject of extensive studies at present.
FundingEvery phase of this study has been funded by Danone Nutricia Early Life Nutrition, Spain.
Conflicts of interestBegoña Soler was hired by Danone Nutricia Early Life Nutrition, Spain, for the design, quality control, and statistical analysis of the study, and the writing of this paper for publication.
The rest of the authors have no conflicts of interest to declare.
We thank the following paediatricians for their participation in the ALSALMA 2.0 study:
Magdalena Aga Aguirre; Felix Aguado Galan; Ignacio Aguilar Rey; Aurora Alonso Alvarez; Maria Elena Alvarez Garnelo; Isabel Alvarez Ibañez; Noelia Alvarez Zallo; Jose Amoros Garau; M. Luisa Arroba Basanta; Carlos Arruga Fernandez; Maria Teresa Asensi Monzo; Uxue Astigarraga Irureta; Isabel Barón Ruiz; Maria Paz Barrio Alonso; Maria Lucia Bartolome Lalanza; Eduard Bastida Ratera; M. Carmen Bezares Forner; Jose Angel Bilbao Sustacha; Luis Carlos Blesa Baviera; Lorenzo Boira Sanz; Eva Cecilia Bono Bordoy; Isabel Botana del Arco; Francisco Javier Bru Jaen; Antonio Cabrera Molina; Jesus Cal Cal; Fernando Calatayud Sáez; Pilar Camacho Conde; Maria Concepcion Carballo Pazo; Lourdes Cardenal Ysegarra; Carol Castellares Gonzalez; Inmaculada Clara Vila; Jorge Cocolina Andres; Jose Miguel Colina Jimeno; Gloria Colli Lista; Jeimy Lidice Corniel Peña; Alba Costa Ramirez; Lourdes Cozar Navarro; Isabel Cubillo Serna; M. del Rocio Cuesta Lopez; Nieves Cuevas Ortiz; Ana Laura Chindemi; Maria Teresa Darder Alorda; Montserrat de Alaiz Rojo; Carmen de la Torre Cecilia; Cristina de las Heras Diaz-Varela; Antonio de Miguel Ruiz; Carmen del Peral Aguilar; Carlos Diaz Gonzalez; Lourdes Diaz Martin; Antonia Diez Huerta; Maria Gabriela Dodino Furelos; Vasilica Doina Oniceag; Nieves Maria Dominguez Perez; Esther Elias Villanueva; Nieves Escarti Molla; Maria Isabel Espin Rios; Mercedes Espinosa Arevalo; Juan Francisco Exposito Montes; Elena Fabregat Ferrer; José Luis Fandiño Eguia; Jose Manuel Fernandez Bustillo; Maria Amparo Fernandez Campos; Santiago Andres Fernandez Cebrian; M. Luisa Fernandez Llamas Morejon; Sandra Fernandez Plaza; Francisco Jose Ferrandiz Pelegrin; Silvia Ferraz Sopena; Montserrat Ferre Guri; Bernardo Ferriz Mas; Isabel Ferriz Vidal; Joaquin Figueroa Alchapar; José Galán Rico; Francisca Galan Solano; Maria de la O Garcia Baeza; Olga Garcia Bodega; Maria Gloria Garcia Gomez; Eliecer Garcia Jimenez; Fatima Garcia Marin; Estrella Garcia Martinez; Eloisa Garcia-Caro Garcia; Francisco Javier Gascon Jimenez; M. Luisa Gayan Guardiola; David Gil Ortega; M. Angeles Gimenez Abian; Pablo Gimenez Fernandez; Mireia Gimenez San Andres; Cecilia Matilde Gomez Malaga; Alicia González del Amo Lopez; Magdalena González Fernández; Maria Isabel Gonzalez Marcos; Juan Antonio González Mateos; Jose Antonio González Palacios; Juan Manuel Gonzalez Perez; Victor Miguel Herrando Sanchis; Antonio Herrero Hernandez; Josune Hualde Olascoaga; Adriana Jianu Jianu; Inmaculada Jimenez del Barco Jaldo; Juan Manuel Jimenez Hereza; Teodorikez Jimenez Rodriguez; Jesús Jordan Martinez; Imad Kheiri Amin; Ana Lopez Aguileta de Ibisate; Ferran Lopez Cacho; Maria de los Reyes Lopez de Mesa; Demetrio López Pacios; Maximiliano Lourenço Diego; Manuel Luque Salas; Maria Celedonia Llorente Hernandez; Carmen Madrigal Diez; Noemi Magro Benito; Jose Maldonado Lozano; Jorge Juan Manresa Martínez; Juan Ignacio Manrique Martinez; Joan Marti Fernandez; Jose Luis Martín Blazquez; Xiomara Martin Guerrero; Beatriz Martin Redondo; Maria Dolores Martinez Camara; Miguel Angel Martinez de los Rios; Marcelino Martínez Hornos; Eduardo Martinez-Bone Montero; Maria Reyes Mazas Raba; Aurora Mesas Arostegui; Maria de la Merced Miguelez Vara; Salvador Millet Fite; Gisela Mimbrero Garcia; José Luis Molina Pagán; Agustin Mondejar Rodriguez; Ana María Montañés Sánchez; Pilar Montes De Oca Romero; Ana Isabel Monzon Bueno; Cesar Morales Albert; Jorge Muñoz Rueda; Jose Murcia Garcia; Ali Musa Mohamed-Ayesh; M. Carmen Navarro Zapata; Felix Notario Herrero; Esther Novoa Garcia; Cristina Ochoa; Carlos Maria Orbea Soroa; Victor Ormaechea Goiri; Rocio Ortega Guerra; Luis Ortigosa del Castillo; Carmen Padron Alvarez; Jose Ignacio Pareja Cerdo; Montserrat Parrilla Roure; Francisco Pena Lamela; Gloria Perez Cano; Patricia Perez del Valle; Jose Angel Perez Quintero; Nelson Eddy Pinedo; M. Concepción Polo Mellado; Juan Ramis Tarongi; Beatriz Real Rodriguez; Antonio Redondo Romero; Mercedes Reymundo Garcia; Ramiro Rial Gonzalez; Gemma Rosa Ricos Furio; Maria Elena Riera Perez; Matilde Riquelme Perez; Ana Isabel Rodriguez Cordobes; Jose Ramón Rodríguez Ruíz; Belen Romero Hidalgo; Esther Ruiz Chercoles; Beatriz Ruiz Derlinchan; Miguel Angel Ruiz Jimenez; Concepción Salete Alhaja; Maria Victoria Sanchez Lopez; Carlos Sánchez Salguero; Juan Gonzalo Santos Garcia; Aniuska Sutil Rosas; Elena Taborga Diaz; Rafael Talavera Rodriguez; M. del Carmen Torres Hinojal; Luis Mariano Valbuena Barrasa; Margarita Vazquez Olivares; Pilar Vazquez Tuñas; Antonio Verdu Mestre; Jordi Vila Cots; Elena Villena Rodriguez; Cristina Vique Garcia; Susana Viver Gomez; Montserrat Vives Campos; Victor Zamora Gutierrez; Fernando Zarate Osuna.
Please cite this article as: Dalmau J, Peña-Quintana L, Moráis A, Martínez V, Varea V, Martínez M, et al. Análisis cuantitativo de la ingesta de nutrientes en niños menores de 3 años. Estudio ALSALMA. An Pediatr (Barc). 2015;82:255–266.
Previous Presentations: National Congress of Pediatrics, 2014: Communication to Congress.
- Documento de manejo clínico del paciente pediátrico con infección por SARS-CoV-2.
(Actualizado el 26 de Noviembre de 2020) - Test de diagnóstico rápido en las consultas de Pediatría de Atención Primaria y Urgencias Pediátricas en la era COVID-19: más que una recomendación
(Actualizado el 21 de septiembre de 2020) - Consenso nacional sobre diagnóstico, estabilización y tratamiento del Síndrome Inflamatorio Multisistémico Pediátrico vinculado a SARS-CoV-2 (SIM-PedS).
(Actualizado el 27 de Julio de 2020) - Recomendaciones para el manejo del recién nacido en relación con la infección por SARS-CoV-2.
(Actualizado el 27 de Mayo de 2020) - Manejo del paciente pediátrico ante sospecha de infección por el nuevo coronavirus SARS-CoV-2 en atención primaria (COVID-19). AEPap-SEIP/AEP-SEPEAP.
(Actualizado el 27 de Abril de 2020) - Propuesta de adaptación de las recomendaciones de reanimación cardiopulmonar pediátrica avanzada a la infección por coronavirus.
(Actualizado el 11 de Abril de 2020)
articles

Anales de Pediatría (English Edition) follows the Recommendations for the Conduct, Reporting, Editing and Publication of Scholarly Work in Medical Journals