
Most anthropometric reference data for extremely preterm infants used in Spain are outdated and based on non-Spanish populations, or are derived from small hospital-based samples that failed to include neonates of borderline viability.
ObjectivesTo develop gender-specific, population-based curves for birth weight, length, and head circumference in extremely preterm Caucasian infants, using a large contemporary sample size of Spanish singletons.
Patients and methodsAnthropometric data from neonates ≤28 weeks of gestational age were collected between January 2002 and December 2010 using the Spanish database SEN1500. Gestational age was estimated according to obstetric data (early pregnancy ultrasound). The data were analysed with the SPSS.20 package, and centile tables were created for males and females using the Cole and Green LMS method.
ResultsThis study presents the first population-based growth curves for extremely preterm infants, including those of borderline viability, in Spain. A sexual dimorphism is evident for all of the studied parameters, starting at early gestation.
ConclusionsThese new gender-specific and population-based data could be useful for the improvement of growth assessments of extremely preterm infants in our country, for the development of epidemiological studies, for the evaluation of temporal trends, and for clinical or public health interventions seeking to optimise foetal growth.
La mayoría de los datos antropométricos de referencia utilizados en nuestro país proceden de estudios llevados a cabo fuera del mismo hace muchos años, o bien están basados en datos de un único o pocos centros. Además, el número de recién nacidos extremadamente prematuros (RNEP) incluidos ha sido muy escaso.
ObjetivosDesarrollar unas tablas y gráficas de referencia poblacionales en nuestro país para el peso, la longitud y el perímetro craneal (PC), por edad gestacional y sexo, en RNEP de raza blanca procedentes de gestaciones únicas.
Pacientes y métodosSe incluyeron de todos los recién nacidos ≤ 28 semanas de EG, registrados sobre la base de los datos SEN1500 durante 10 años (2002–2011). La EG se estimó basándose en la ecografía fetal precoz o la fecha de la última regla. Los datos se analizaron mediante el paquete estadístico SPSS 20 y se crearon tablas percentiladas de referencia independientes para varones y mujeres, utilizando el método LMS de Cole y Green.
ResultadosSe presentan las primeras tablas y gráficas percentiladas con base poblacional en nuestro país de peso, longitud y PC en RNEP, incluyendo recién nacidos al límite de viabilidad. Se objetiva un dimorfismo sexual desde las 23 semanas de gestación.
ConclusionesEstas nuevas referencias, específicas por sexo y de base poblacional, pueden ser útiles para mejorar la evaluación del crecimiento del prematuro extremo en nuestro país, así como para el desarrollo de estudios epidemiológicos, o evaluación de tendencias temporales y de intervenciones clínicas o de salud pública dirigidas a la optimización del crecimiento fetal. Un dimorfismo sexual es evidente desde etapas muy tempranas de la gestación.
For over half a century, various somatometric studies in newborns have established reference data for birth weight, length, and head circumference (HC). The first studies from North America are dated from the 1960s1,2 and have been and continue to be used in many neonatal units worldwide. However, many of these studies are not population-based, are based on the data of a single or a few centres, the data collection methodology is inconsistent, they may offer data obtained from different groups of patients, and sometimes do not take into consideration the sex of the newborn, providing grouped data for both sexes. Furthermore, some studies exclude high-risk pregnancies and many calculate GA based solely on the date of the last menstrual period (LMP). This was common practise in the early studies, and may have led to estimation errors, which would be more accused the greater the prematurity and also in post-term gestations.3,4 Another methodological issue is whether GA is given on the basis of completed weeks or rounded off to the nearest completed week.5 Based on the chosen criterion, one child could be included in one category or the one immediately above. Finally, but no less important, the improvement of health care both in general and for mothers in particular means that standard references from over 50 years ago may not be appropriate for present-day neonates.
Something that is wanting in the past and in most of the present studies is the low number of extremely preterm infants they include, especially newborns below 26 weeks GA.6 This gap makes it hard to know what is appropriate in intrauterine trophogenic growth in this group of preterm neonates, and in addition to limiting the development of epidemiological studies on temporal trends, it prevents the assessment of the impact of clinical or public health interventions that seek to enhance foetal growth. Consequently, the objective of this study was to develop population-based reference tables and charts in Spain for weight, length, and head circumference by GA and sex in extremely preterm (22–28 weeks of GA) white singleton newborns free from major congenital anomalies.
Patients and methodsUsing the Red Nacional Española SEN1500 (SEN1500 National Spanish Network) database,7 we conducted a cross-sectional study of all live-birth newborns including those who died in the delivery room, who were Caucasian, singleton, and born without malformations in participating hospitals from January 1, 2002 to December 31, 2011. The number of participating centres varied during the period under study, ranging from 49 to 63. The centres represented nearly all of Spain's autonomous communities, and we estimate that the study included between 60% and 65% of all very-low-birth-weight infants in Spain.
Measurements were taken following the usual procedures in each participating centre. The collected data were entered in the morbidity and mortality form of the Network, previously approved by the research and ethics boards of the participating hospitals. The form included data on the NBW, length, and HC. We recorded our best possible GA estimation in the form, taking into account LMP, obstetric parameters, and prenatal ultrasound information retrieved from maternal medical records. Whenever necessary, it was estimated by a neonatologist based on physical criteria, neurological examination, and a combination of the physical exam and GA (Ballard or Dubowitz score). We used the mother's race for the purposes of racial or ethnic classification.
We excluded patients of unknown sex, born of multiple gestations, or with major congenital malformations or chromosomopathies. We also excluded patients with biologically implausible measurements, defined as values more than three times the interquartile range, over the third quartile (75th percentile) or below the first quartile (25th percentile), for each GA and sex.
Statistical analysisWe analysed the data using the SPSS 20 statistical package. We used the mean±SD as the measure of central tendency. The means for males and females were compared with Student's t-test for a significance level of p<0.05. For each subgroup of males and females, we estimated the percentile curves (3rd, 10th, 25th, 50th, 75th, 90th, and 97th pctl) for weight, length, and HC. To do so, we assumed that the data fit the LMS model of Cole and Green.8 This assumes the existence of the L(t), M(t) and S(t) curves (Box–Cox power, medians, and coefficients of variation), from which the curve of the 100α percentiles (0<α<1) is obtained as follows: Cα (t)=M(t) (1+zα·S[t]·L[t])1/L(t), when L(t)≠0; or Cα(t)=M(t) exp (zα·S[t]), when L(t)=0, with zα corresponding to the αth quantile of the standard normal distribution. The L, M, and S curves were estimated by means of cubic splines in the framework of the generalised additive models for location, scale, and shape (GAMLSS). The resulting z-scores followed a normal distribution and were smoothed and converted to percentiles for clinical use.
The study was approved by the Research, Teaching, and Continued Education Committee of the centre of the principal investigator (FG-MR).
ResultsDuring the period under study (2002–2011) a total of 27205 patients with birth weights ≤1500g were recorded in the database. The ethnic/racial distribution was: Caucasian: 17708 (65.1%), Latin American: 943 (3.5%), Gypsy: 457 (1.7%), black: 398 (1.5%), Asian: 172 (0.6%), and data missing or recorded incorrectly: 7527 (27.7%). Given the purpose of this work, we chose to focus on Caucasian newborns with GA ≤28 weeks, who added up to 7001 patients. Out of this total, we excluded 2233 (31.9%) born of multiple gestations. Out of the remaining 4768 (68.1%) singleton neonates, we excluded 230 who had severe congenital anomalies and/or chromosomopathies. We excluded 16 of the remaining 4538 patients because they had biologically implausible measurements, values in any of the 3 studied parameters (weight, length, or HC) 3 times greater or smaller than the interquartile range (extreme outliers). In the end, 4522 patients were included, of which 2489 (55%) were male and 2033 (45%) were female.
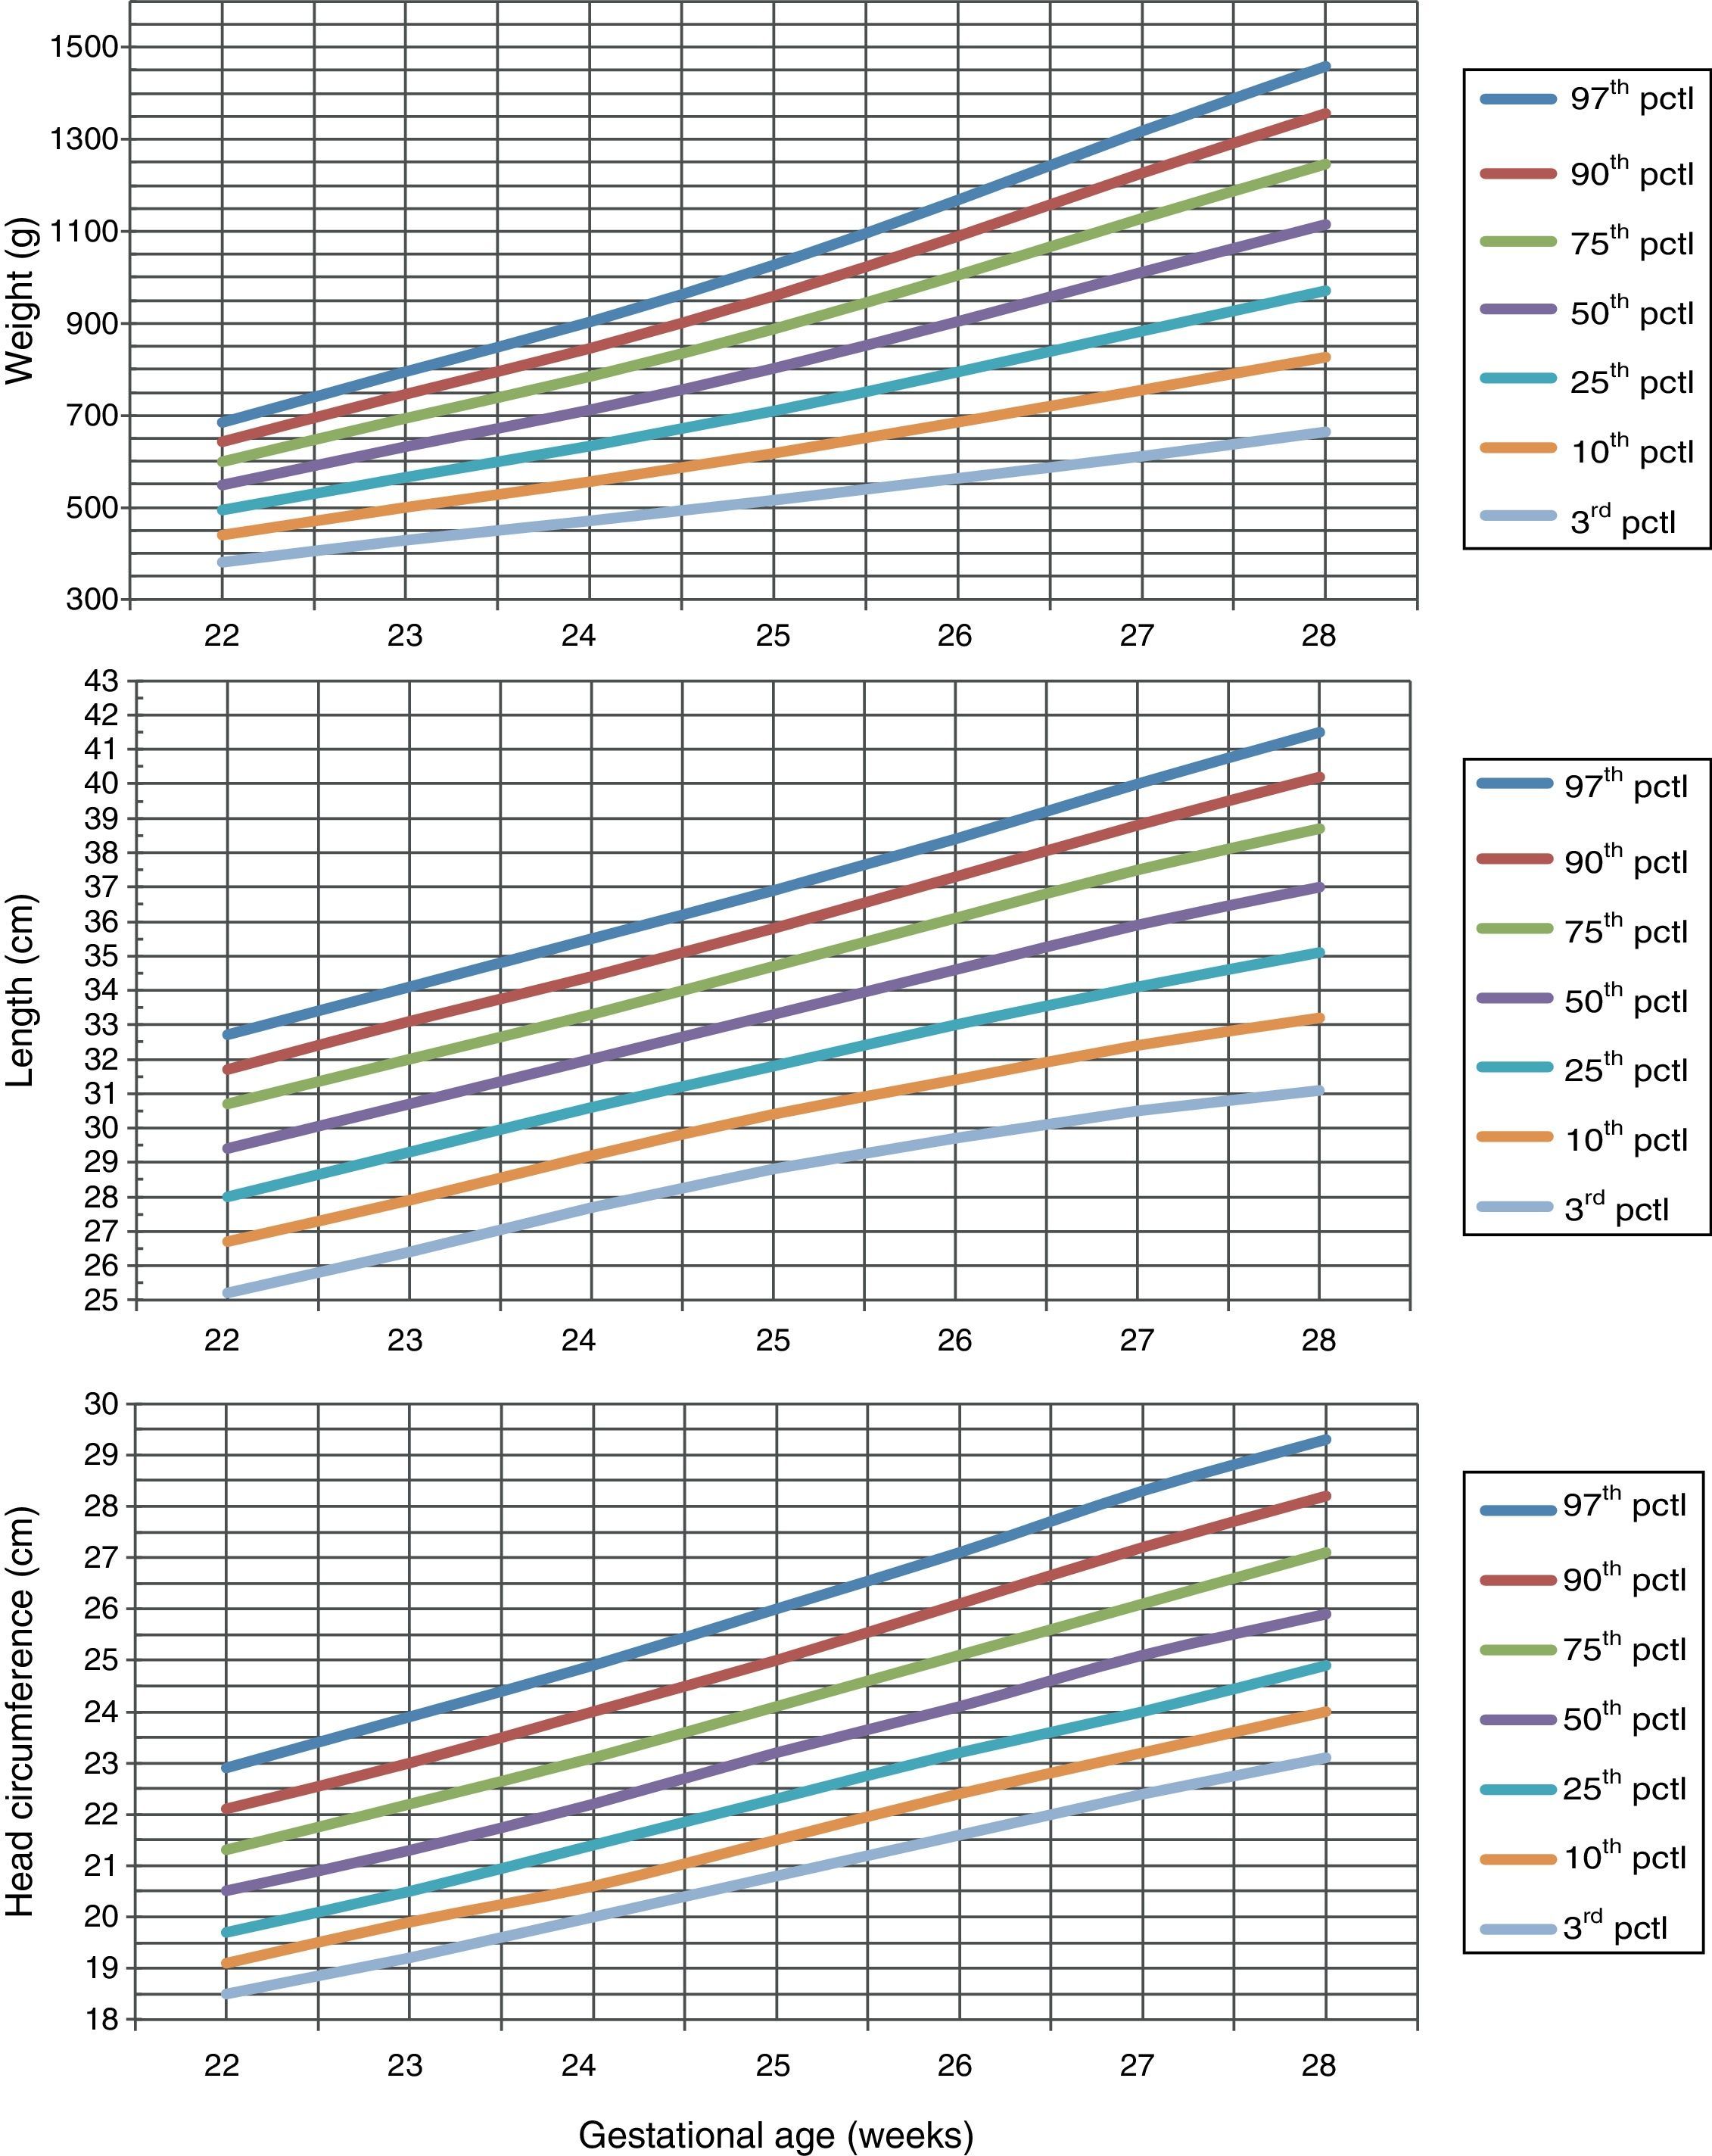
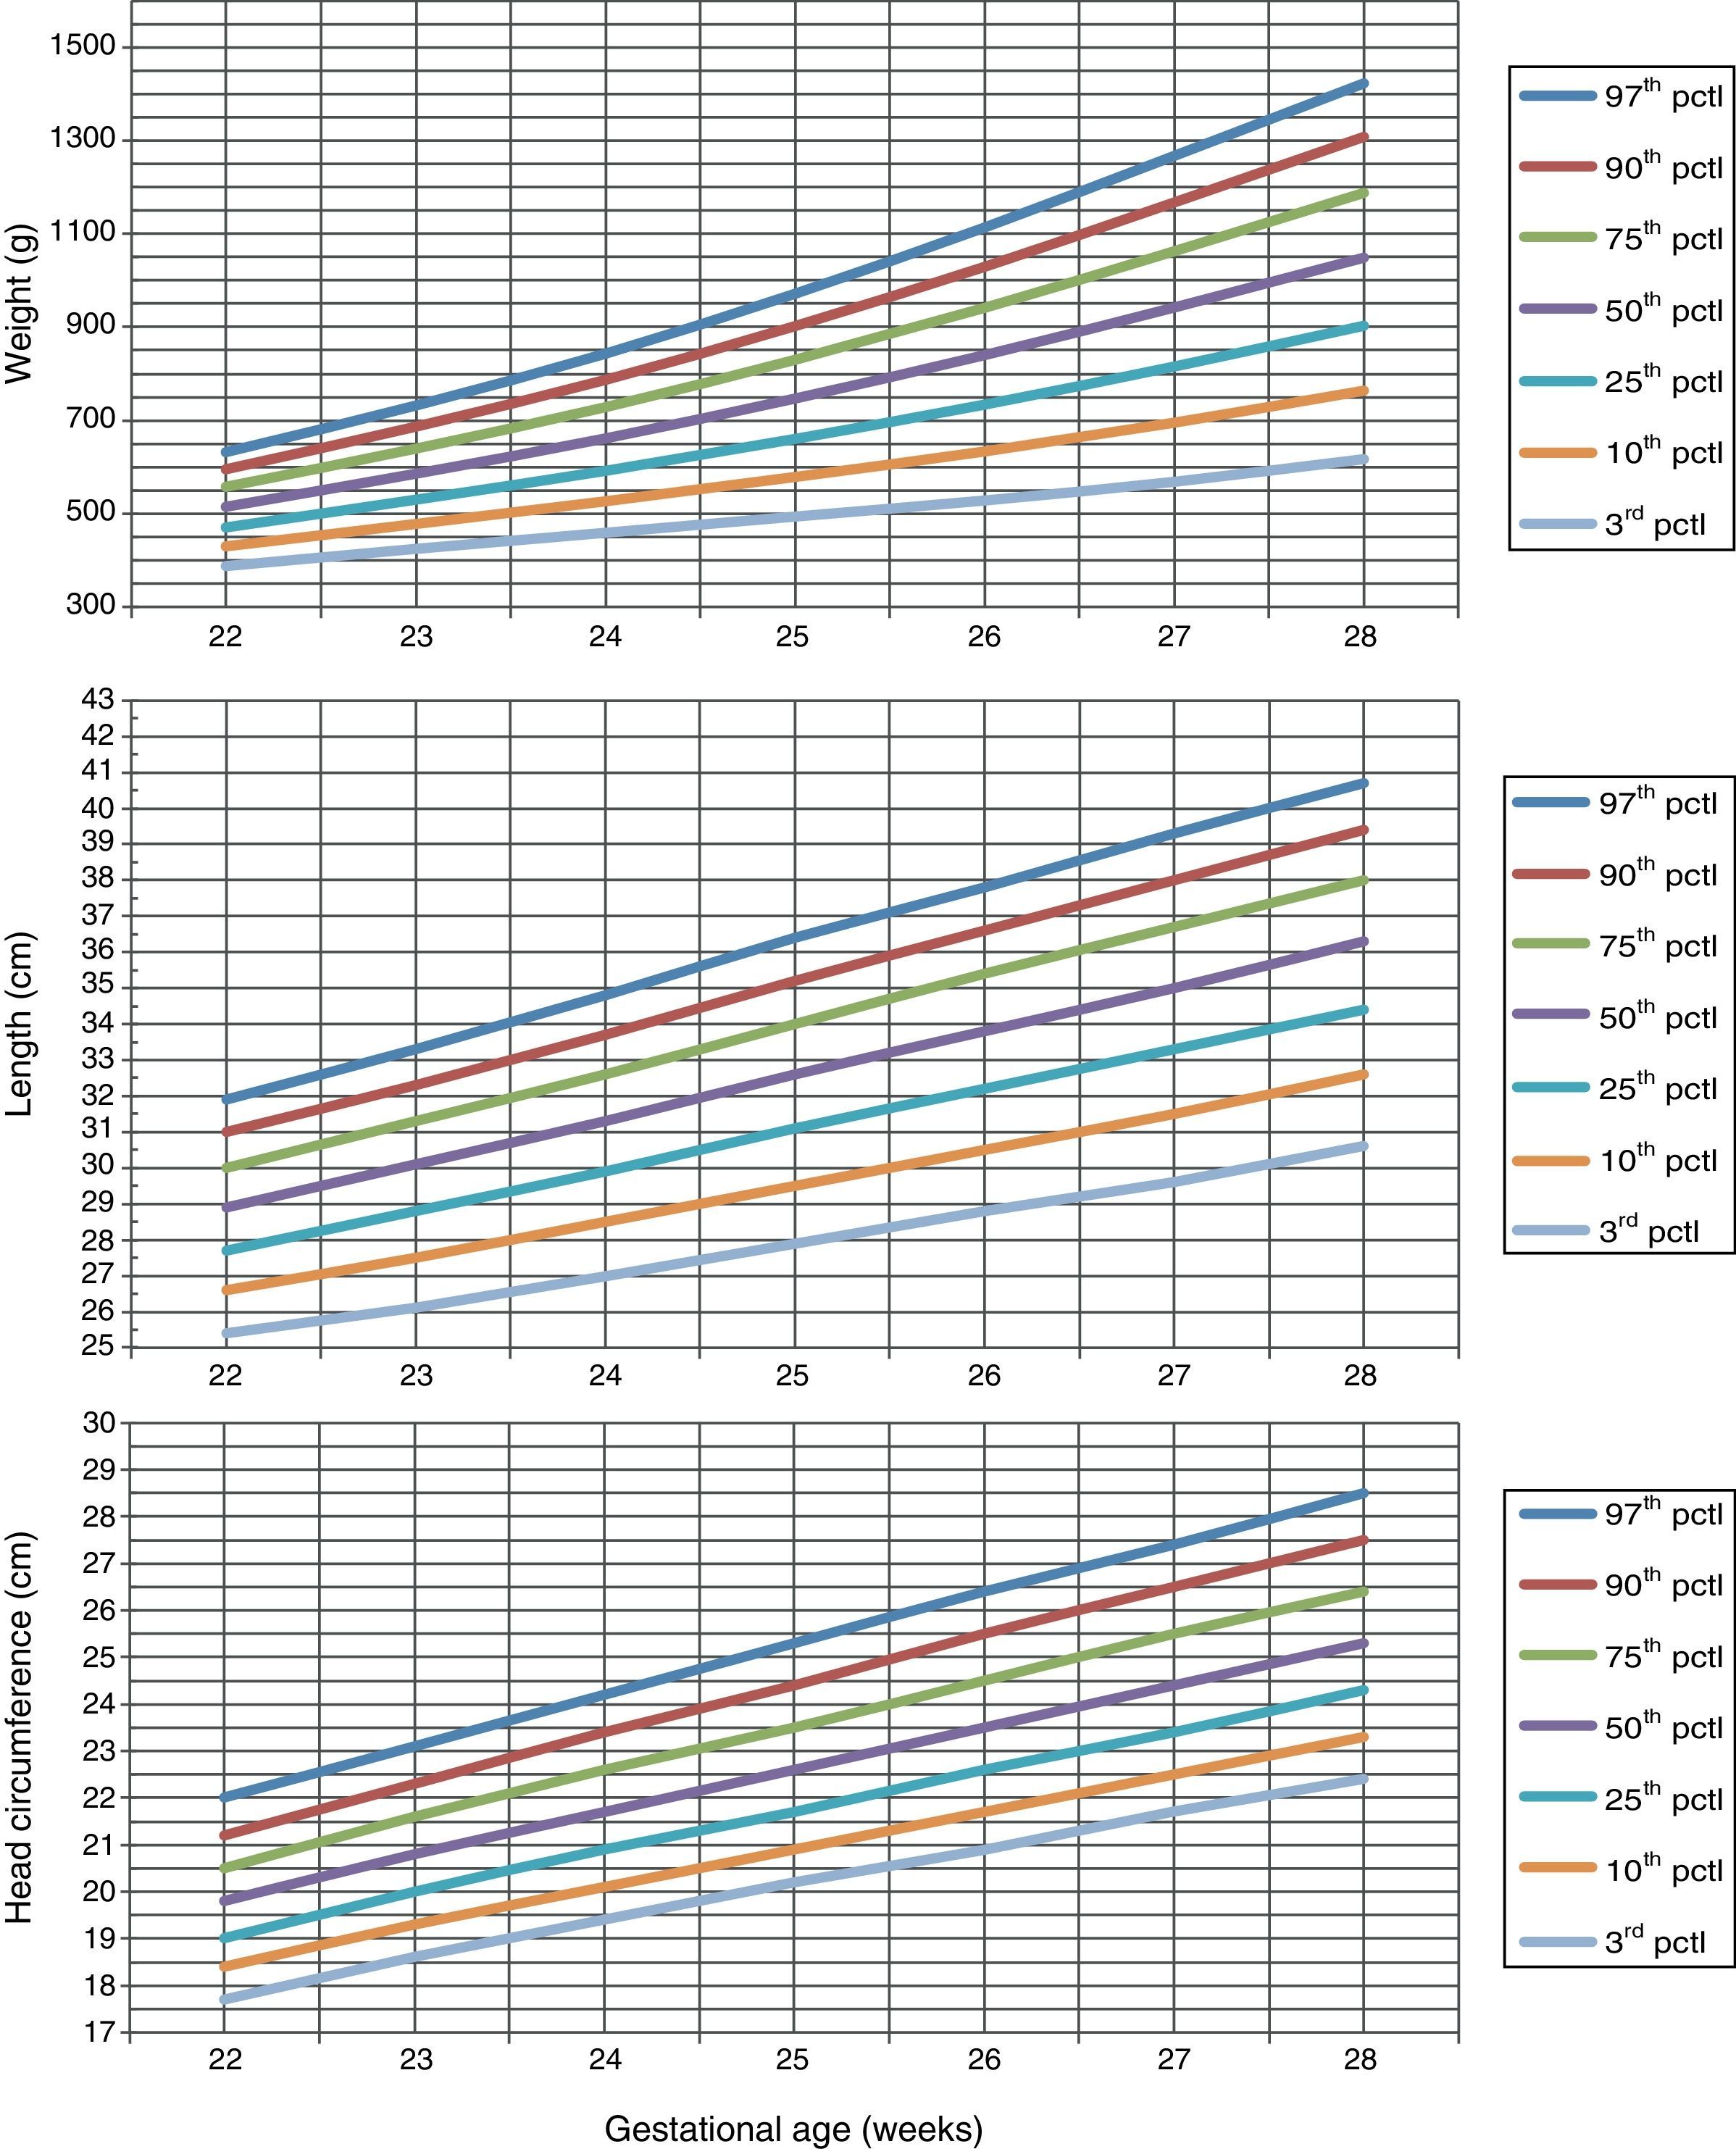
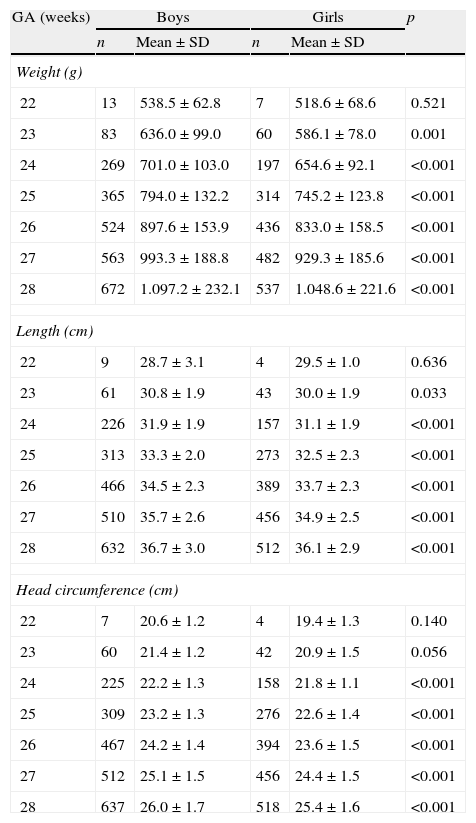
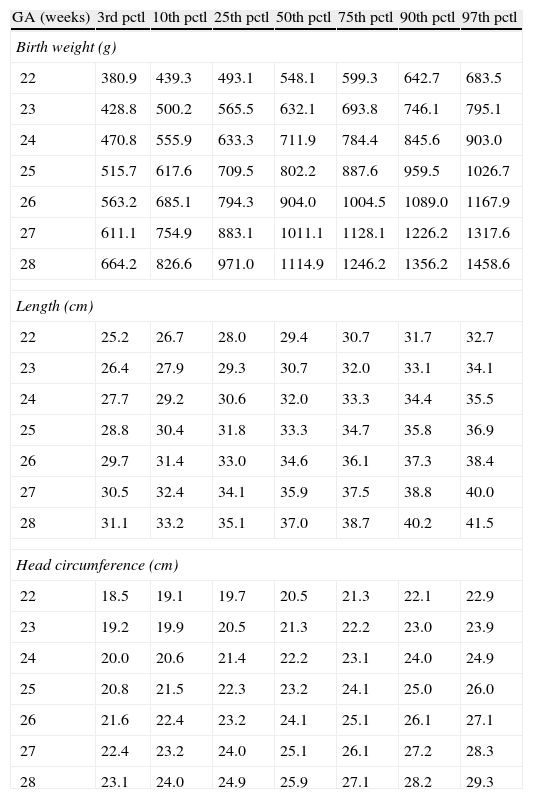
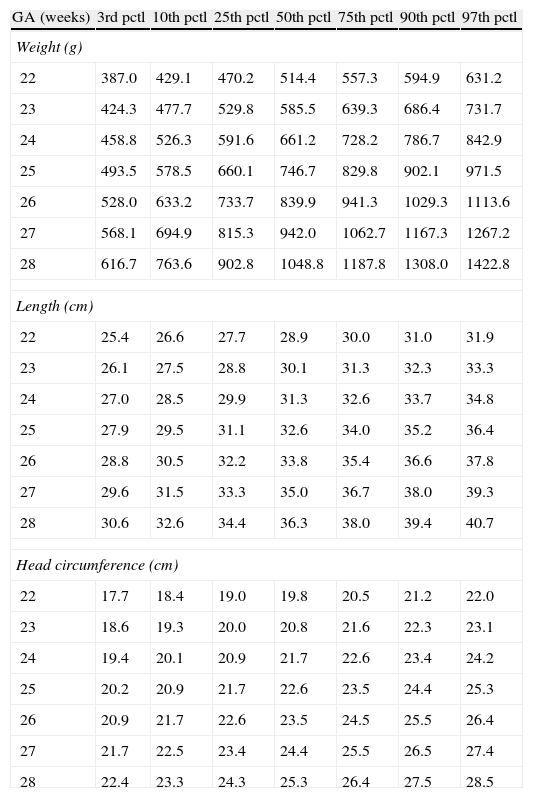
Table 1 shows the somatometric data (weight, length, and HC) by GA (22–28 weeks) and compares the differences between males and females. These differences were statistically significant (p<0.05) starting at week 23 for all 3 studied parameters, except for HC at 23 weeks (p=0.056). Tables 2 and 3 show the 3rd, 10th, 25th, 50th (median), 75th, 90th, and 97th percentiles for weight, length, and HC by GA for each sex, respectively. Lastly, Figs. 1 and 2 offer a graphic representation of the above data separately for males and females.
Comparisons between boys and girls for weight, length, and head circumference, by GA.
| GA (weeks) | Boys | Girls | p | ||
| n | Mean±SD | n | Mean±SD | ||
| Weight (g) | |||||
| 22 | 13 | 538.5±62.8 | 7 | 518.6±68.6 | 0.521 |
| 23 | 83 | 636.0±99.0 | 60 | 586.1±78.0 | 0.001 |
| 24 | 269 | 701.0±103.0 | 197 | 654.6±92.1 | <0.001 |
| 25 | 365 | 794.0±132.2 | 314 | 745.2±123.8 | <0.001 |
| 26 | 524 | 897.6±153.9 | 436 | 833.0±158.5 | <0.001 |
| 27 | 563 | 993.3±188.8 | 482 | 929.3±185.6 | <0.001 |
| 28 | 672 | 1.097.2±232.1 | 537 | 1.048.6±221.6 | <0.001 |
| Length (cm) | |||||
| 22 | 9 | 28.7±3.1 | 4 | 29.5±1.0 | 0.636 |
| 23 | 61 | 30.8±1.9 | 43 | 30.0±1.9 | 0.033 |
| 24 | 226 | 31.9±1.9 | 157 | 31.1±1.9 | <0.001 |
| 25 | 313 | 33.3±2.0 | 273 | 32.5±2.3 | <0.001 |
| 26 | 466 | 34.5±2.3 | 389 | 33.7±2.3 | <0.001 |
| 27 | 510 | 35.7±2.6 | 456 | 34.9±2.5 | <0.001 |
| 28 | 632 | 36.7±3.0 | 512 | 36.1±2.9 | <0.001 |
| Head circumference (cm) | |||||
| 22 | 7 | 20.6±1.2 | 4 | 19.4±1.3 | 0.140 |
| 23 | 60 | 21.4±1.2 | 42 | 20.9±1.5 | 0.056 |
| 24 | 225 | 22.2±1.3 | 158 | 21.8±1.1 | <0.001 |
| 25 | 309 | 23.2±1.3 | 276 | 22.6±1.4 | <0.001 |
| 26 | 467 | 24.2±1.4 | 394 | 23.6±1.5 | <0.001 |
| 27 | 512 | 25.1±1.5 | 456 | 24.4±1.5 | <0.001 |
| 28 | 637 | 26.0±1.7 | 518 | 25.4±1.6 | <0.001 |
Weight (g), length (cm), and head circumference (cm) percentiles for males, by GA in weeks.
| GA (weeks) | 3rd pctl | 10th pctl | 25th pctl | 50th pctl | 75th pctl | 90th pctl | 97th pctl |
| Birth weight (g) | |||||||
| 22 | 380.9 | 439.3 | 493.1 | 548.1 | 599.3 | 642.7 | 683.5 |
| 23 | 428.8 | 500.2 | 565.5 | 632.1 | 693.8 | 746.1 | 795.1 |
| 24 | 470.8 | 555.9 | 633.3 | 711.9 | 784.4 | 845.6 | 903.0 |
| 25 | 515.7 | 617.6 | 709.5 | 802.2 | 887.6 | 959.5 | 1026.7 |
| 26 | 563.2 | 685.1 | 794.3 | 904.0 | 1004.5 | 1089.0 | 1167.9 |
| 27 | 611.1 | 754.9 | 883.1 | 1011.1 | 1128.1 | 1226.2 | 1317.6 |
| 28 | 664.2 | 826.6 | 971.0 | 1114.9 | 1246.2 | 1356.2 | 1458.6 |
| Length (cm) | |||||||
| 22 | 25.2 | 26.7 | 28.0 | 29.4 | 30.7 | 31.7 | 32.7 |
| 23 | 26.4 | 27.9 | 29.3 | 30.7 | 32.0 | 33.1 | 34.1 |
| 24 | 27.7 | 29.2 | 30.6 | 32.0 | 33.3 | 34.4 | 35.5 |
| 25 | 28.8 | 30.4 | 31.8 | 33.3 | 34.7 | 35.8 | 36.9 |
| 26 | 29.7 | 31.4 | 33.0 | 34.6 | 36.1 | 37.3 | 38.4 |
| 27 | 30.5 | 32.4 | 34.1 | 35.9 | 37.5 | 38.8 | 40.0 |
| 28 | 31.1 | 33.2 | 35.1 | 37.0 | 38.7 | 40.2 | 41.5 |
| Head circumference (cm) | |||||||
| 22 | 18.5 | 19.1 | 19.7 | 20.5 | 21.3 | 22.1 | 22.9 |
| 23 | 19.2 | 19.9 | 20.5 | 21.3 | 22.2 | 23.0 | 23.9 |
| 24 | 20.0 | 20.6 | 21.4 | 22.2 | 23.1 | 24.0 | 24.9 |
| 25 | 20.8 | 21.5 | 22.3 | 23.2 | 24.1 | 25.0 | 26.0 |
| 26 | 21.6 | 22.4 | 23.2 | 24.1 | 25.1 | 26.1 | 27.1 |
| 27 | 22.4 | 23.2 | 24.0 | 25.1 | 26.1 | 27.2 | 28.3 |
| 28 | 23.1 | 24.0 | 24.9 | 25.9 | 27.1 | 28.2 | 29.3 |
Weight (g), length (cm), and head circumference (cm) percentiles for females, by GA in weeks.
| GA (weeks) | 3rd pctl | 10th pctl | 25th pctl | 50th pctl | 75th pctl | 90th pctl | 97th pctl |
| Weight (g) | |||||||
| 22 | 387.0 | 429.1 | 470.2 | 514.4 | 557.3 | 594.9 | 631.2 |
| 23 | 424.3 | 477.7 | 529.8 | 585.5 | 639.3 | 686.4 | 731.7 |
| 24 | 458.8 | 526.3 | 591.6 | 661.2 | 728.2 | 786.7 | 842.9 |
| 25 | 493.5 | 578.5 | 660.1 | 746.7 | 829.8 | 902.1 | 971.5 |
| 26 | 528.0 | 633.2 | 733.7 | 839.9 | 941.3 | 1029.3 | 1113.6 |
| 27 | 568.1 | 694.9 | 815.3 | 942.0 | 1062.7 | 1167.3 | 1267.2 |
| 28 | 616.7 | 763.6 | 902.8 | 1048.8 | 1187.8 | 1308.0 | 1422.8 |
| Length (cm) | |||||||
| 22 | 25.4 | 26.6 | 27.7 | 28.9 | 30.0 | 31.0 | 31.9 |
| 23 | 26.1 | 27.5 | 28.8 | 30.1 | 31.3 | 32.3 | 33.3 |
| 24 | 27.0 | 28.5 | 29.9 | 31.3 | 32.6 | 33.7 | 34.8 |
| 25 | 27.9 | 29.5 | 31.1 | 32.6 | 34.0 | 35.2 | 36.4 |
| 26 | 28.8 | 30.5 | 32.2 | 33.8 | 35.4 | 36.6 | 37.8 |
| 27 | 29.6 | 31.5 | 33.3 | 35.0 | 36.7 | 38.0 | 39.3 |
| 28 | 30.6 | 32.6 | 34.4 | 36.3 | 38.0 | 39.4 | 40.7 |
| Head circumference (cm) | |||||||
| 22 | 17.7 | 18.4 | 19.0 | 19.8 | 20.5 | 21.2 | 22.0 |
| 23 | 18.6 | 19.3 | 20.0 | 20.8 | 21.6 | 22.3 | 23.1 |
| 24 | 19.4 | 20.1 | 20.9 | 21.7 | 22.6 | 23.4 | 24.2 |
| 25 | 20.2 | 20.9 | 21.7 | 22.6 | 23.5 | 24.4 | 25.3 |
| 26 | 20.9 | 21.7 | 22.6 | 23.5 | 24.5 | 25.5 | 26.4 |
| 27 | 21.7 | 22.5 | 23.4 | 24.4 | 25.5 | 26.5 | 27.4 |
| 28 | 22.4 | 23.3 | 24.3 | 25.3 | 26.4 | 27.5 | 28.5 |


The group of patients in the study and the data represented in the tables and figures of this article constitute the most sizable and recent set of population-based somatometric data on extremely preterm newborns published to date in Spain. These new charts can be very useful to the clinician, allowing a more accurate classification of the extremely preterm infant into small-, appropriate-, or large-for-GA as a function of sex. A relevant finding in this work was the presence of sexual dimorphism from early gestational ages. Our study found significant differences in weight, length, and HC between boys and girls starting at 23 weeks of GA. Previous studies9 had only observed this sexual dimorphism from the 30th week of gestation, probably due to the inclusion of a much smaller number of neonates in each GA group.
The specialised literature has repeatedly stated the unsuitability of extrapolating data obtained from other populations and the need for each community to have reference values of its own. In this regard, numerous efforts have been made in Spain to establish the normal growth patterns in some areas,10–16 and to keep them up to date.9 Yet a limitation inherent to the methodology of these studies is precisely the selection of an exclusively local population, which makes it harder to extrapolate the data to other autonomous communities and regions. It also makes it impossible to have a large enough number of patients of extreme ages to find potentially relevant differences, such as the sexual dimorphism seen in our work starting at 23 weeks of gestation.
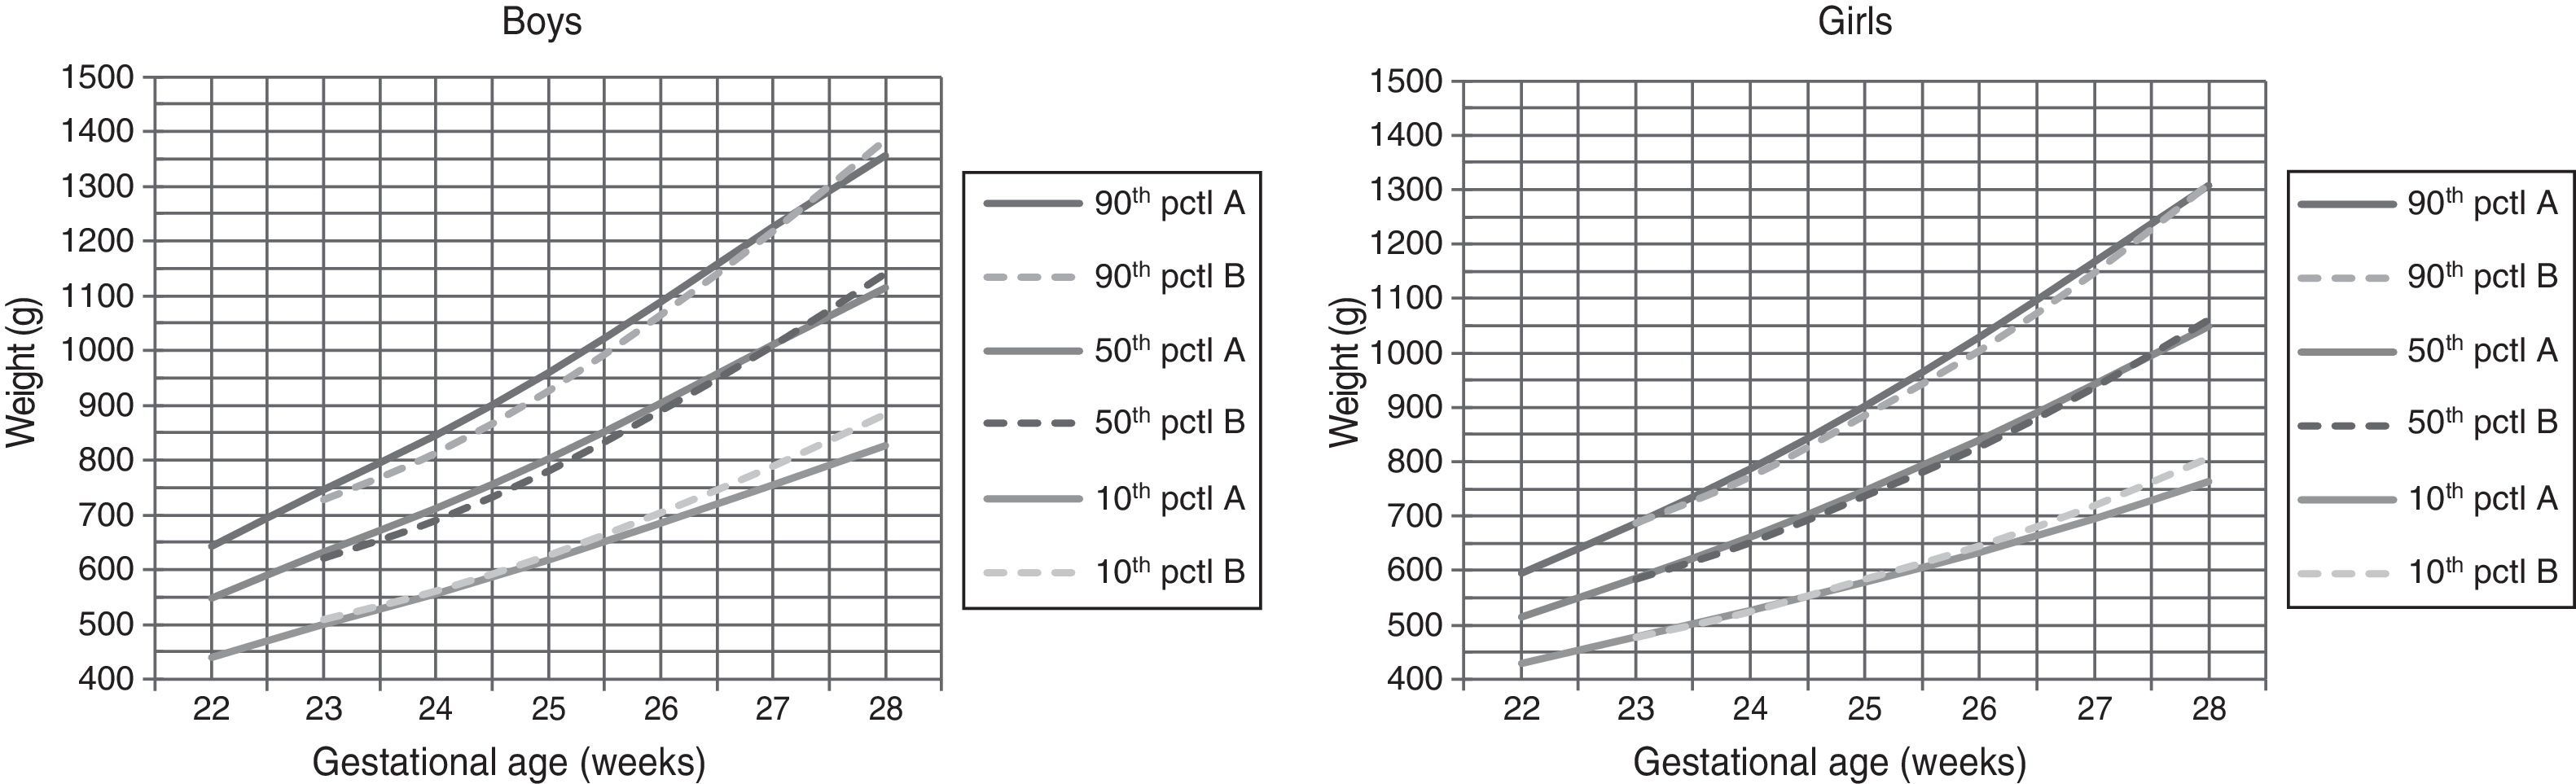
In our study we compared the curves obtained from a large sample of newborns representing almost every region in Spain with other curves commonly used as reference values, but which were obtained from a more limited population (2 Spanish hospitals).9 We could only make the comparison from the 26th week, as the study we just mentioned has no data for lower gestational ages. Furthermore, the number of patients included for each GA was smaller than in our study, ranging from 18 to 64 patients at 26 and 28 weeks of GA, respectively. Although the average weight values in both studies were pretty similar, we found the largest difference in the 90th percentile values, which were consistently smaller in the study by Carrascosa et al. (from 4% to 8% in males, and from 0.4% to 10% in females, for the different gestational ages). Likewise, the 10th percentile values were systematically larger in females, although not in males, in that study (between 4% and 22%). These data could lead to overestimating patients with weights that are either large or small for GA when using the tables by Carrascosa in gestational ages below 28 weeks. In contrast, Fig. 3 shows the similarity of our results to those of a recent publication that studied a contemporary, large, and racially diverse sample in the United States.17
 for males (left) and females (right) compared to the curves by Olsen et al.18 (dotted lines, starting at 23 weeks).")
New gestational-age specific weight curves (continuous lines) for males (left) and females (right) compared to the curves by Olsen et al.18 (dotted lines, starting at 23 weeks).
Although some authors consider that it is more appropriate to include all races and ethnicities present in the population for results to be more representative of the latter,17 it is generally accepted that there are differences between the normal growth patterns of these groups.18 To avoid potential biases in our study, we chose to include only Caucasian NBs. However, we did not exclude children of mothers with a chronic condition (diabetes, high blood pressure, etcetera), or harmful habits (use or abuse of alcohol, tobacco, drugs, etcetera), as these situations are relatively prevalent and/or are widespread in the population, in addition to constituting a “continuum” in the severity of the condition or the degree to which it can be controlled, as well as in the frequency and intensity of the use of substances, which makes it very hard, if not impossible, to separate subjects in whom the “marker” is present from those in whom it is not. Ultimately, such individuals are part of the “normal” population, and their exclusion, besides being potentially inaccurate and/or arbitrary, could lead to biased results, overestimating the actual growth values in the population. For this reason, “prescriptive” (as opposed to “descriptive”) references might not be applicable to populations in which low-risk and high-risk pregnancies mix.19
A frequent subject of debate is whether the best approach is to develop curves from cross-sectional data, as these represent the “ideal” growth of the foetus, which differs from postnatal growth, particularly in preterm newborns.20–24 Furthermore, prematurity itself may be triggered by processes that interfere with intrauterine foetal growth, for which reason a preterm NB could be smaller than a foetus of the same GA that remains in utero. On the other hand, while improvements in ultrasound techniques over the past 25 years have allowed us to make longitudinal serial measurements of the estimated foetal weight (EFW), some studies have found that infants born prematurely have lower birth weights than predicted by these estimates.25,26 This is why the use of tables developed from cross-sectional postnatal data may underestimate the real incidence of small-for-gestational-age NBs, which may have clinical consequences. Still, pregnancy dating based on ultrasonography is also inaccurate to a certain extant, and ultrasound-derived EFW is not a direct measure, while a variability of up to ±15% in relation to BW has been observed for these estimates. For these reasons, and despite their limitations, the tables obtained from cross-sectional data of patients born at various gestational ages continue to be widely accepted and used to estimate newborn size and its postnatal evolution.27–29 In fact, it is accepted that they represent actual foetal growth up to birth, and its use is recommended for setting preterm infant growth goals by some scientific societies.30
One limitation of our study, as in all population-based studies, has to do with the accuracy and reliability of results as a function of the instruments used to make measurements and the large number of researchers that make them. Although under experimental conditions the homogeneity of instruments and the fact that only one or a few researchers make the measurements could improve the accuracy of the results, multicentre studies like the one we present here are more representative of the population that they address and could better reflect clinical care practises, so their results may be more generalisable.
To conclude, the population-based, sex-specific data and charts that we present here could provide a useful standard reference for improving growth assessment in extremely preterm infants in Spain. They could also help in the development of epidemiological studies or the evaluation of temporal trends and in clinical or public health interventions to enhance foetal growth. Some studies have shown that an improvement in maternal health, mainly due to healthier nutrition and lifestyle, has led to a progressive increase in foetal and NB size over time.31 It is highly recommended that the data for any given population be updated periodically.
Conflicts of interestThe authors have no conflicts of interest to declare.
Please cite this article as: García-Muñoz Rodrigo F, García-Alix Pérez A, Figueras Aloy J, Saavedra Santana P. Nuevas curvas poblacionales de crecimiento en recién nacidos extremadamente prematuros españoles. An Pediatr (Barc). 2014;81:107–114.