
Monitoring the partial pressure of CO2 (PCO2) in newborns who require ventilation would allow avoiding hypocapnia and hypercapnia. The measurement of end-tidal carbon dioxide (ETCO2) is an alternative rarely implemented in this population.
ObjectiveTo evaluate the relationship between ETCO2 and PCO2 in newborns.
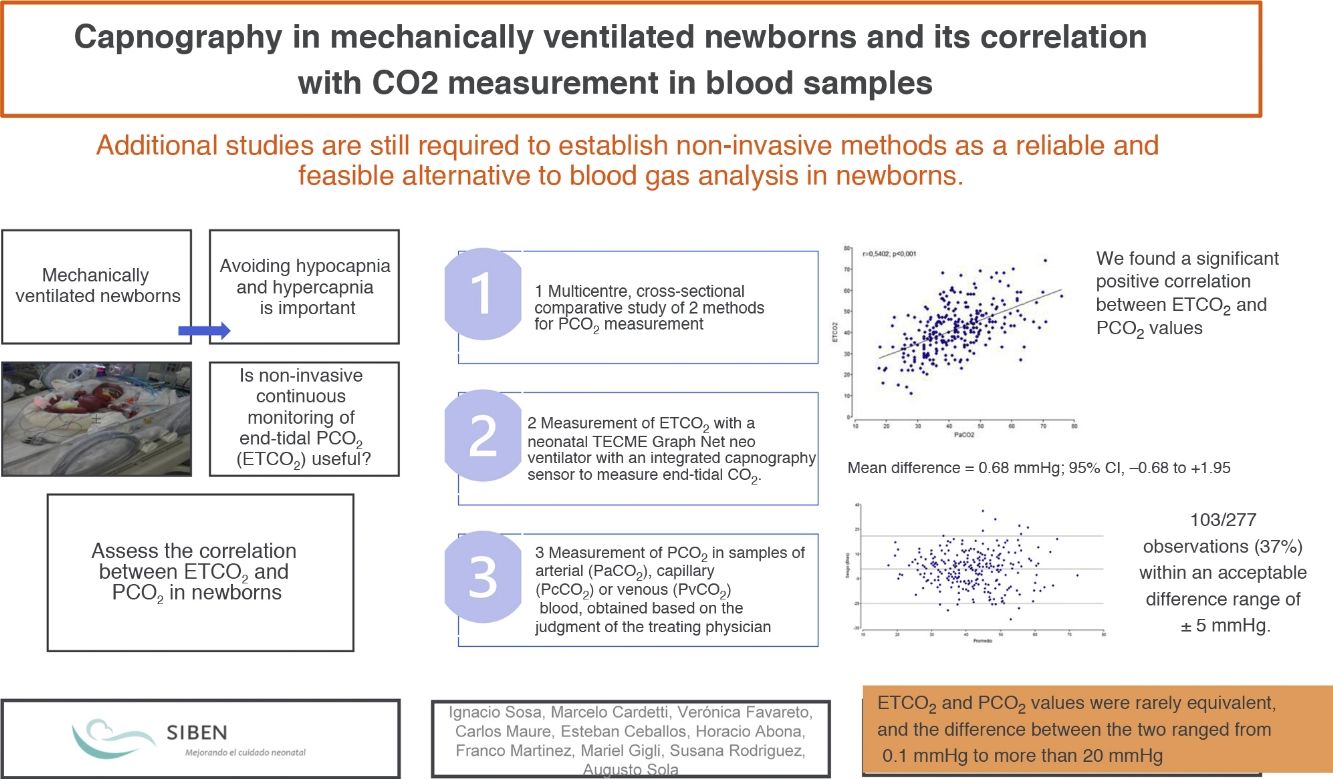
MethodsCross-sectional study comparing two PCO2 measurement methods, the conventional one by analysis of blood samples and the one estimated by ETCO2. The study included hospitalized newborns that required conventional mechanical ventilation. The ETCO2 was measured with a Tecme GraphNet® neo, a neonatal ventilator with an integrated capnograph, and we obtained the ETCO2–PCO2 gradient. We conducted correlation and Bland-Altman plot analyses to estimate the agreement.
ResultsA total of 277 samples (ETCO2 / PCO2) from 83 newborns were analyzed. The mean values of ETCO2 and PCO2 were 41.36mmHg and 42.04mmHg. There was a positive and significant correlation between ETCO2 and PCO2 in the overall analysis (r=0.5402; P<.001) and in the analysis of each unit (P<.001). The mean difference was 0.68 mmHg (95% CI, –0.68 to 1.95) and was not significant. We observed a positive systematic error (PCO2 > ETCO2) in 2 of the units, and a negative difference in the third (PCO2 < ETCO2).
DiscussionThe correlation between ETCO and PCO2 was significant, although the obtained values were not equivalent, with differences ranging from 0.1mmHg and 20mmHg. Likewise, we found systematic errors that differed in sign (positive or negative) between institutions.
Monitorear la presión parcial de CO2 (PCO2) en los recién nacidos que requieren ventilación permitiría evitar hipocapnia e hipercapnia. La medición de CO2 espirada (ETCO2) es una alternativa poco implementada en esta población.
ObjetivoEvaluar la relación entre la ETCO2 y la PCO2 en recién nacidos
MétodosEstudio de corte transversal, comparativo entre dos métodos de medición de PCO2, el convencional mediante análisis de muestras sanguíneas y el estimado mediante ETCO2. Se incluyeron recién nacidos internados que requerían ventilación mecánica convencional. La medición de ETCO2 se realizó mediante un ventilador neonatal Graph Net Neo – TECME®, con capnógrafo incorporado y se obtuvo el gradiente ETCO2 – PCO2. Se realizaron análisis de correlación y gráficos de Bland Altman para estimar la concordancia.
ResultadosSe analizaron 277 muestras (ETCO2 / PCO2) en 83 recién nacidos. Los valores promedios de ETCO2 y PCO2 fueron de 41.36mmHg y 42.04mmHg, Hubo correlación positiva y significativa entre ETCO2 y PCO2 en el análisis global (r=0,5402; p<0,001) y en el de cada unidad (p<0,001). La media de las diferencias fue de 0,68mmHg (IC95% - 0,68 a 1,95,) y no resultó significativa. Se observó error sistemático positivo (PCO2 > ETCO2) en 2 de las unidades mientras que en la tercera la diferencia fue negativa (PCO2 < ETCO2)
DiscusiónLa correlación entre ETCO y PCO2 es significativa, si bien los valores obtenidos no resultan equivalentes y la diferencia varía entre 0,1mmHg a 20mmHg. Asimismo, observamos errores sistemáticos de signo diferente (positivo o negativo) entre las instituciones.

Monitoring of the arterial partial pressure of carbon dioxide (PaCO2) in ill newborns, especially those who require ventilation, is important to optimise patient management and prevent complications, since both hypocapnia and hypercapnia are known contributors to periventricular leukomalacia,1,2 intracranial haemorrhage3 and bronchopulmonary dysplasia.3,4 At the same time, fluctuations in PaCO2 are associated with poorer neurodevelopmental outcomes.5
While arterial blood gas analysis is the gold standard for PaCO2 monitoring, it requires a painful collection procedure, is expensive and can lead to iatrogenic anaemia6 due to repeated collection of samples, thereby increasing the need of transfusion, while only providing information on discrete timepoints.
A possible alternative is transcutaneous monitoring of the partial pressure of CO2 (TcCO2), but using this method in young children is complicated due to the immaturity of the skin, the need of repeated calibration and the risk of burns and infections,7,8 leaving aside that it is not available in most neonatal intensive care units (NICUs) in Spain.
End-tidal CO2 (ETCO2) monitoring is a useful alternative. This method has been applied widely in the fields of surgery and anaesthesia in adult and paediatric patients, where it is used to help confirm the correct positioning of endotracheal tubes and to monitor ventilation and cardiopulmonary status in patients.9–11 However, its use in the NICU setting or the delivery room in infants requiring resuscitation has been scarce, probably due to the inconsistent evidence on the correlation between the ETCO2 and the PaCO2 in newborns and how the severity of pulmonary illness may affect this correlation.12–16
The gradient between the ETCO2 and the PaCO2 may be affected by the severity of respiratory impairment, but this aspect has not been adequately assessed in ventilated infants.17,18
Volumetric capnography can be used to estimate the physiological dead space in adults. Using a modified version of the Bohr formula, it is possible to assess the correlation between the calculated dead space (VD) and the tidal volume (Vt),18 both inspiratory and expiratory. In adults, the normal range for the dead space to tidal volume ratio (VD/Vt) has been established at 020 to 035. In adult patients with acute lung injury, this ratio increases to 044–055, which is associated with a high mortality.19 Unfortunately, the possibilities offered by this approach are still limited in newborn infants. The technical problems caused by the apparatus dead space, response times and endotracheal tube leaks are evident limitations in newborn infants, especially those born preterm with very low birth weights.20
Although the correlation between arterial blood gas analysis and non-invasive methods has been studied in newborns, the results reported in the scientific literature have been contradictory and very heterogeneous.21 Notwithstanding, the current evidence is promising and may contribute valuable information for future studies, which will be necessary to establish non-invasive methods as a reliable and feasible alternative to arterial blood gas analysis.
The primary objective of our study was to assess and report the correlation between the ETCO2 and the partial CO2 pressure (PCO2) in newborns requiring mechanical ventilation in 3 neonatal intensive care units in Argentina.
Material and methodsWe conducted a cross-sectional comparative study of 2 PCO2 measuring methods: conventional measurement by blood gas analysis in blood samples and estimation by ETCO2.
The sample consisted of newborns admitted to the NICUs of the Clínica Universitaria Reina Fabiola, Clínica y Maternidad CERHU and Hospital Provincial de Rosario between August 2019 and July 2020 that required conventional mechanical ventilation and/or manual ventilation through an endotracheal tube, with no limitations to inclusion based on birth weight, gestational age or postnatal age. We excluded newborns managed with high-frequency ventilation.
We obtained a convenience sample that was partly determined by the availability of ETCO2 monitoring devices in each unit.
End-tidal CO2 monitoring was performed with a TECME Graph Net neo neonatal ventilator (Córdoba, Argentina) with an integrated mainstream dual wavelength end-tidal CO2 sensor (Respironics Capnostat 5).
The PCO2 was measured in samples of arterial blood (PaCO2), capillary blood (PcCO2) or venous blood (PvCO2), collected according to the judgment of the physician in charge of the patient. In this observational study, samples were not ever collected for research purposes, and we only included measurements for samples obtained in the context of clinical care.
To standardise the sample collection procedure, all staff members who performed this task in each unit were given specific directions on how to collect the samples and submit them to the laboratory for processing.
The blood gas analysis procedure depended on the equipment available in the laboratories of each hospital: Cobas b 121 (Roche), Cobas b 221 (Roche) and Epoc Reader (Epocal).
After collecting the blood sample ordered in each case, the ETCO2 was recorded and compared with the value obtained in the laboratory (arterial, venous or capillary PCO2) to calculate the ETCO2-PCO2 gradient.
Although the units of analysis were the comparative measurements, variables related to the infant, the infant’s condition and the type of blood sample were also documented in each case. We recorded the birth weight, gestational age (GA), postnatal age, illness that required mechanical ventilation, fraction of inspired oxygen (FiO2) and site of blood extraction.
Carbon dioxide measurements obtained with the ETCO2 monitor were not used in clinical decision-making.
In the descriptive analysis, we calculated measures of central tendency and dispersion, including the range, mean, median, mode, standard deviation (SD), proportions or percentages and confidence intervals (CIs). Comparisons were made using analysis of variance (ANOVA), the Student t test and the χ2 test with the Fisher and Yates correction, as applicable, having assessed the normality of the distribution in every case using graphical and statistical methods (Kolmogorov–Smirnov test). We calculated the Pearson correlation coefficient for the total sample and for the data obtained in each of the 3 participating units. In addition, we generated Bland–Altman plots to estimate the concordance between the measurement methods and calculated the measurement bias. The statistical analysis was performed with the InfoStat software (Universidad Nacional de Córdoba, Argentina) and the level of significance was 5% in every test.
The study was approved by the research ethics committees of each participating institution, and since it did not require modifying the care of the newborns and ETCO2 monitoring is a standard non-invasive method used in intensive care, the respective ethics committees determined that the study was exempt from informed consent.
All the procedures adhered to good clinical research practice in humans, the Declaration of Helsinki and the corresponding provincial laws. Confidentiality was safeguarded in accordance with the Personal Data Protection Act (25326/2000).
ResultsWe analysed 277 comparative samples (ETCO2/PCO2) in 83 newborns.
The mean weight of the assessed newborns was 2017g (SD, 853g; range, 660−4220g) and the mean GA was 32 weeks (SD, 4). The sex distribution of the sample was 52.4% male and 47.6% female.
Table 1 presents the distribution of patients and samples per centre (centres identified as A, B and C).
Table 2 compares the 3 institutions in terms of GA, birth weight, the frequency of FiO2 values under 30% and the site of blood extraction, showing that the GAs and birth weights of the newborns were greater in centre B, while the frequency of arterial blood samples was higher in centre C. We found no significant differences in the need of supplemental oxygen when we compared the measurements in the 3 centres.
Characteristics of the infants and samples (n) by centre.
| Centre A | Centre B | Centre C | ||||
|---|---|---|---|---|---|---|
| n | % | n | % | n | % | |
| GA>32wk | 23 | 45.1 | 90 | 80.4 | 63 | 55.3 |
| Birth weight >1500g | 31 | 60.7 | 95 | 84.8 | 68 | 59.6 |
| FiO2 > 30% | 15 | 29.4 | 28 | 25.0 | 30 | 26.3 |
| Arterial blood sample | 16 | 31.4 | 22 | 19.6 | 87 | 76.3 |
FiO2, fraction of inspired oxygen; GA, gestational age; wk, week.
The most frequent diagnosis during the measurements was respiratory distress syndrome (RDS), documented in 60% of the cases (166 observations).
The mean ETCO2 and PCO2 values were 41.36mmHg and 42.04mmHg, respectively (Table 3).
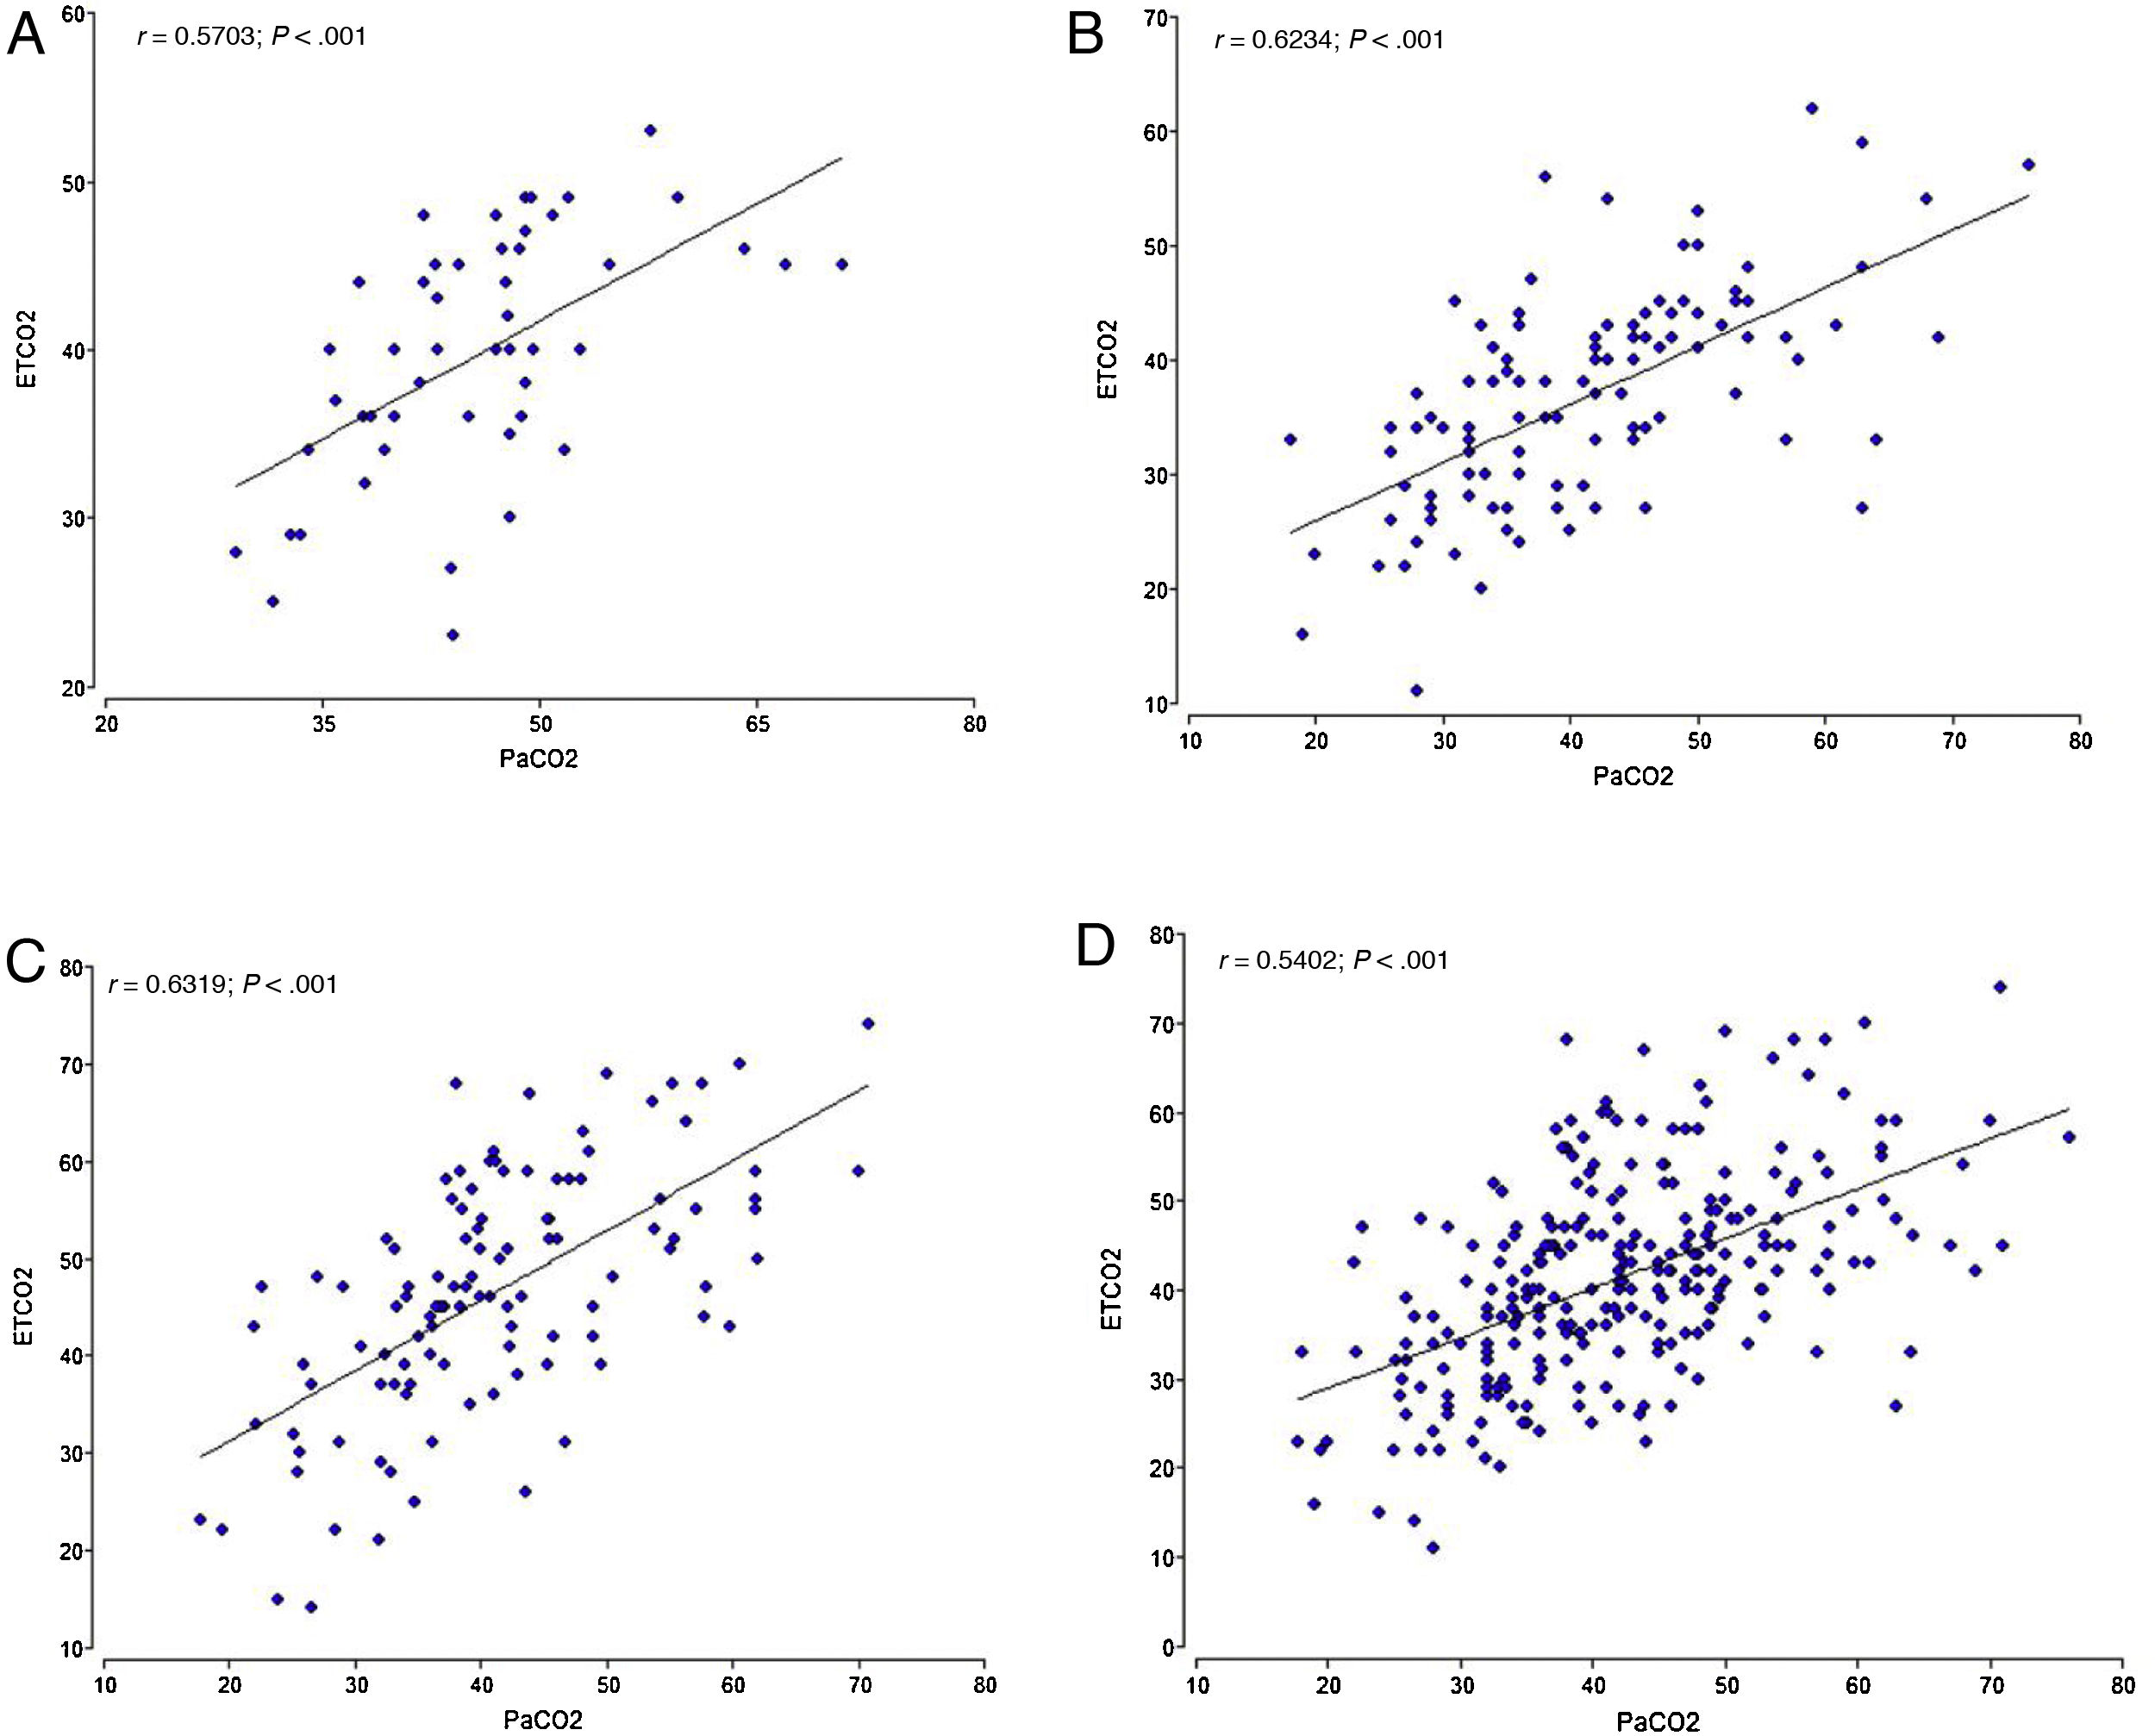
We found a significant positive correlation between the ETCO2 and PCO2 in both the overall analysis of the samples, with a correlation coefficient of 0.5402 (P<.001), and the analysis of the samples of each of the 3 institutions (P<.001). The highest correlation coefficient corresponded to centre C (r=0.6319), followed by centre B (r=0.6234) and centre A (r=0.5703) (Fig. 1).
 and for the overall sample (D).")
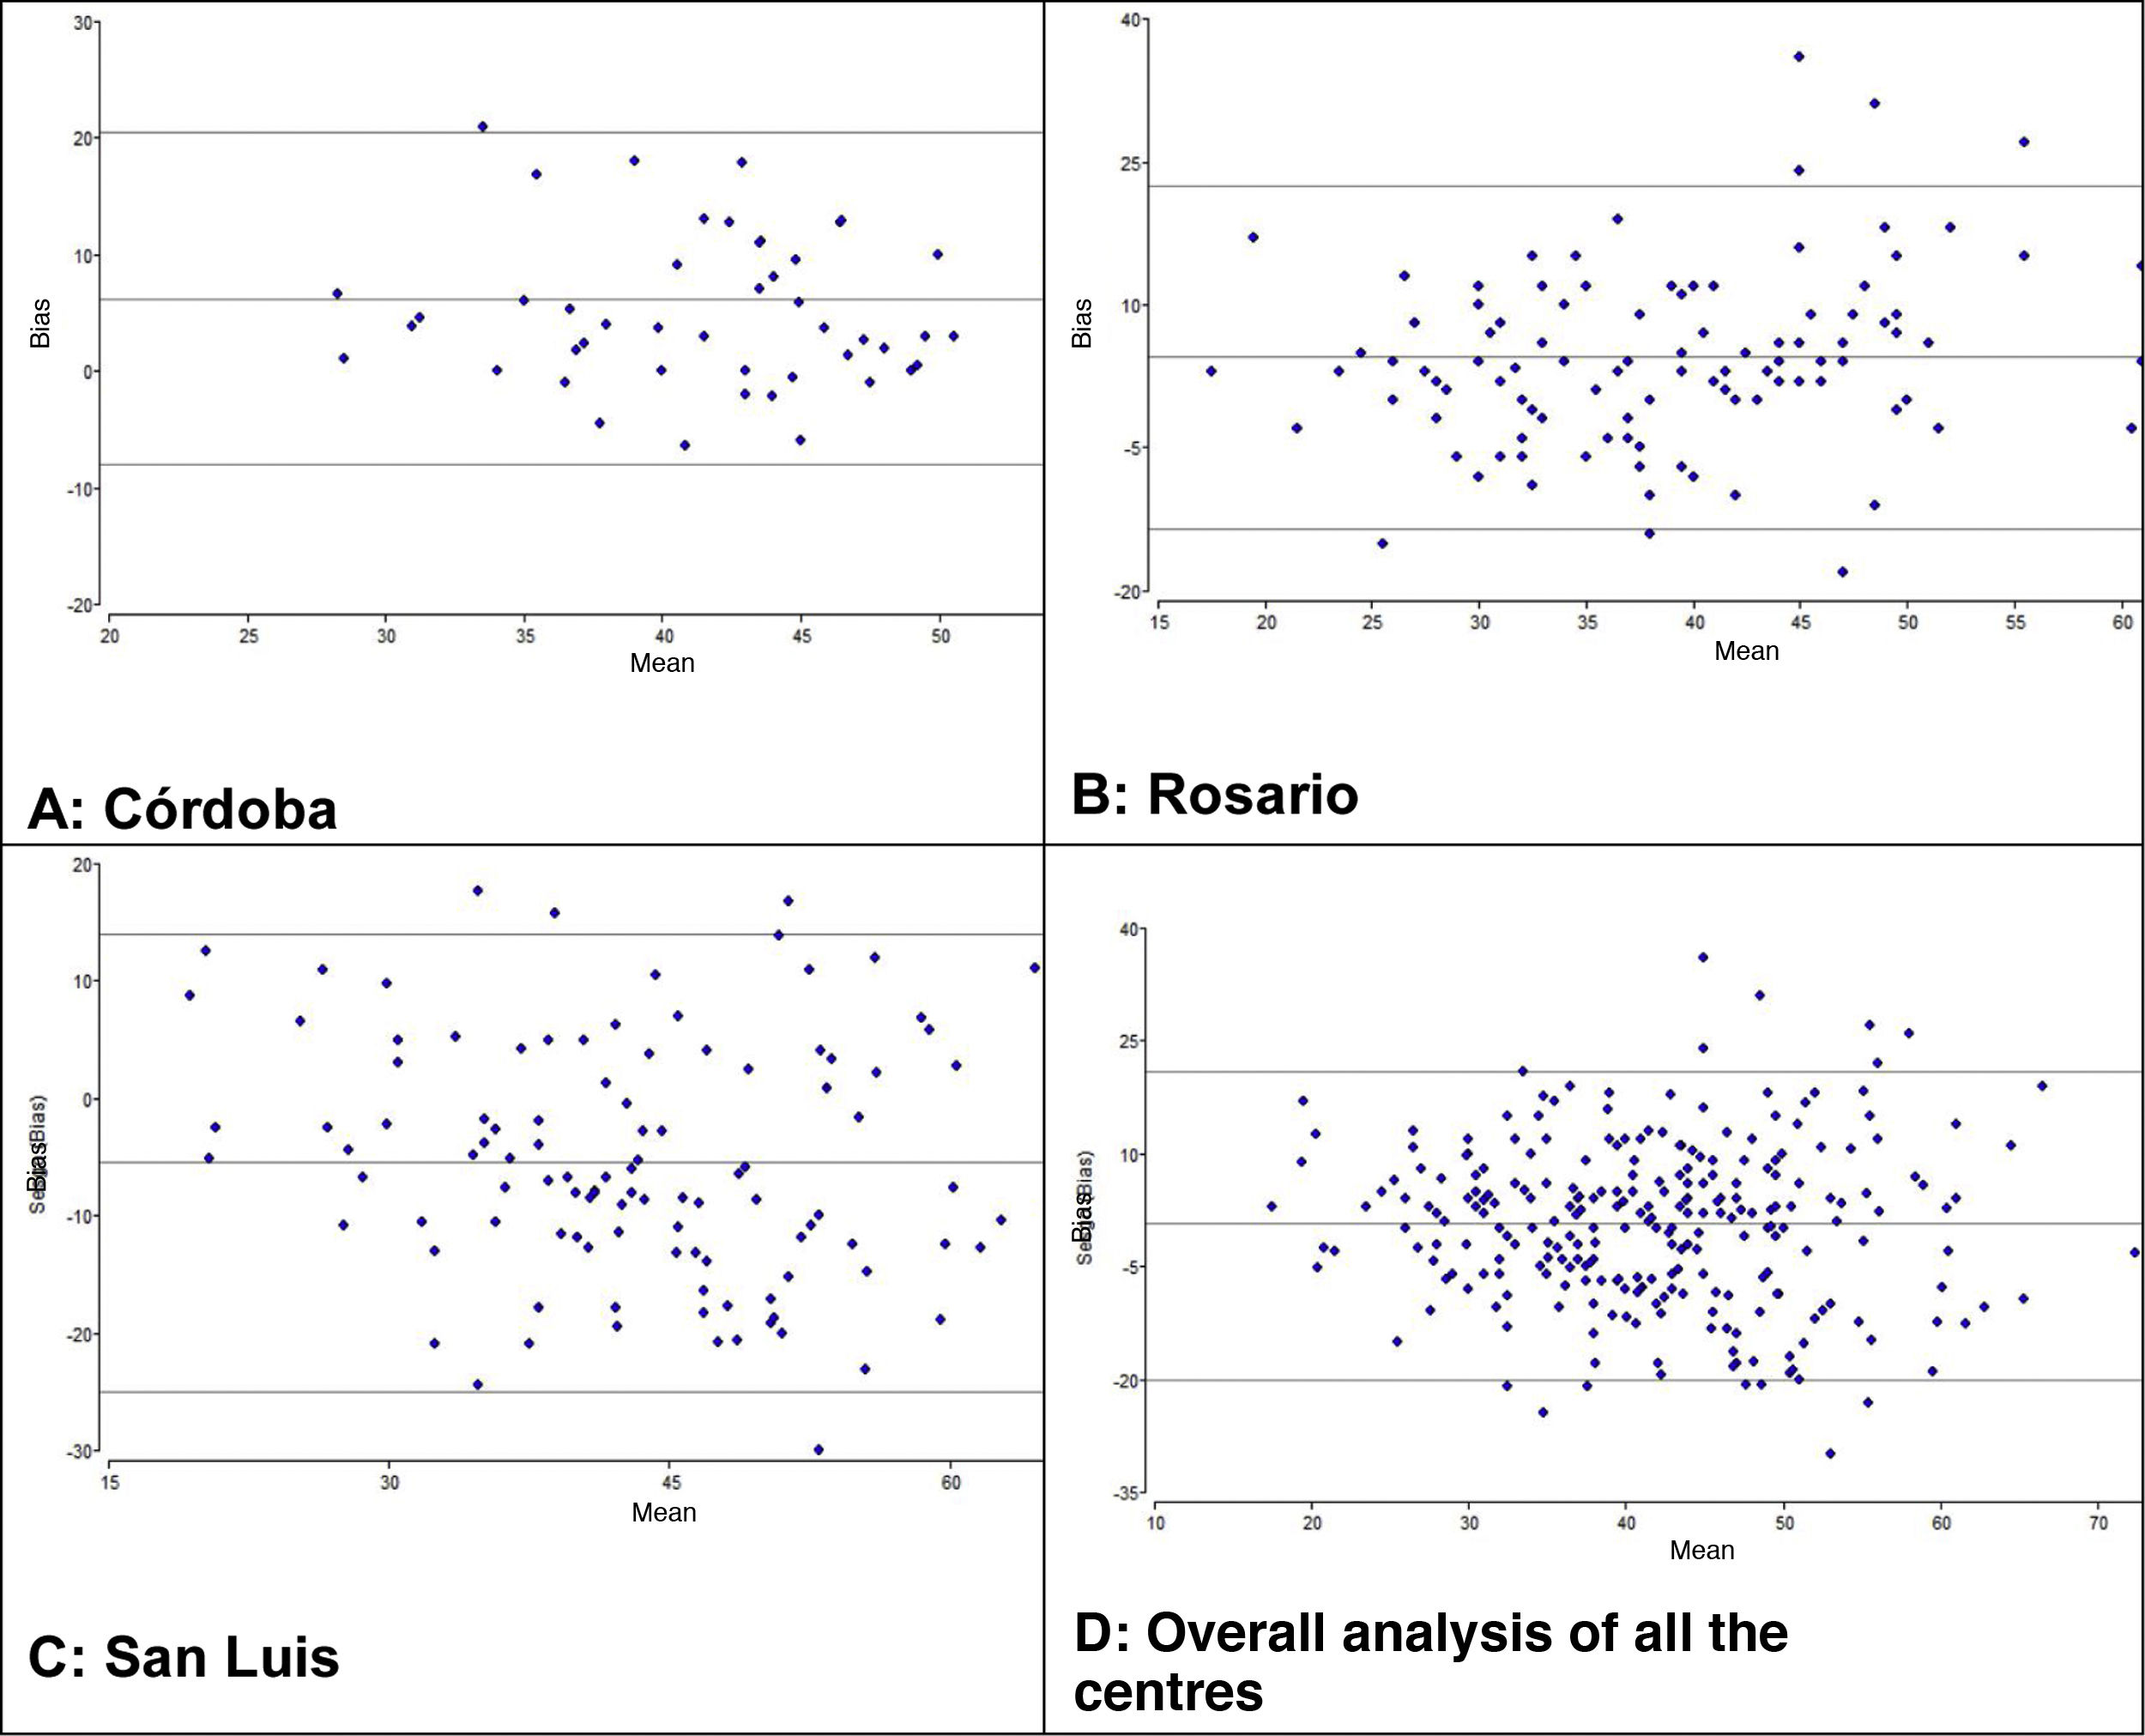
We used the Bland-Altman method to assess the concordance between the PCO2 and ETCO2 values (Fig. 2). For the overall sample, the mean difference was of 0.68mmHg with a 95% CI of –0.68 to 1.95, meaning that it was not significant (P=.289). However, when we analysed the samples of each institution separately, we did find some differences: in centres A and B, we found a positive difference or systematic error (PCO2 > ETCO2), and in centre C a negative difference or systematic error (PCO2 < ETCO2). Table 4 presents the differences between the PCO2 and ETCO2 values with the respective 95% CIs for each institution and in the overall sample.
 and for the overall sample (D).")
Mean difference, standard deviation and confidence interval in the measurement of CO2 (PCO2 vs ETCO2).
| Difference between PCO2 and ETCO2 | |||||
|---|---|---|---|---|---|
| mean | standard deviation | 95% CI, LL | IC 95%, UL | P | |
| Centre A | 6.14 | 7.41 | 4.06 | 8.22 | <.001 |
| Centre B | 4.49 | 9.21 | 2.73 | 6.24 | <.001 |
| Centre C | −5.42 | 10.06 | −7.29 | −3.54 | <.001 |
| Global | 0.68 | 10.6 | −0.68 | 1.95 | .2892 |
CI, confidence interval; ETCO2, end-tidal carbon dioxide; LL, lower limit; PCO2, partial pressure of carbon dioxide; UL, upper limit.
Lastly, for each unit, we calculated the frequency of values without differences or bias (PCO2=ETCO2) and the frequency of negative bias (PCO2 < ETCO2) or positive bias (PCO2 > ETCO2) based on the magnitude of the values and analysed in intervals that we established arbitrarily. Table 5 presents these results. In centres A and B, the percentages of ETCO2 values that exceeded the PCO2 values were 16% and 35%, respectively, but in centre C these differences were found in 70% of the observations. With a different approach, if we considered measurement differences of less than 5mmHg, only 103 of the 277 observations (37%) would be in the acceptable difference range.
Distribution of differences between PCO2 and ETCO2 values in participating centres.
| Difference between values | Centre A, 51 samples | Centre B, 112 samples | Centre C, 114 samples | |
|---|---|---|---|---|
| PCO2 < ETCO2 | < −20mmHg | 0 | 1 (1%) | 7 (6%) |
| from –10.1 to –20mmHg | 0 | 9 (8%) | 31 (27%) | |
| from –5.1 to –10 mmHg | 2 (4%) | 13 (12%) | 27 (24%) | |
| from –0.1 to –5mmHg | 6 (12%) | 16 (15%) | 15 (13%) | |
| Total | 8 (16%) | 39 (35%) | 80 (70%) | |
| PaCO2=ETCO2 | 0 | 3 (6%) | 8 (7%) | 0 |
| PCO2 > ETCO2 | from 0.1 to 5mmHg | 17 (33%) | 26 | 12 |
| from 5.1 to 10 mmHg | 9 (18%) | 17 | 8 | |
| from 10.1 to 20mmHg | 11 (21%) | 19 | 9 | |
| > 20 | 3 (6%) | 3 | 0.9 | |
| Total | 40 (78%) | 65 (58%) | 34 (30%) |
In a preliminary analysis, we explored the effect of gestational age, birth weight and the site of blood extraction (arterial vs capillary or venous) on the association between the PCO2 and the ETCO2.
We found a weaker correlation in infants born at or before 32 weeks of gestation (r=0.5445) compared to those born after 32 weeks (r=05681); there were no significant differences based on birth weight.
The correlation was also stronger in infants with a FiO2 of 30% or greater (r=0.6100) compared to those with a FiO2 of less than 30% (r=0.5533), although both were statistically significant (P=.0177). When it came to the effect of CO2 values on the correlation, we did not find statistically significant differences when we separated the observations into those with CO2 values of less than 45mmHg or equal or greater than 45mmHg. We also found that the site of extraction had a significant effect on the strength of the correlation (P<.0001), with a stronger correlation in the group of arterial samples (r=0.6471) compared to the group of venous or capillary samples (r=0.5684).
DiscussionOur findings, like other studies in the past, found a significant correlation between the ETCO2 and the PCO2. The correlation coefficients obtained in the 3 units under study (r=0.54) were somewhat lower compared to the previous literature, in which reported values have ranged from 0.70 to 0.80.21–24 Most recent reviews highlight the broad heterogeneity of the published results.25,26
In our multicentre study, we found that the correlation between the ETCO2 and the PCO2 differed between centres. The concordance analyses found positive biases in 2 centres and a negative bias in the other. While we cannot ascertain the cause of these variations, they could be due to the equipment used to process blood samples or the greater percentage of arterial blood samples in the San Luis centre. There is evidence that the type of sample affects the correlation,27 and in our study, 68% and 80% of the samples in the 2 institutions with a positive bias were venous or capillary blood samples.
The only parameter of severity or greater respiratory compromise that we analysed in our sample was requiring a FiO2 of 30% or greater. In this regard, the correlation observed in infants with FiO2 of 30% or greater was slightly stronger, contrary to what has been previously described.27 We did not find variations in the strength of the correlation based on CO2 values.
Beyond our findings and their statistical significance, the question we may want to ask from a clinical standpoint is whether it is possible to rely on ETCO2 values as safe estimates of laboratory PCO2 values to adequately guide clinical decision-making in ventilated newborns, thus preventing hypocapnia and hypercapnia without the need of frequent blood extractions. In this sense, it was staggering to find that the values, at least in isolated measurements, were rarely equivalent, and that the difference between the two could range from 0.1mmHg to more than 20mmHg. However, in this study we did not analyse trends in serial values in each individual newborn, which could be useful in clinical practice by evincing a decrease or increase of the values relative to the baseline.
The PaCO2 is an important parameter in critically ill and ventilated patients. The current alternatives available to reduce the number of invasive procedures or to monitor PaCO2 more continuously are capnography or transcutaneous monitoring. Each of them have advantages and limitations. Capnography provides a measurement of PCO2 at the end of expiration and has the advantage of being non-invasive and allowing continuous monitoring, although in patients with pulmonary illness it can often diverge, as occurred in our study. Transcutaneous PCO2 measurement can be reliable, but its use is limited due to the damage to the skin of newborns resulting from the heat.
There are limitations to our study due to the limited number of isolated observations made in 3 neonatal units. Nevertheless, it contributes new data to add to the contributions of previous authors and warns of the possibility of unpredictable variations, as observed in the participating centres, between which the correlations of the values obtained by the two methods differed. This may suggest that, for the time being, each centre should validate the use of these monitors before assuming that correlation values found in other studies apply to their units. It also underscores the need to continue exploring or identifying the causes of these variations.
Additional studies are still required to establish non-invasive methods as a reliable and feasible alternative to arterial blood gas analysis. Investing in new technologies that allow informed clinical decision-making and improve safety in the care of critically ill newborns also continues to be crucial.
FundingThe study was supported and funded by the Sociedad Iberoamericana de Neonatología SIBEN. It did not receive any other subsidies or grants.
Conflicts of interestThe authors have no conflicts of interest to declare.