


Interhospital transport is crucial for ensuring access to specialized care and poses a logistic and clinical challenge that impacts patient safety and resource management. Few tools are available to predict risks in pediatric transport (PT), so a triage scale could help optimize and standardize resources.
ObjectivesTo analyze the diagnostic accuracy of urgent interhospital transport team selection by health care professionals compared to the use of SCOPETAS, the adapted version Pediatric Transport Triage Tool (PT3), and to assess the agreement between the choices of professionals and those proposed by the scale.
MethodObservational cohort study to evaluate the accuracy of the SCOPETAS scale and the agreement between the actual transport team and the one recommended by the scale, considered the gold standard. We analyzed urgent PT cases (aged 1 month to 14 years) from four regional hospitals to the referral hospital over a one-year period.
ResultsThe study included a total of 150 PT cases. The weighted kappa for the agreement in team selection was 0.68 (P < .001), with greater discordance in the choice of emergency medical technician (EMT) + nursing teams. The weight of evidence (WoE) for selecting advanced and basic life support was 10.1 dB and 7.54 dB, respectively, compared to 3.93 dB and 3.11 dB for EMT and EMT + nursing teams, respectively. The application of SCOPETAS would have reduced costs and optimized staff availability.
ConclusionsSCOPETAS is a useful and easy-to-apply tool that standardizes PT and optimizes resources. Future research should cover all pediatric age groups and other regions.
El transporte interhospitalario es crucial para garantizar el acceso a atención especializada, representando un reto logístico y clínico con impacto en la seguridad del paciente y el uso de recursos. Existen pocas herramientas para predecir riesgos en el transporte pediátrico (TP), por lo que una escala de triaje podría optimizar y estandarizar recursos.
ObjetivoAnalizar la exactitud diagnóstica de selección del equipo de TP interhospitalario urgente de los profesionales respecto de la escala PT3 adaptada (Score pediátrico de transporte, SCOPETAS) y estudiar la concordancia de su elección con la propuesta por la escala.
MétodoEstudio observacional analítico de una cohorte para evaluar la exactitud de la escala SCOPETAS y la concordancia entre el equipo real y el recomendado por la escala, considerada patrón de oro. Durante un año, se analizaron los TP urgentes (de pacientes entre 1 mes y 14 años) desde 4 hospitales periféricos al hospital de referencia.
ResultadosSe incluyeron 150 T P. La concordancia en la selección del equipo de traslado presentó una kappa ponderada de 0,68 (p < 0,001), con mayor discordancia en la elección del equipo técnico de emergencias sanitarias (TES)+enfermería. El peso de la evidencia (WoE) para la elección de soporte vital avanzado y básico fue de 10,1 y 7,54 dB; para TES y TES+enfermería, 3,93 y 3,11 dB respectivamente. La aplicación de SCOPETAS habría reducido costes y optimizado la disponibilidad de personal.
ConclusionesSCOPETAS es una herramienta útil y fácil de aplicar, que estandariza el TP, y optimiza recursos. Futuras investigaciones deberían abarcar todas las edades pediátricas y otras regiones.

The interhospital transport (IHT) of critically ill pediatric patients is a complex practice that involves multiple factors, such as the clinical stability of the patient, the distance between the centers and the availability of specialized teams. In this context, the appropriate selection of resources is key to minimize risk1,2 and ensure optimal care during transport.
At present, there is substantial heterogeneity in pediatric transport (PedT); the specialization in the stabilization and transport of pediatric and neonatal patients is not uniform, and each country or health care administration applies different models in organizing these services.3–7 Transport by a specialized team improves the quality of transport and increases patient safety.8–11 In many areas in Spain, including the area where this study was conducted, pediatric IHT is mostly conducted by teams specialized in adult transport, with teams varying in their composition and their level of specialization in pediatric care.
Adequate transport planning, including a clinical assessment of the child, communication between the centers and the transport team and consideration of the currently available resources, is essential to guarantee efficient IHT.
When it comes to adult patients, a system for assessing patients for secondary transport (SVPTS, Sistema de Valoración de Pacientes para el Transporte Secundario)12 has been developed that helps determine the resources that will be needed during transport (human resources and type of vehicle), anticipating possible complications and adjusting support accordingly.12–14 This tool has been found to reduce the incidence of complications during transport, improve decisions regarding patient disposition on arrival to the receiving hospital, thus decreasing admissions to the intensive care unit15 and optimize the use of health care resources and the time that specialized steams are operational (uptime)16 while reducing costs.17
In the field of pediatrics, there are several tools used to predict the risk of mortality, such as the Pediatric Risk of Mortality (PRISM) III18 or the risk during IHT, such as the Pediatric Canadian Triage and Acuity Scale (PedCTAS), the Transport Pediatric Early Warning Score (TPEWS) or the Transport Risk Assessment in Pediatrics (TRAP), which are strongly associated with admission to pediatric intensive care units.19–21 However, to our knowledge, only two tools have been developed to specifically guide and plan pediatric IHT: one is an adaptation of the SVPTS22 that categorizes respiratory distress based on age and classifies preterm infants by weight, and the other is the Pediatric Transport Triage Tool23 (PT3).
The PT3 was developed to provide an objective assessment tool to guide the selection of the appropriate PedT team composition based on patient severity and available human resources. It is structured in three parts:
- –
Neurologic, Cardiovascular and Respiratory (NCR) systems: numerical scale (0−9) based on the TPEWS,21 which in turn was developed from the PEWS scale, originally designed to predict the risk of intrahospital clinical deterioration, specifically adapting it for PedT.
- –
Significant Diagnoses List: list of relevant diagnoses that require more specialized transport due to the risk of clinical deterioration during transport.
- –
Scoring algorithm for transport team and mode selection: based on the results of the previous sections and taking into account the available human resources (paramedics, nurses and physicians/fellows) where the tool was developed (Maryland, USA).
The introduction of this scale enabled the standardization of the selection of team composition for PedT and reduce heterogeneity in a context in which there is a broad spectrum of expertise. The use of nursing staff was significantly reduced without compromising the safety of transported patients (no increase in adverse events). There was also a direct cost reduction of $608 000 per year (5%-8%) on account of the reductions in air transport and nursing staff.
Despite the proven utility of the PT3 in guiding decision-making, its direct application in Spain may be limited due to the differences in transport team composition. For instance, the availability of professionals such as fellows for PedT (a figure that does not exist in Spain), or the fact that paramedics in the United States have different competencies or scopes of practice (specific specialization in pediatric transport, certification in out-of-hospital intubation,23 etc) compared to transport technicians in the area where we conducted our study.
We hypothesized that the introduction in our area of an adapted version of the PT3 would help standardize decisions regarding team composition in settings in which there can be variation in pediatric care teams, thereby optimizing the use of resources.
The aim of our study was to assess the performance of health care professionals in selecting resources for urgent pediatric IHT in a region of Spain and estimate its agreement with the ideal team composition based on the adapted version of the PT3.
Material and methodsWe conducted an observational and analytical cohort study to evaluate a diagnostic test (the adapted PT3 or Score pediátrico de transporte de Asturias [SCOPETAS]) and concordance. It was a multicenter study in a region in Spain that encompasses eight health care areas, with a total population of 1 005 283 inhabitants, of who 94 440 are younger than 14 years.24 We included four sending hospitals (SHs) with a cumulative catchment population of 51 396 children aged 1 month to 14 years24 as well as the receiving referral hospital (RH). None of the including SHs had a pediatric intensive care unit or pediatric surgery services, and all had at least one pediatric care specialist on site around the clock. The distance from the SHs to the RH ranged from 19.4 to 33 km. Appendix B of the supplemental material presents the characteristics of each SH.
We included patients aged from 1 month to 14 years managed in the SHs who required urgent IHT to the RH, excluding those transferred to the neonatal unit, scheduled transports and return transports. The study was conducted over a one-year period (March 15, 2023 to March 31, 2024).
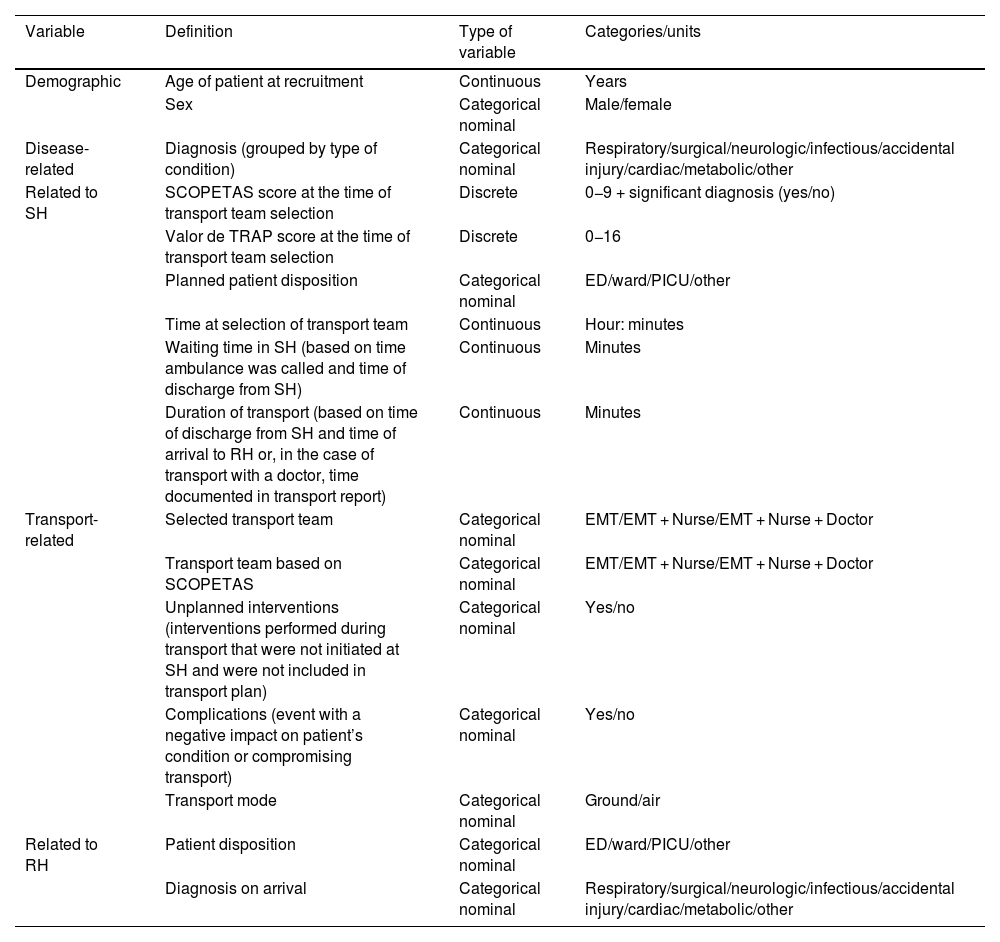
To calculate the sample size, since there were no similar previous studies analyzing concordance, we assumed a moderate level of agreement (kappa of 0.4−0.6) for an α level of 0.05 and a statistical power of 80%. We estimated the probabilities for each of the possible team composition answer choices based on known data for the region where we conducted the study published by C Molinos in 2006,25 which yielded a minimum sample size of 83 transports. Table 1 presents the variables analyzed in the study.
Study variables.
| Variable | Definition | Type of variable | Categories/units |
|---|---|---|---|
| Demographic | Age of patient at recruitment | Continuous | Years |
| Sex | Categorical nominal | Male/female | |
| Disease-related | Diagnosis (grouped by type of condition) | Categorical nominal | Respiratory/surgical/neurologic/infectious/accidental injury/cardiac/metabolic/other |
| Related to SH | SCOPETAS score at the time of transport team selection | Discrete | 0−9 + significant diagnosis (yes/no) |
| Valor de TRAP score at the time of transport team selection | Discrete | 0−16 | |
| Planned patient disposition | Categorical nominal | ED/ward/PICU/other | |
| Time at selection of transport team | Continuous | Hour: minutes | |
| Waiting time in SH (based on time ambulance was called and time of discharge from SH) | Continuous | Minutes | |
| Duration of transport (based on time of discharge from SH and time of arrival to RH or, in the case of transport with a doctor, time documented in transport report) | Continuous | Minutes | |
| Transport-related | Selected transport team | Categorical nominal | EMT/EMT + Nurse/EMT + Nurse + Doctor |
| Transport team based on SCOPETAS | Categorical nominal | EMT/EMT + Nurse/EMT + Nurse + Doctor | |
| Unplanned interventions (interventions performed during transport that were not initiated at SH and were not included in transport plan) | Categorical nominal | Yes/no | |
| Complications (event with a negative impact on patient’s condition or compromising transport) | Categorical nominal | Yes/no | |
| Transport mode | Categorical nominal | Ground/air | |
| Related to RH | Patient disposition | Categorical nominal | ED/ward/PICU/other |
| Diagnosis on arrival | Categorical nominal | Respiratory/surgical/neurologic/infectious/accidental injury/cardiac/metabolic/other |
Abbreviations: ED, emergency department; EMT, emergency medical technician; PICU, pediatric intensive care unit; RH, receiving hospital; SCOPETAS, Score Pediátrico de Transporte en Asturias; SH, sending hospital; TRAP, Transport Risk Assessment in Pediatrics.
The dependent variables considered most relevant were the interventions needed and complications during transport. The potential confounders included the availability of resources at the time of transport, geographical distance, lack of training in the use of the scale and variability in interhospital transport practices.
The reason to include the TRAP score20 as a weight variable was its validated and recognized capacity to stratify clinical risk without the need of diagnostic tests, as this score has not been studied in our region. In addition, in the analysis of the weight of evidence (WoE), basic life support (BLS) was defined as a transport team composed by an emergency medical technician (EMT) or an EMT plus a nurse, and advanced life support as a transport team that included a physician.
The reference standard used for calculating the WoE was the transport team composition dictated by the adapted scale (gold standard variable) and the test variable was the actual transport team selected by health care professionals. However, since no gold standard previously validated in our region is available to date to determine the optimal composition of the transport team, we were unable to perform an analysis to validate the SCOPETAS scale.
Study protocol (Fig. 1)Phase I: Adaptation of the scale and analysis of interrater reliability
- –
Objectives: to adapt the PT3 to the human resources available in our region and evaluate comprehensibility and reproducibility among health care professionals (Fig. 1)
- –
Methods: two translators translated the PT3 to Spanish independently and then reached consensus on a single translated version, and the possible compositions of the transport team were adapted to match the available local resources by a committee of experts in PedT of the area.
- –
Assessment of reliability and comprehension of the scale: two hypothetical scenarios were presented using audiovisual materials to 10 health care professionals that were not involved in the study, who selected the human resources for transport to the referral hospital using the SCOPETAS scale. Subsequently, we analyzed the agreement between their choices. The material used for this evaluation can be consulted in Appendix B 2 of the supplemental material.

Phase II: Recruitment of real-world patients and data analysis
- –
Objective: to assess agreement and the WoE in real-world pediatric patient transports.
- –
Methods: we collected data on patients included sequentially as they required urgent transport to the referral hospital. The data were collected in a notebook divided in two parts:
▪Pre-transport: completed by the physician in charge at the SH at the time of deciding on the type of transport, without knowing the transport recommendations obtained with SCOPETAS for variables concerning the SH.
▪Post-transport: transport-related data documented by the transport team and data concerning the RH documented by the provider at the RH.
- –
Subsequently, the principal investigator, blinded to the choices made by the professionals, determined the ideal team composition based on the SCOPETAS scale using the data collected in the notebook.
- –
Evaluation: we assessed the agreement (weighted kappa) and the WoE for the comparison of the real-world selection of transport team composition (test variable) and the composition recommended by SCOPETAS (gold standard). We did not analyze a specific outcome variable for the WoE.
The study adhered to all current applicable ethical principles and was approved by the Research Ethics Committee of the autonomous community where it was conducted (reference number 2022.368). We safeguarded the confidentiality of the data by assigning study-specific codes and, since patient data were anonymized, the committee granted a waiver of informed consent.
Statistical analysisThe statistical analyses were performed using the software packages IBM SPSS version 21 and R version 4.3.3. We assessed the normality of the data and conducted a descriptive analysis of the study variables. Quantitative variables were expressed as mean and standard deviation if the data fitted a normal distribution and otherwise as median and interquartile range (IQR). Qualitative variables were summarized as absolute frequencies and percentages. We used the Kruskal-Wallis test to compare nonparametric variables in three or more groups.
To analyze factors associated with the responses to clinical cases, we used backward stepwise regression with the Akaike information criterion (AIC), expressing the results as odds ratios (ORs) and 95% confidence intervals (CIs). In this model, the independent variables were age, sex and type of transport team, and the dependent variable was the disagreement between the transport team actually selected by professionals and the transport team determined by the SCOPETAS scale. We defined statistical significance as a P value of less than 0.05.
Diagnosis accuracy was assessed using contingency tables, and the probability of correctness for each decision was calculated. The analysis was completed by calculating sensitivity, specificity, likelihood ratios (LR), and WoE expressed in decibans (where 10 dB indicates that the working hypothesis is 10 times more likely than the alternative hypothesis according to the observed evidence), with their respective 95% CIs.
To analyze the reliability of the SCOPETAS scale, we calculated the kappa coefficient in the initial inter-rater agreement test with theoretical patients.
In real patients, we used the quadratic weighted kappa, since the cost of a transport with an EMT and nurse is approximately double that of a transport with an EMT alone, while the cost of a transport that also includes a doctor is approximately double that of transport with an EMT and nurse.
Cost analysisWe conducted a simple analysis of direct costs to estimate the economic impact of the application of the SCOPETAS scale based on the used type of resource. To do this, we calculated the unit cost per transport according to the type of transport team based on the contract for nursing, medical, and EMT professionals,26 assuming an approximate duration of team mobilization per PedT of 2 hours and excluding mileage. We multiplied these costs were multiplied by the number of transports made in each team composition category to obtain the total cost for the period under study.
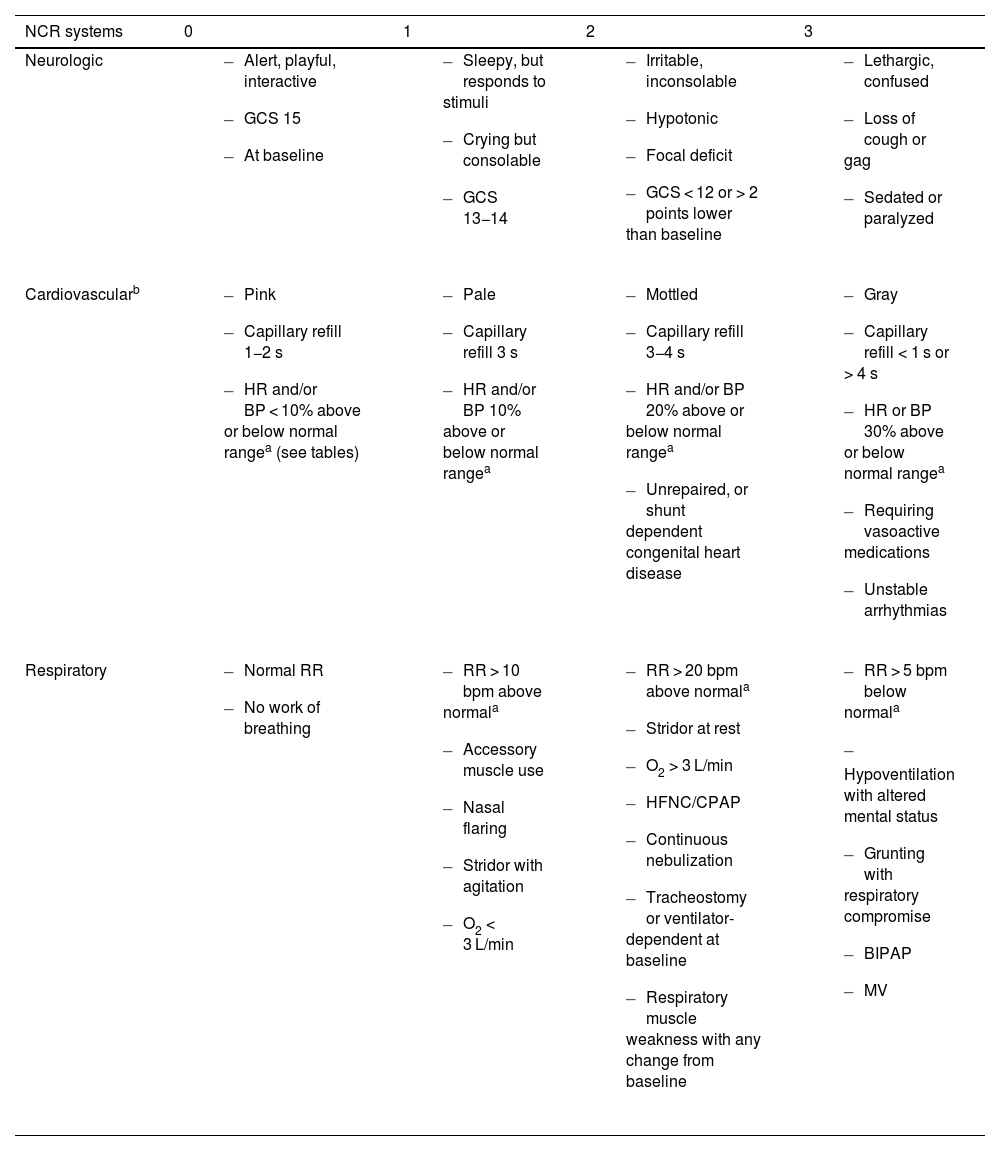
ResultsThe adapted scale was named Score Pediátrico de Transporte de Asturias (SCOPETAS, pediatric transport score of Asturias, Table 2), after making the pertinent changes to the possible transport teams.
SCOPETAS scale.
| NCR systems | 0 | 1 | 2 | 3 |
|---|---|---|---|---|
| Neurologic |
|
|
|
|
| Cardiovascularb |
|
|
|
|
| Respiratory |
|
|
|
|
| Significant diagnoses | ||||
|---|---|---|---|---|
| Airway | Neurologic | Gastrointestinal | Surgical, Trauma and Burns | Other |
|
|
|
|
|
| Proposed team composition and transport mode | ||
|---|---|---|
| Highest single category score | Total score | Significant diagnosis |
| 3: Doctor + Nurse + EMT. Fastest possible mode | ≥ 3: Doctor + Nurse + EMT ± fastest possible moded | Yes: Doctor + Nurse+ TES ± fastest possible moded |
| 2: Doctor + Nurse + EMT | ||
| 1: Nurse + EMT | 1−2: Nurse + EMT | |
| 0: EMT | 0: EMT | |
Abbreviations: BIPAP, bilevel positive airway pressure; BP, blood pressure; CPAP, continuous positive airway pressure; EMT, emergency medical technician; EOM, extraocular movements; GCS, Glasgow Coma Scale; HFNC, high-flow nasal cannula; HR, heart rate; MV, mechanical ventilation; NCR, neurologic, cardiovascular and respiratory; RR, respiratory rate; SCOPETAS, Score pediátrico de transporte de Asturias (Asturias Pediatric Transport Score); VPS, ventriculoperitoneal shunt.
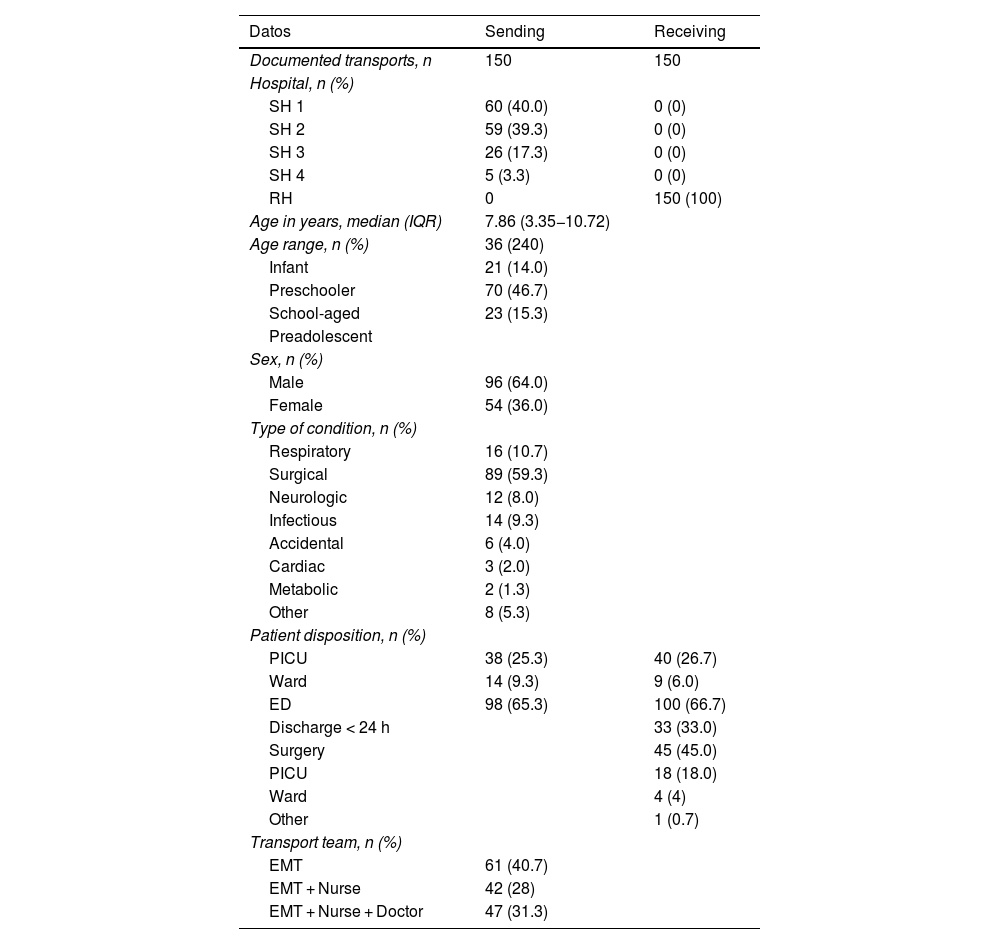
The analysis included 150/247 (60.7%) of the eligible transports from the SHs.
Table 3 presents the epidemiological characteristics of the patients, patient origin, patient disposition, type of disease and other details of the included transports.
Descriptive summary of included patients.
| Datos | Sending | Receiving |
|---|---|---|
| Documented transports, n | 150 | 150 |
| Hospital, n (%) | ||
| SH 1 | 60 (40.0) | 0 (0) |
| SH 2 | 59 (39.3) | 0 (0) |
| SH 3 | 26 (17.3) | 0 (0) |
| SH 4 | 5 (3.3) | 0 (0) |
| RH | 0 | 150 (100) |
| Age in years, median (IQR) | 7.86 (3.35−10.72) | |
| Age range, n (%) | 36 (240) | |
| Infant | 21 (14.0) | |
| Preschooler | 70 (46.7) | |
| School-aged | 23 (15.3) | |
| Preadolescent | ||
| Sex, n (%) | ||
| Male | 96 (64.0) | |
| Female | 54 (36.0) | |
| Type of condition, n (%) | ||
| Respiratory | 16 (10.7) | |
| Surgical | 89 (59.3) | |
| Neurologic | 12 (8.0) | |
| Infectious | 14 (9.3) | |
| Accidental | 6 (4.0) | |
| Cardiac | 3 (2.0) | |
| Metabolic | 2 (1.3) | |
| Other | 8 (5.3) | |
| Patient disposition, n (%) | ||
| PICU | 38 (25.3) | 40 (26.7) |
| Ward | 14 (9.3) | 9 (6.0) |
| ED | 98 (65.3) | 100 (66.7) |
| Discharge < 24 h | 33 (33.0) | |
| Surgery | 45 (45.0) | |
| PICU | 18 (18.0) | |
| Ward | 4 (4) | |
| Other | 1 (0.7) | |
| Transport team, n (%) | ||
| EMT | 61 (40.7) | |
| EMT + Nurse | 42 (28) | |
| EMT + Nurse + Doctor | 47 (31.3) | |
Abbreviations: ED, emergency department; IQR, interquartile range, PICU, pediatric intensive care unit; RH, receiving hospital; SH, sending hospital.
All transports were by ground. The median waiting time at the SH was 60 minutes (IQR, 30–71) and the median duration of transport until arrival to RH was 32 min (IQR, 27–43), with missing data in 35 cases. We did not find significant differences in these times based on transport team composition or the SH, except in the duration of transport from the SH closest to the RH (P = .007). We documented TRAP scores20 (median, 0; IQR, 0–1) and SCOPETAS scores (0; IQR, 0–1) (Table 2). Of the 21 patients with a significant diagnosis in SCOPETAS, 11 scored one or fewer points in the scale; of these patients, four were admitted to the PICU or required close monitoring, six required urgent surgery and five developed complications during transport. Of the complications documented during transport, all were considered adverse events, and there were no events that did not cause harm. The median scores in the TRAP and SCOPETAS scales in patients transported with advanced transport teams (3 [IQR, 0–5] and 3 [IQR, 1–4], respectively) were significantly higher (P < .001). In five patients in whom the initially planned disposition was the ward, the disposition was changed on arrival to the RH based on the judgment of the receiving provider (Table 3): two were monitored in the emergency department, one was managed at the outpatient level and two were admitted to the PICU due to clinical deterioration (the transport team in the latter had included a physician).
There were no unplanned intubations, resuscitation maneuvers or deaths. Five complications were documented: two respiratory complications (increased respiratory effort and increased oxygen requirements), one neurological (decreased level of consciousness), one case of vomit aspiration and one traffic accident. In addition, there were eight interventions outside the original transport plan, all in transports carried out with a physician on the team (administration of unplanned medication, change of noninvasive mechanical ventilation (NIV) interface and switch/adjustment of NIV modality). No changes needed to be made to the transport team after departure from the SH in any case.
The disease group with the greatest severity was the respiratory group (median scores: TRAP, 4 [IQR, 2–5]; SCOPETAS, 3 [IQR, 3−4]; P < .001), which was also the group with the highest frequency of complications and unplanned interventions during transport.
The interrater agreement for theoretical clinical scenarios applying the SCOPETAS corresponded to a kappa value of 1, indicative of a high reliability for transport team selection.
The agreement between the teams selected by professionals and the hypothetical selection obtained through the retrospective application of the SCOPETAS scale corresponded to a weighted kappa of 0.685 (95% CI, 0.582−0.789; P < .001), suggesting substantial agreement in transport team selection according to the Landis and Koch scale. The logistic regression analysis showed the greatest disagreement in team selection in transports with an EMT and a nurse (OR, 94.4; 95% CI, 25.9–455 [the wide CI was probably due to the sample size]), a difference that was significant (P < .001). This was particularly notable in surgical patients.
Table 4 presents the data on the fit between the actual selection of transport team composition (test variable) vs the hypothetical ideal team (gold standard) according to the SCOPETAS scale.
Comparison of selection of transport team made by providers vs appropriate team based on SCOPETAS scale.
| Percentiles | Correct selection | ||
|---|---|---|---|
| EMT | EMT + Nurse | 2 EMT + Nurse + Doctor | |
| P2.5 | 0.49 | 0.31 | 0.71 |
| P50 | 0.60 | 0.64 | 0.85 |
| P97.5 | 0.72 | 0.89 | 0.94 |
This table shows the proportion of times that the actual team composition selected by providers matched the scale's recommendation. Values range from 0 to 1, where 1 indicates perfect agreement.
Abbreviations: EMT, emergency medical technician; SCOPETAS, Score pediátrico de transporte de Asturias (Asturias Pediatric Transport Score).
Table 5 and Fig. 2 show the 2 × 2 contingency tables comparing the actual selection of BLS vs ALS teams to the hypothetical ideal and the actual selection of EMT vs EMT + nurse teams compared to the hypothetical ideal with the corresponding sensitivity, specificity, and WoE values.
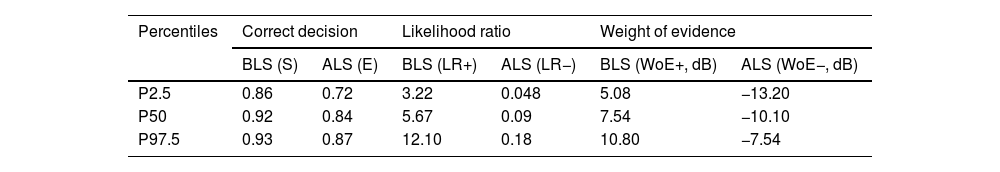
Statistics on correct transport team composition selection by providers using the SCOPETAS scale as reference.
| Percentiles | Correct decision | Likelihood ratio | Weight of evidence | |||
|---|---|---|---|---|---|---|
| BLS (S) | ALS (E) | BLS (LR+) | ALS (LR−) | BLS (WoE+, dB) | ALS (WoE−, dB) | |
| P2.5 | 0.86 | 0.72 | 3.22 | 0.048 | 5.08 | −13.20 |
| P50 | 0.92 | 0.84 | 5.67 | 0.09 | 7.54 | −10.10 |
| P97.5 | 0.93 | 0.87 | 12.10 | 0.18 | 10.80 | −7.54 |
| Percentiles | Correct decision | Likelihood ratio | Weight of evidence | |||
|---|---|---|---|---|---|---|
| EMT (S) | EMT + Nurse (E) | EMT (LR+) | EMT + Nurse (LR−) | EMT (WoE+) | EMT + Nurse (WoE− | |
| P2.5 | 0.54 | 0.44 | 1.13 | 0.33 | 0.52 | −4.87 |
| P50 | 0.64 | 0.74 | 2.49 | 0.49 | 3.93 | −3.11 |
| P97.5 | 0.67 | 0.82 | 9.59 | 0.85 | 9.82 | −0.71 |
Likelihood ratios are measures that enable the interpretation of diagnostic test results and are superior to predictive values because they do not depend on the prevalence. The LR + reflects how much a positive result increases the probability of a condition (in this case, providers selecting BLS/EMT when the scale recommends BLS/EMT). Values greater than 10 indicate a strong diagnostic power. The LR− (providers selecting ALS/EMT + Nurse when the scale recommends ALS/EMT + Nurse), with values < 0.1, indicates a strong diagnostic power. Since the interpretation of LR values is not very intuitive, the WoE was devised as an alternative, which is calculated as the common logarithm of the LR and expressed in deciBans (dB). Values greater than 10 dB for the WoE + and less than −10 for the WoE − are indicative of strong evidence.
Abbreviations: ALS, advanced life support; BLS, basic life support; dB, deciBans; EMT, emergency medical technician; LR+, positive likelihood ratio; LR−, negative likelihood ratio; Sen, sensitivity; Spe, specificity; WoE+, weight of evidence in support; WoE−, weight of evidence against.
 Graphical analysis of the WoE for the selection of BLS vs ALS (B) Graphical analysis of the WoE for the selection of EMT vs EMT + nurse. Abbreviations: ALS, advanced life support; BLS, basic life support; EMT, emergency medical technician; WoE, weight of evidence.")
Graphical analysis of the weight of evidence for the selection of BLS vs ALS and EMT vs EMT + nurse. (A) Graphical analysis of the WoE for the selection of BLS vs ALS (B) Graphical analysis of the WoE for the selection of EMT vs EMT + nurse. Abbreviations: ALS, advanced life support; BLS, basic life support; EMT, emergency medical technician; WoE, weight of evidence.
In the analysis of direct labor costs, we estimated the costs of transport as follows: EMT, €62 per transport; EMT + nurse, €101.9/transport; 2 EMTs + nurse + doctor, €226.5 per transport. The estimated total direct cost of the conducted transports was €18 707.3, which would have been reduced to €17 305.9 if the team had been selected using the SCOPETAS scale, corresponding to savings of €1401.3 (7.5%).
DiscussionThe pediatric transport tools available to date focus mainly on patient management, morbidity and mortality, with the exception of the PT3,23 which focuses on the appropriate selection of the human resources required for transport.
The development of the SCOPETAS version was motivated by the need for an instrument for the triage and optimization of resources in urgent pediatric transport in the area where the study was conducted. The scale exhibited excellent comprehensibility and reliability, with a high interrater agreement. This is a novel contribution, since, to our knowledge, there are no publications reporting instruments involving scales for PedT triage validated in Spain nor the impact of their application, for instance, on the optimization of the selection of human resources for PedT.
In our region, there is considerable variability in the transport teams available in each health care area. Since local human resources differ from those described by the group that developed the original PT3, we decided to translate and adapt it so that it could be applied to all the centers in our autonomous community that perform urgent pediatric transports (Table 2).
The scale has a numerical section, adapted from the TPEWS,21 and a list of “significant diagnoses” that warrant more advanced transport teams, an option that would not be selected based solely on the numerical assessment.
Providers were most accurate in classifying the patients with the lowest and highest acuity (WoE: 7.54 dB for BLS and −10.1 dB for ALS), which is suggestive of an adequate identification of extreme situations, in which there is usually a greater clarity and agreement in clinical judgments, but exhibited greater uncertainty in cases of intermediate severity (WoE: 3.93 dB for EMT and −3.11 dB for EMT + nurse), resulting in greater variation in the selection of the transport team. Therein lies the relevance and importance of our study, as it is in these situations of intermediate acuity that we believe the SCOPETAS scale can play a decisive role in helping standardize the selection of the transport team composition.
Based on our findings, the application of the tool would have significantly reduced the inclusion of a nurse in the transport team, optimizing the use of resources (decreasing costs and increasing staff availability). In absolute terms, the percent savings may seem moderate (in agreement with what Steffen et al. reported23), but it would not be negligible if we considered the total volume of transports in the region, adding up to greater savings that could be invested elsewhere, for instance, in staff training. In addition, the scale could have facilitated communication between hospitals by providing a shared triage approach, which further supports its potential usefulness in real-world clinical practice.
When we compared SCOPETAS to TRAP scores, we found very similar numerical scores in the patients under study, evincing a similar estimation of severity. However, the inclusion of the significant diagnosis section allowed improved identification of patients at increased risk of complications (despite having lower numerical scores), which is one of the strengths of the SCOPETAS scale, providing added value and setting it apart from other scales used to predict morbidity.
The most frequent reason for transport was surgery, as only the RH offers pediatric surgery services, which requires transport of all pediatric patients that require surgical consultation or treatment. The group of patients with the highest acuity corresponded to those with respiratory diseases, on account of the need for ventilatory support or clinical observation that could not be delivered at rural or lower-level hospitals.
There were few documented complications and unplanned interventions during the study, which all occurred in transports by the ALS team.
The main limitations of the study are that the validation process for the scale was not complete based on the currently accepted methodology (lack of back-translation, psychometric validation), not having presented a broader spectrum of hypothetical clinical scenarios in phase I, the exclusion of neonatal patients (as we considered that the tool was not adaptable for this group, which accounted for 12.4%25 of total transports), the lack of representation of some health care areas (especially those farthest from the RH), the absence of an established gold standard with which to compare the results, and the possible underestimation of complications (adverse events) during transport due to the lack of a systematic reporting system and dependence on the PedT team's report, which could affect the reliability of the test variable and entails a clinical risk that could be improved with systematic recording.
Furthermore, we cannot rule out the presence of selection bias, as the sample included only 60.7% of eligible transfers from the SHs, and it is possible that providers included a lower proportion of the most seriously ill patients, who require more interventions, leaving less time to complete the study questionnaire.
ConclusionsThe performance of local providers in patient triage for transport was more accurate for patients with severity scores in either extreme, but there was considerable variation in decision-making for patients with intermediate severity scores, highlighting a significant area of improvement.
The SCOPETAS is a simple and effective tool for optimizing PedT planning, especially in less severe scenarios. Its application could improve decision-making, reduce variation in the decisions made by providers, improve communication between centers and help optimize the use of resources.
Future studies should implement the systematic and standardized documentation of potential adverse events, cover the entire pediatric population, including neonates, and evaluate the use of the scale in other regions.
FundingThis study was funded by the Fundación Ernesto Sánchez Villares of the Sociedad de Pediatría de Asturias, Cantabria y Castilla y León. Project 2023/02.
The authors have no conflicts of interest to declare.
We thank Drs Bárbara Montes, Patricia Rodríguez, Sara Baruque, Sara Delgado and Lucía Rodríguez for their collaboration in collecting data for the project, as well as Drs Marta Nonide and Raquel Merlo for facilitating its development and diffusion.
Previous meeting: Presentation as oral communication titled “SCOPETAS (Score Pediátrico de Transporte en Asturias). Triaje en transporte pediátrico” at the XXXV Memorial Guillermo Arce y Ernesto Sánchez Villares; November 15 and 16; Salamanca, Spain.
Previous publication: a paper on the methodology and preliminary data for this study has been accepted for publication in the journal Boletín de Pediatría (upcoming issue 272, journal of the Sociedad de Pediatría de Asturias, Cantabria y Castilla y León).

Anales de Pediatría (English Edition) follows the Recommendations for the Conduct, Reporting, Editing and Publication of Scholarly Work in Medical Journals