
Extreme prematurity is associated with high mortality rates. The probability of death at different points in time is a priority for professionals and parents, and needs to be established on an individual basis. The aim of this study is to carry out a systematic review of predictive models of mortality in premature infants that have been published recently.
MethodsA double search was performed for article published in PubMed on models predicting mortality in premature neonates. The population studied were premature neonates with a gestational age of ≤30 weeks and/or a weight at birth of ≤1500g. Works published with new models from June 2010 to July 2019 after a systematic review by Medlock (2011) were included. An assessment was made of the population, characteristics of the model, variables used, measurements of functioning, and validation.
ResultsOf the 7744 references (1st search) and 1435 (2nd search) found, 31 works were selected, with 8 new models finally being included. Five models (62.5%) were developed in North America and 2 (25%) in Europe. A sequential model (Ambalavanan) enables predictions of mortality to be made at birth, 7, 28 days of life, and 36 weeks post-menstrual. A multiple logistic regression analysis was performed on 87.5% of the models. The population discrimination was measured using odds ratio (75%) and the area under the curve (50%). “internal validation” had been carried out on 5 models. Three models can be accessed on-line. There are no predictive models validated in Spain.
ConclusionsThe making of decisions based on predictive models can lead to the care given to the premature infant being more individualised and with a better use of resources. Predictive models of mortality in premature neonates in Spain need to be developed.
La prematuridad extrema se asocia a altas tasas de mortalidad. Para profesionales y familias, es prioritario establecer de forma individualizada las probabilidades de muerte en diferentes momentos. El objetivo de este estudio es efectuar una revisión sistemática de modelos predictivos de mortalidad en prematuros publicados recientemente.
MétodosDoble búsqueda de artículos publicados en PubMed sobre modelos predictivos de muerte en prematuros. Población estudiada: prematuros con edad gestacional ≤30 semanas o peso al nacer ≤1.500g. Inclusión: trabajos publicados con nuevos modelos desde junio del 2010 hasta julio del 2019, tras revisión sistemática de Medlock (2011). Se valoran: población, características de modelos, variables utilizadas, medidas de funcionamiento y validación.
ResultadosDe 7.744 referencias (primera búsqueda) y 1.435 (segunda búsqueda), se seleccionaron 31 trabajos, incluyéndose al final 8 nuevos modelos. Cinco modelos (62,5%) se desarrollaron en América del Norte y 2 (25%) en Europa. Un modelo secuencial (Ambalavanan) permite realizar predicciones de muerte al nacer, 7, 28 días de vida y 36 semanas posmenstruales. Análisis de regresión logística múltiple en el 87,5% de modelos. La discriminación poblacional se midió por odds ratio (75%) y área bajo la curva (50%). La «validación» se ha realizado en 5 modelos (interna). Tres modelos disponen de acceso online. No hay modelos predictivos validados en España.
ConclusionesLa toma de decisiones basada en modelos predictivos permite una mayor individualización de la atención dada a un niño prematuro y una mejor utilización de recursos. Es necesario desarrollar modelos de predicción de mortalidad en prematuros de España.
Prematurity is the main cause of perinatal mortality and accounts for 50% of cases of disability in childhood.1 In Spain, approximately 30,000 children are born preterm each year. Of these children, 10% are born at or before 32 weeks’ gestation or with a birth weight of 1500g or less.2,3
The subset of infants born extremely preterm (gestational age [GA] ≤28 weeks) and especially those born at the threshold of viability (GA, 23–25 weeks) pose a significant challenge for the professionals involved in their care and treatment. Due to their considerable immaturity, some of these patients may have medical problems for which there is no curative system and require palliative care. The corresponding decision-making process is long and complex for both health professionals and families.4 The main difficulty is making an accurate prognosis for the infant.
Prediction models are used to estimate the probability or risk of a certain condition occurring in the future in a given individual through the combination of different prognostic factors.5 Thus, while the diagnosis of a condition is essential to clinical decision-making, the incorporation of new prognostic tools allows a more accurate prediction of future health outcomes and can therefore guide decision-making to improve management on a case-by-case basis.6 Numerous factors influence the prognosis of a disease besides the diagnosis. For instance, in extremely preterm infants, gestational age can be used to predict the level and duration of care that they will receive (intensive, high-dependence or special care) and the probability of death or discharge home throughout the hospital stay.7
Extreme prematurity is a condition associated with a high mortality in which the risk of death varies based on the associated complications. It is important for both clinicians and family members to be able to estimate the individualised probability of death at different time points, preferably before birth, in the first hours post birth and during the hospital stay. In 2011, Medlock et al. published a systematic review that included 41 studies that evaluated mortality prediction models applicable to extremely preterm infants at one or more of these time points.8
The aim of the study was to carry out a systematic review of prediction models of mortality in premature infants developed and validated in the last 10 years.
Material and methodsLiterature search and study selectionFor the study presented here, we performed a literature search of studies on prediction models of mortality that included preterm infants in the PubMed platform, published between June 2010 and July 2019 in any language. We used the search filters proposed by Geersing et al. for systematic reviews of prediction models.9 Two independent reviewers performed the search (MI and RR), selecting the articles to be read in full based on the title and summary of each of the search results. If the 2 reviewers disagreed on whether an article should be included, the full text of the article was read. We performed 2 searches. In the first search (A), we used the following search filters: Predict*[tiab] OR Predictive value of tests[mh] OR Scor*[tiab] OR Observ*[tiab] OR Observer variation[mh]) AND (premature (MESH term) OR very low birth weight (MESH term) OR VLBW OR ELBW OR very low-birth-weight OR extremely low-birth-weight OR preterm OR prematur-) AND (mortality OR death OR survival OR viability). In the second search (B), we used the following filters: Stratification OR ROC Curve[Mesh] OR Discrimination OR Discriminate OR c-statistic OR c statistic OR Area under the curve OR AUC OR Calibration OR Indices OR Algorithm OR Multivariable) AND (infant OR premature (MESH term) OR infant OR very low birth weight (MESH term) OR VLBW OR ELBW OR very low-birth-weight OR extremely low-birth-weight OR preterm OR prematur-) AND (mortality OR death OR survival OR viability).
Inclusion and exclusion criteriaThe criteria for inclusion of identified publications in the analysis were:
- –
Population: sample fully composed of or including preterm infants born before 32 weeks’ gestation or with birth weights of less than 1500g.
- –
Outcome: neonatal mortality or survival (alone or combined with another outcome), at birth, at discharge from NICU or during follow-up.
- –
Performance evaluation of prediction models: at least 1 multivariate performance measure (discrimination, calibration or prediction).
We tabulated and listed identified studies according to the following exclusion criteria:
- –
Validation of old prediction models (from before June 2010).
- –
Analysis of factors or diseases associated with an adverse outcome (such as death in infants with birth weight <1500g and nosocomial sepsis).
We classified the selected studies into development studies (new prediction models not published before or modifications of previously published models), validation studies (evaluation of the performance of previously published prediction models) or impact studies (assessment of the impact of a prediction model in clinical decision-making).
For each development study, we collected data on the study population, prediction model characteristics, variables considered, and the measures used to assess the performance validate the prediction model.
- –
Population. Defined as the GA or birth weight (BW) range of included patients. We recorded the age of the patients at the time of inclusion in the model and the setting and timeframe in which the study was conducted.
- –
Characteristics of prediction models. Includes the period or time point when the prediction model is applied (prenatal, first hours/days post birth, during the stay in the neonatal intensive care unit [NICU]). We also categorised models by type: logistic regression, neural network, classification tree or other. We recorded how the model was expressed if it was reported in the article (score, algorithm or equation).
- –
Variables. We recorded the outcome (dependent) variable and the input (independent) variables in each model.
- –
Performance measure. We categorised these measures as follows:
- 1.
Discrimination measures whether the prediction model gives higher probabilities to patients with the event (e.g. deceased patients) as opposed to patients without the event (e.g. surviving patients), usually by means of the area under the curve (AUC) and the odds ratio (OR).
- 2.
Calibration measures whether the predicted probability is approximately correct (e.g. when the model predicts a 60% chance of death, it is expected that approximately 60% of patients will die). One possible measure is the Hosmer–Lemeshow test.
- 3.
Predictive accuracy: it is usually an actual measurement that may be expressed as a probability percentage or categorised into 0 or 1 (death or survival) based on a cut-off point. The most commonly used measures of accuracy are sensitivity, specificity, and the positive and negative predictive values. The Brier score measures the gap between forecast probabilities and actual outcomes and is not influenced by a selected cut-off point. Measures of accuracy may combine discrimination and calibration elements.
The Nagelkerke R2 combines the different measures described above.
- –
Validation. It evaluates the performance of the model. Internal validation evaluates performance in the same population in which the model was developed (apparent validation, in same sample) by splitting the sample (e.g. with a bootstrap sample) or using a separate sample for validation. External validation is performed in a different population from the one in which the model was developed. It can be performed using AUCs and concordance statistics.
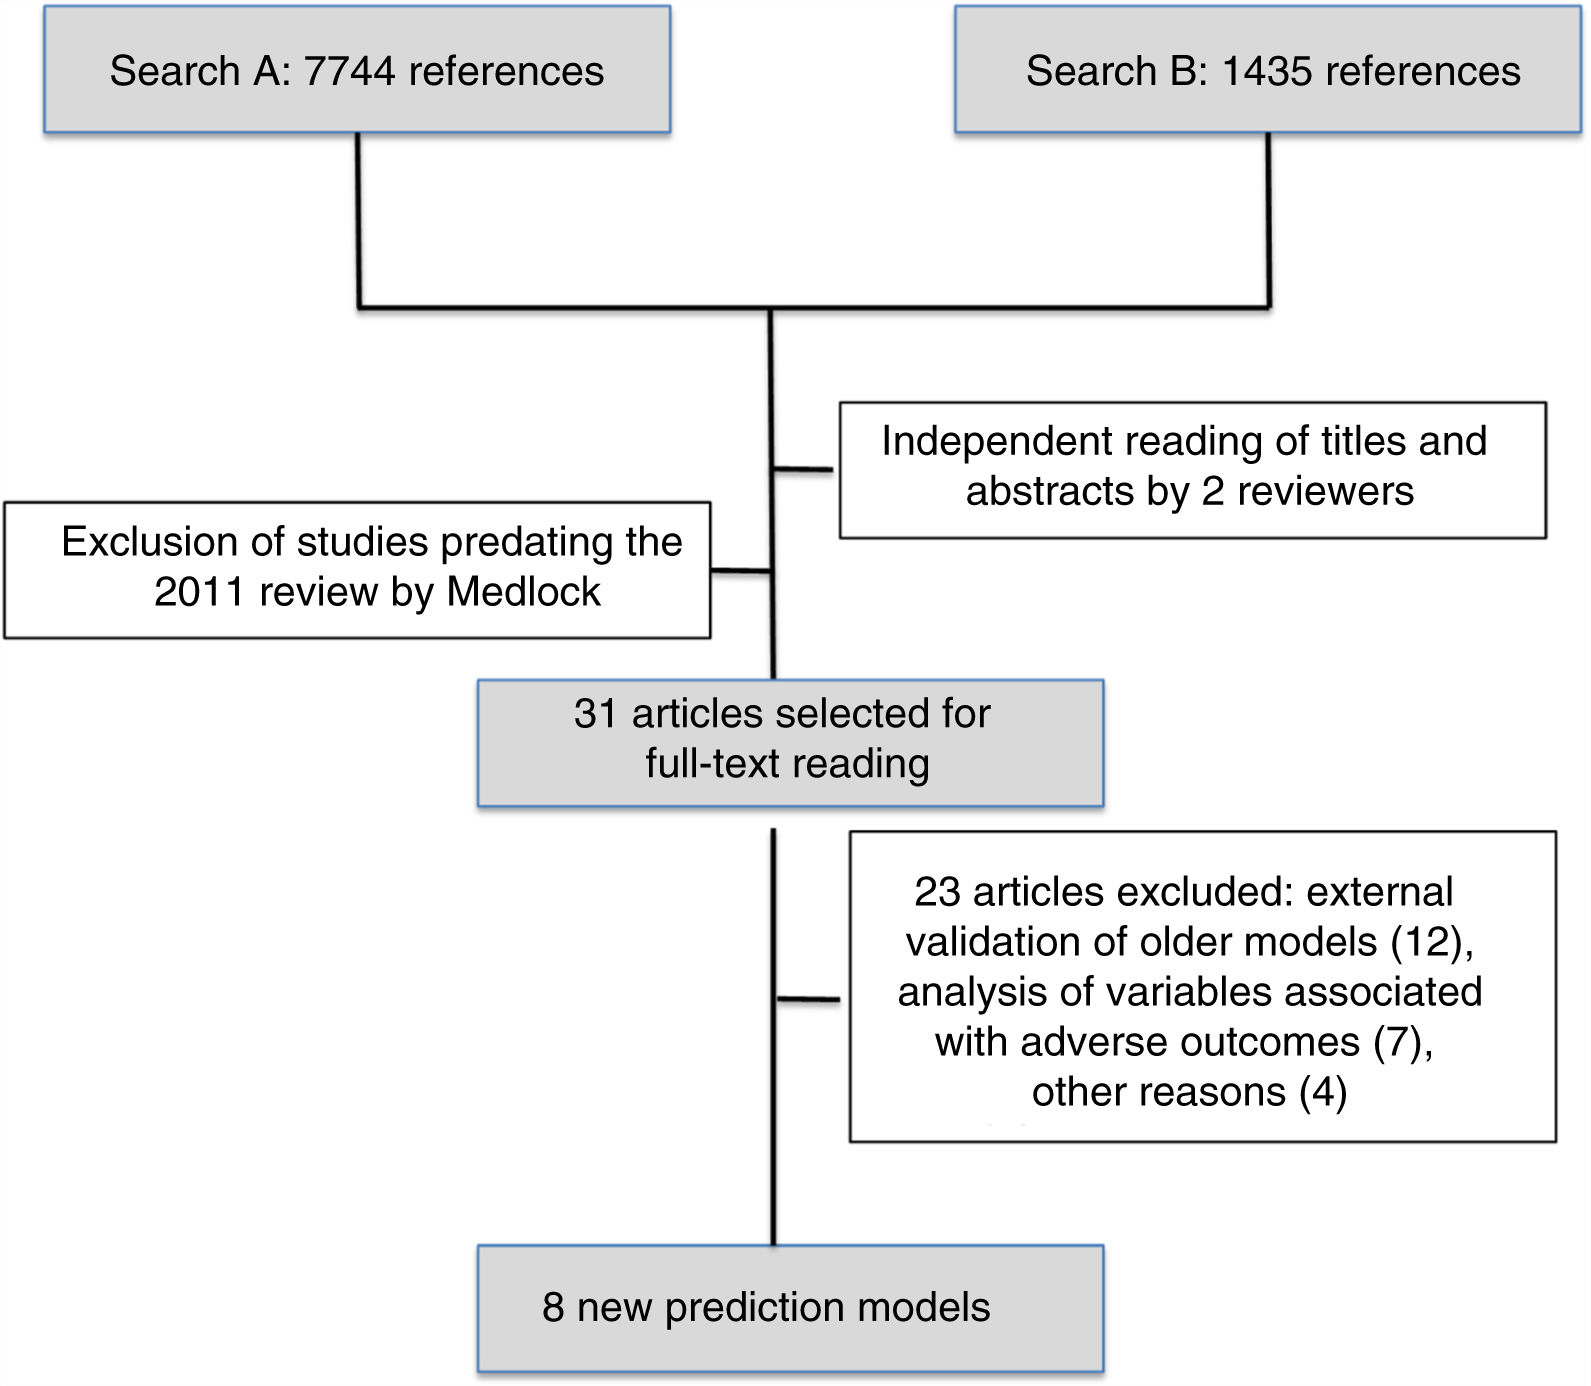
The first search identified 7744 references and the second 1435 references. After reading the titles and abstracts, the reviewers selected 31 articles published after May 2010 to be read in full, and subsequently excluded 23. We finally reviewed the 8 new prediction models of mortality for preterm infants published since 201010–17 (Fig. 1).

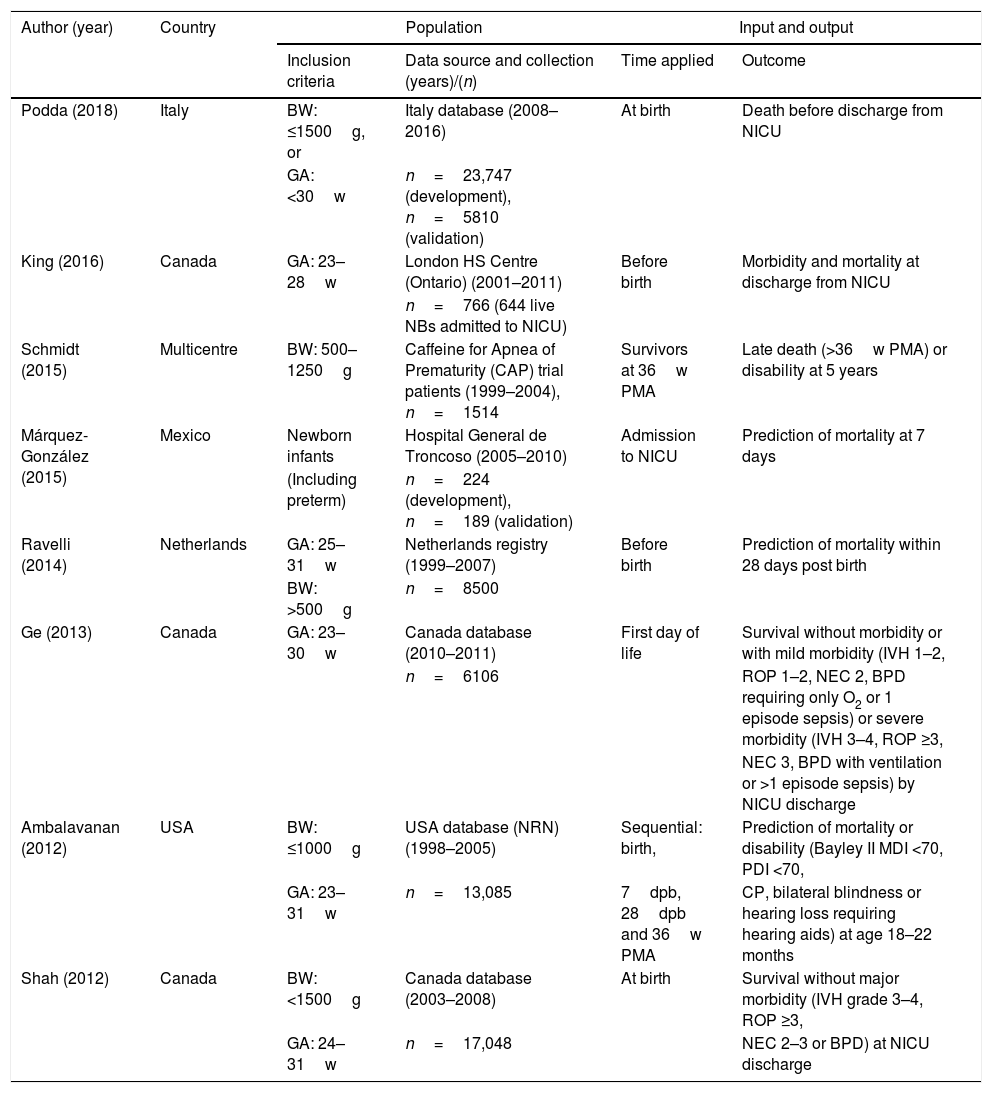
Table 1 presents the study populations, times of model application and outcomes in the 8 new mortality prediction models. Of this total, 5 (62.5%) were developed in North America (3 in Canada), 2 (25%) in Europe (Netherlands and Italy) and 1 was an international multicentre project. All included preterm newborns of different BWs and GAs exclusively except for the model developed in Mexico,14 which can also be applied to full-term newborns. The sample size varied widely, and the studies that included the greatest number of preterm infants were 1 conducted in Italy (Podda et al., n=23,747),17 1 in Canada (Shah et al., n=17,048)10 and 1 in the USA (Ambalavanan et al., n=13,085).11 When it came to the time point that the model was applied, 2 (25%) were prenatal models,13,16 6 (62.5%) were applied at birth or in the first day of life10–12,14,17 and 2 (25%) involved assessments at different times during the stay in the NICU.11,15 Of these new models, we ought to highlight the sequential model of Ambalavanan et al.,11 which makes it possible to adjust the prognosis depending on the clinical trajectory of the newborn during the stay in the neonatal unit by making predictions at 7 and 28 days post birth and at 36 weeks of postmenstrual age. The outcome variable was different in every study. Three studies (37.5%) considered mortality alone at different times during the stay,13,14,17 and the rest combined mortality with survival with different degrees of morbidity during hospitalisation or after discharge.10,15,16
Study population, time of model application and outcomes in the new mortality prediction models for preterm newborns.
| Author (year) | Country | Population | Input and output | ||
|---|---|---|---|---|---|
| Inclusion criteria | Data source and collection (years)/(n) | Time applied | Outcome | ||
| Podda (2018) | Italy | BW: ≤1500g, or | Italy database (2008–2016) | At birth | Death before discharge from NICU |
| GA: <30w | n=23,747 (development), n=5810 (validation) | ||||
| King (2016) | Canada | GA: 23–28w | London HS Centre (Ontario) (2001–2011) | Before birth | Morbidity and mortality at discharge from NICU |
| n=766 (644 live NBs admitted to NICU) | |||||
| Schmidt (2015) | Multicentre | BW: 500–1250g | Caffeine for Apnea of Prematurity (CAP) trial patients (1999–2004), n=1514 | Survivors at 36w PMA | Late death (>36w PMA) or disability at 5 years |
| Márquez-González (2015) | Mexico | Newborn infants | Hospital General de Troncoso (2005–2010) | Admission to NICU | Prediction of mortality at 7 days |
| (Including preterm) | n=224 (development), n=189 (validation) | ||||
| Ravelli (2014) | Netherlands | GA: 25–31w | Netherlands registry (1999–2007) | Before birth | Prediction of mortality within 28 days post birth |
| BW: >500g | n=8500 | ||||
| Ge (2013) | Canada | GA: 23–30w | Canada database (2010–2011) | First day of life | Survival without morbidity or with mild morbidity (IVH 1–2, |
| n=6106 | ROP 1–2, NEC 2, BPD requiring only O2 or 1 episode sepsis) or severe morbidity (IVH 3–4, ROP ≥3, | ||||
| NEC 3, BPD with ventilation or >1 episode sepsis) by NICU discharge | |||||
| Ambalavanan (2012) | USA | BW: ≤1000g | USA database (NRN) (1998–2005) | Sequential: birth, | Prediction of mortality or disability (Bayley II MDI <70, PDI <70, |
| GA: 23–31w | n=13,085 | 7dpb, 28dpb and 36w PMA | CP, bilateral blindness or hearing loss requiring hearing aids) at age 18–22 months | ||
| Shah (2012) | Canada | BW: <1500g | Canada database (2003–2008) | At birth | Survival without major morbidity (IVH grade 3–4, ROP ≥3, |
| GA: 24–31w | n=17,048 | NEC 2–3 or BPD) at NICU discharge | |||
BPD, bronchopulmonary dysplasia; BW, birth weight; CP, cerebral palsy; dpb, days post birth; GA, periventricular gestational age; IVH, intraventricular haemorrhage; MDI: Mental Developmental Index; NEC, necrotising enterocolitis; NICU, neonatal intensive care unit; PDI: Psychomotor Developmental Index; PMA, postmenstrual age; PVLM, leukomalacia; ROP, retinopathy of prematurity; w, weeks.
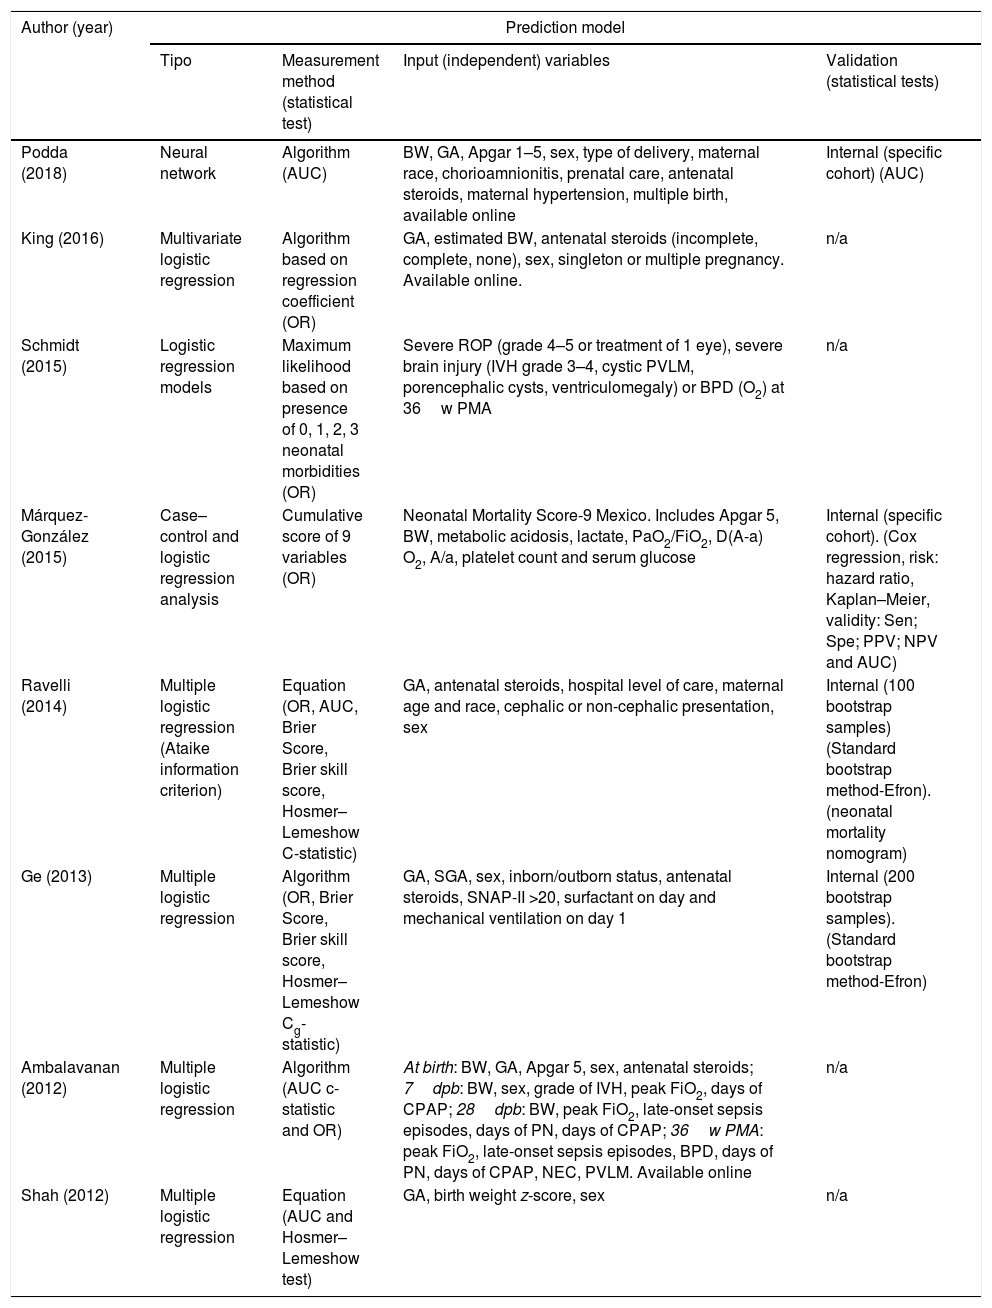
Table 2 summarises the statistical characteristics of the 8 new prediction models. We found that 87.5% used different multiple logistic regression approaches and only the most recent study17 used a neural network approach. The methods used to measure discrimination were the OR (75%) and the AUC (50%). The Hosmer–Lemeshow test was used as a measure of calibration in 3 studies10,12,13 (37.5%), of which 2 also used the Brier score to assess accuracy12,13 (25%). The input (independent) variables in the different models varied widely both in nature and number (Table 2).
Statistical characteristics of the new mortality prediction models for preterm newborns.
| Author (year) | Prediction model | |||
|---|---|---|---|---|
| Tipo | Measurement method (statistical test) | Input (independent) variables | Validation (statistical tests) | |
| Podda (2018) | Neural network | Algorithm (AUC) | BW, GA, Apgar 1–5, sex, type of delivery, maternal race, chorioamnionitis, prenatal care, antenatal steroids, maternal hypertension, multiple birth, available online | Internal (specific cohort) (AUC) |
| King (2016) | Multivariate logistic regression | Algorithm based on regression coefficient (OR) | GA, estimated BW, antenatal steroids (incomplete, complete, none), sex, singleton or multiple pregnancy. Available online. | n/a |
| Schmidt (2015) | Logistic regression models | Maximum likelihood based on presence of 0, 1, 2, 3 neonatal morbidities (OR) | Severe ROP (grade 4–5 or treatment of 1 eye), severe brain injury (IVH grade 3–4, cystic PVLM, porencephalic cysts, ventriculomegaly) or BPD (O2) at 36w PMA | n/a |
| Márquez-González (2015) | Case–control and logistic regression analysis | Cumulative score of 9 variables (OR) | Neonatal Mortality Score-9 Mexico. Includes Apgar 5, BW, metabolic acidosis, lactate, PaO2/FiO2, D(A-a) O2, A/a, platelet count and serum glucose | Internal (specific cohort). (Cox regression, risk: hazard ratio, Kaplan–Meier, validity: Sen; Spe; PPV; NPV and AUC) |
| Ravelli (2014) | Multiple logistic regression (Ataike information criterion) | Equation (OR, AUC, Brier Score, Brier skill score, Hosmer–Lemeshow C-statistic) | GA, antenatal steroids, hospital level of care, maternal age and race, cephalic or non-cephalic presentation, sex | Internal (100 bootstrap samples) (Standard bootstrap method-Efron). (neonatal mortality nomogram) |
| Ge (2013) | Multiple logistic regression | Algorithm (OR, Brier Score, Brier skill score, Hosmer–Lemeshow Cg-statistic) | GA, SGA, sex, inborn/outborn status, antenatal steroids, SNAP-II >20, surfactant on day and mechanical ventilation on day 1 | Internal (200 bootstrap samples). (Standard bootstrap method-Efron) |
| Ambalavanan (2012) | Multiple logistic regression | Algorithm (AUC c-statistic and OR) | At birth: BW, GA, Apgar 5, sex, antenatal steroids; 7dpb: BW, sex, grade of IVH, peak FiO2, days of CPAP; 28dpb: BW, peak FiO2, late-onset sepsis episodes, days of PN, days of CPAP; 36w PMA: peak FiO2, late-onset sepsis episodes, BPD, days of PN, days of CPAP, NEC, PVLM. Available online | n/a |
| Shah (2012) | Multiple logistic regression | Equation (AUC and Hosmer–Lemeshow test) | GA, birth weight z-score, sex | n/a |
A/a, arterial/alveolar ratio; AUC, area under the curve; BPD, bronchopulmonary dysplasia; BW, birth weight; CPAP, continuous positive airway pressure; p(A-a) O2, alveolar-arterial oxygen gradient; dpb, days post birth; GA, gestational age; IVH, intraventricular haemorrhage; MDI, Mental Developmental Index; NEC, necrotising enterocolitis; NPV, negative predictive value; OR: odds ratio; PaO2/FiO2, ratio of partial arterial oxygen pressure to fraction of inspired oxygen; PDI, Psychomotor Developmental Index; PMA, postmenstrual age; PN, parenteral nutrition; PPV, positive predictive value; PVLM, periventricular leukomalacia; Sen, sensitivity; Spe, specificity; SGA, small for gestational age; ROP, retinopathy of prematurity; w, weeks.
The validation of the models consisted of internal validation in 5 of the studies (62.5%).11–14,17 Two models (25%) were validated in specific cohorts different from the cohorts used in the development phase,14,17 one by analysing a subset of 30% of the total sample11 (12.5%) and another 2 (25%) using a bootstrap approach in small subsets.12,13 Three models have online tools.11,16,17
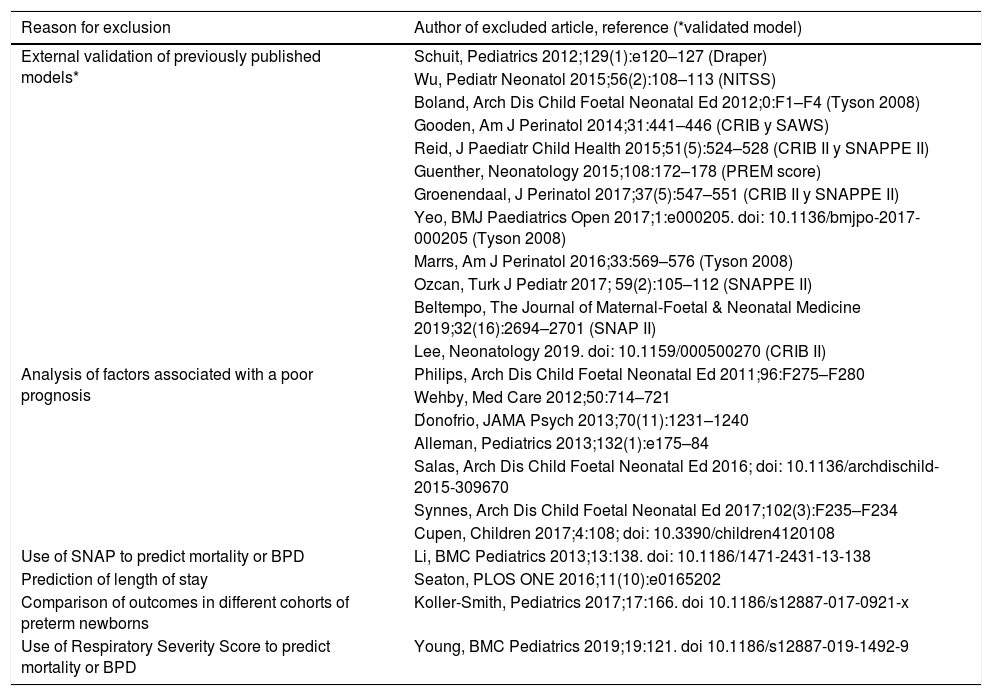
The other 23 studies initially selected after reading the full text that were ultimately excluded (Table 3), 12 external validation studies of previously published models, 7 studies that analysed different outcomes associated with a poor prognosis, 1 study on the use of the Score for Neonatal Acute Physiology (SNAP) to predict mortality or bronchopulmonary dysplasia (BPD), 1 to predict the length of stay, 1 that compared outcomes in different cohorts of preterm newborns and 1 on the use of the Respiratory Severity Score to predict mortality or BPD.
Articles excluded from final analysis.
| Reason for exclusion | Author of excluded article, reference (*validated model) |
|---|---|
| External validation of previously published models* | Schuit, Pediatrics 2012;129(1):e120–127 (Draper) |
| Wu, Pediatr Neonatol 2015;56(2):108–113 (NITSS) | |
| Boland, Arch Dis Child Foetal Neonatal Ed 2012;0:F1–F4 (Tyson 2008) | |
| Gooden, Am J Perinatol 2014;31:441–446 (CRIB y SAWS) | |
| Reid, J Paediatr Child Health 2015;51(5):524–528 (CRIB II y SNAPPE II) | |
| Guenther, Neonatology 2015;108:172–178 (PREM score) | |
| Groenendaal, J Perinatol 2017;37(5):547–551 (CRIB II y SNAPPE II) | |
| Yeo, BMJ Paediatrics Open 2017;1:e000205. doi: 10.1136/bmjpo-2017-000205 (Tyson 2008) | |
| Marrs, Am J Perinatol 2016;33:569–576 (Tyson 2008) | |
| Ozcan, Turk J Pediatr 2017; 59(2):105–112 (SNAPPE II) | |
| Beltempo, The Journal of Maternal-Foetal & Neonatal Medicine 2019;32(16):2694–2701 (SNAP II) | |
| Lee, Neonatology 2019. doi: 10.1159/000500270 (CRIB II) | |
| Analysis of factors associated with a poor prognosis | Philips, Arch Dis Child Foetal Neonatal Ed 2011;96:F275–F280 |
| Wehby, Med Care 2012;50:714–721 | |
| D́onofrio, JAMA Psych 2013;70(11):1231–1240 | |
| Alleman, Pediatrics 2013;132(1):e175–84 | |
| Salas, Arch Dis Child Foetal Neonatal Ed 2016; doi: 10.1136/archdischild-2015-309670 | |
| Synnes, Arch Dis Child Foetal Neonatal Ed 2017;102(3):F235–F234 | |
| Cupen, Children 2017;4:108; doi: 10.3390/children4120108 | |
| Use of SNAP to predict mortality or BPD | Li, BMC Pediatrics 2013;13:138. doi: 10.1186/1471-2431-13-138 |
| Prediction of length of stay | Seaton, PLOS ONE 2016;11(10):e0165202 |
| Comparison of outcomes in different cohorts of preterm newborns | Koller-Smith, Pediatrics 2017;17:166. doi 10.1186/s12887-017-0921-x |
| Use of Respiratory Severity Score to predict mortality or BPD | Young, BMC Pediatrics 2019;19:121. doi 10.1186/s12887-019-1492-9 |
Synes, 2017: predictors of adverse neurodevelopmental outcomes in Canada in <28 weeks. Excluded. Salas, 2016: evaluate if weight is a better predictor than GA for death or neurodevelopmental outcome at 18–24 months of age. Neonatal Research Network. Excluded. D’Onofrio, 2013: comparison of association of preterm birth and mortality and different outcomes, psychiatric, academic and social. Excluded. Wehby, 2012: hospital volume and mortality of very low birth weight (VLBW) infants in New Jersey. Excluded. Philips, 2011: neonatal illness prognosis indicator: Included peak lactate in first 12h of life, GA and presence of congenital malformations. Cupen, 2017: risk factors associated with mortality in preterm infants in Trinidad and Tobago. Excluded. Koller-Smith, 2017: comparison of short-term outcomes in Canadian, Swedish and Australia-New Zealand cohort comparing VLBW (PN <1500g) versus very low gestational age (GA <32 weeks) similar outcomes. Excluded. Li, 2013. Prediction of mortality or BPD. Includes SNAP, gestational age, apnoea of prematurity, patent ductus arteriosus, and surfactant use in first 72h post birth. Excluded.
Predictive methods are based on epidemiological population data on the selected outcomes, while health professionals and families need specific information on the individual outcomes of a particular child.28 Thus, the applicability of the model may be limited by the fact that the model may be based on data that could be obsolete by the time the model is validated. When we analysed models published after the review by Medlock et al.,8 we found that some are based on population-based data for infants born preterm up to 15 years before publication of the model.11,13,15,16 Furthermore, some of these classical prediction models, such as the Clinical Risk Index for Babies (CRIB) score19 or the model published by Draper et al.20 were developed using data for preterm newborns collected before the use of surfactant became widespread, which may compromise their current applicability.
Even in recent models, it is important to take into account that models developed in one population may not be applicable to a different population. This is why models such as the simplified age-weight (SAW) or the simplified age-weight-sex (SAWS) classifications,21 designed for developing countries where it would not make sense to apply other types of variables, are important. Thus, it is important that a prediction model undergoes not only internal validation, but also external validation in other populations if it is expected to be applied to populations other than the source population. Of all the prognostic models developed to date for preterm infants, less than half have undergone internal validation and only 4 have undergone external validation in more than 1 study (National Institute of Child Health and Human Development [NICHD], CRIB, SNAP II and Neonatal Acute Physiology Perinatal Extension [SNAPPE] II).8 Our analysis of the 8 models published most recently revealed that half had undergone internal validation,12,17 and to our knowledge none have undergone external validation, which limits their applicability in other geographical areas.
In Spain, there are currently no prediction models for preterm infants developed with data collected in the Spanish population, and the instruments most widely used in clinical practice are the CRIB score18 and the NICHD model published by Tyson et al.22
To facilitate the widespread use of a model, it is helpful to make online instruments available that can be easily accessed and interpreted by health care professionals, as has been done for some of the models.11,16,17,22 Another aspect that can be useful would be to be able to adjust the data used in the model to the specific characteristics of a single child. In this regard, we ought to highlight the effort made in the 2012 NICHD model11 to adjust the prognosis based on different events that may take place during the hospital stay of the preterm infant by offering sequential prediction models applied at birth, 7 and 28 days post birth and 36 weeks of postmenstrual age. Most existing models make the prediction at a given time point, predominantly at birth or in the first day of hospitalisation,10,12,14,16,17 which limits their usefulness.
Another important aspect is the outcome or dependent variable that is evaluated. Some of the outcomes investigated in recent studies, in addition to mortality or survival at different time points (from 7 days post birth to hospital discharge), include morbidity during the hospital stay12,16 or neurodevelopmental abnormalities at age 18–22 months.11
In nearly all of the prediction models analysed in this review, the statistical methods used during the development phase were based on multivariate logistic regression,10–16 with the study by Podda et al.17 being the exception that used a neural network approach. An equal number of studies performed internal validation by means of specific cohorts14,17 and bootstrap samples.12,13 Validation in different cohorts offers the advantage of allowing inclusion of a greater number of patients and determining whether the model continues to be useful as time passes.
Whenever prediction models are used, it is important to take into account the self-fulfilling prophecy phenomenon.11 By giving professional access to these models, they may perpetuate the values of the model itself, precluding outcomes different from those already validated in the model. For example, a hospital with a proportion of survival of 10% in preterm infants born at 23 weeks’ gestation is likely to perpetuate this proportion if families and providers make decisions based on this figure in subsequent years. It is known that when the providers that manage a newborn are pessimistic about the outcome, outcomes tend to be worse.23 In light of this, we need to periodically review prediction models and adapt them to observed changes in survival through the years, as has been done by the NICH11,22 and the Canadian Neonatal Network.10,12
It is important to assess the quality of any new prediction model. With this purpose, the Prognosis Methods Group of the Cochrane Collaboration developed the Checklist for Critical Appraisal and Data Extraction for Systematic Reviews of Prediction Modelling Studies (CHARMS) with a list of elements to be used for critical evaluation of each predictive model,24 including aspects like the source of data, participant description, predicted outcomes, sample size, handling of missing data, model development, model performance, applicability and risk of bias. Recently, a different group published the Prediction model Risk Of Bias Assessment Tool (PROBAST),25 developed to assess risk of bias and applicability of models in studies that develop, validate or update prediction models by means of 20 items organised into 4 domains (participants, predictors, outcome and analysis).
At present, there are no studies in the impact of the use of prediction models in decision-making in preterm infants,8 and also no studies analysing which outcomes families would consider most important for the purpose of decision-making or how they would like to have the available evidence presented to them.26
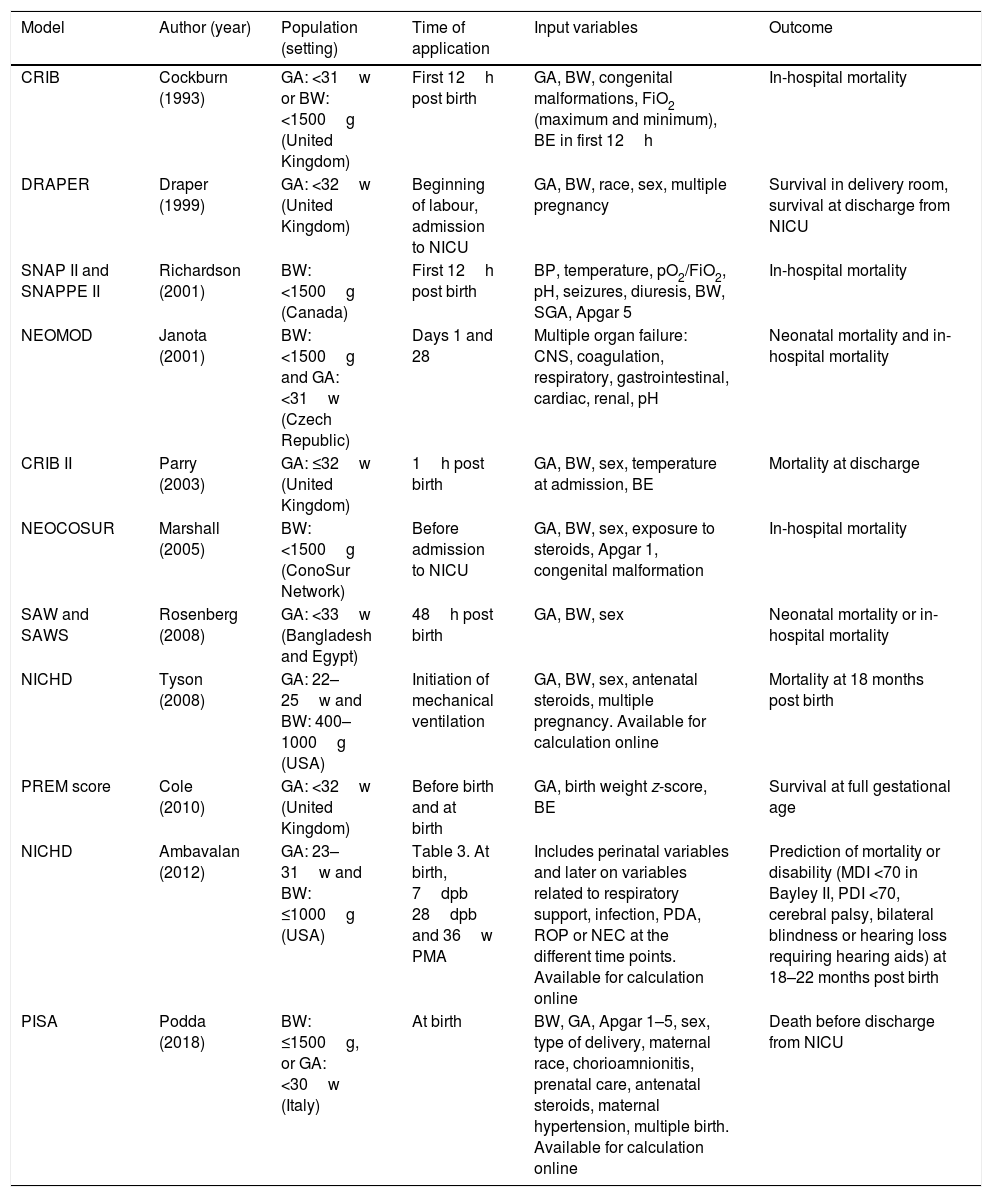
Table 4 presents the main prediction models currently used at the international level,11,17,19–22,27–31 some of which have been developed in the same population over periods of more than 2 decades,19,20 and most of them not externally validated in a different population.8
Main prediction models currently available.
| Model | Author (year) | Population (setting) | Time of application | Input variables | Outcome |
|---|---|---|---|---|---|
| CRIB | Cockburn (1993) | GA: <31w or BW: <1500g (United Kingdom) | First 12h post birth | GA, BW, congenital malformations, FiO2 (maximum and minimum), BE in first 12h | In-hospital mortality |
| DRAPER | Draper (1999) | GA: <32w (United Kingdom) | Beginning of labour, admission to NICU | GA, BW, race, sex, multiple pregnancy | Survival in delivery room, survival at discharge from NICU |
| SNAP II and SNAPPE II | Richardson (2001) | BW: <1500g (Canada) | First 12h post birth | BP, temperature, pO2/FiO2, pH, seizures, diuresis, BW, SGA, Apgar 5 | In-hospital mortality |
| NEOMOD | Janota (2001) | BW: <1500g and GA: <31w (Czech Republic) | Days 1 and 28 | Multiple organ failure: CNS, coagulation, respiratory, gastrointestinal, cardiac, renal, pH | Neonatal mortality and in-hospital mortality |
| CRIB II | Parry (2003) | GA: ≤32w (United Kingdom) | 1h post birth | GA, BW, sex, temperature at admission, BE | Mortality at discharge |
| NEOCOSUR | Marshall (2005) | BW: <1500g (ConoSur Network) | Before admission to NICU | GA, BW, sex, exposure to steroids, Apgar 1, congenital malformation | In-hospital mortality |
| SAW and SAWS | Rosenberg (2008) | GA: <33w (Bangladesh and Egypt) | 48h post birth | GA, BW, sex | Neonatal mortality or in-hospital mortality |
| NICHD | Tyson (2008) | GA: 22–25w and BW: 400–1000g (USA) | Initiation of mechanical ventilation | GA, BW, sex, antenatal steroids, multiple pregnancy. Available for calculation online | Mortality at 18 months post birth |
| PREM score | Cole (2010) | GA: <32w (United Kingdom) | Before birth and at birth | GA, birth weight z-score, BE | Survival at full gestational age |
| NICHD | Ambavalan (2012) | GA: 23–31w and BW: ≤1000g (USA) | Table 3. At birth, 7dpb 28dpb and 36w PMA | Includes perinatal variables and later on variables related to respiratory support, infection, PDA, ROP or NEC at the different time points. Available for calculation online | Prediction of mortality or disability (MDI <70 in Bayley II, PDI <70, cerebral palsy, bilateral blindness or hearing loss requiring hearing aids) at 18–22 months post birth |
| PISA | Podda (2018) | BW: ≤1500g, or GA: <30w (Italy) | At birth | BW, GA, Apgar 1–5, sex, type of delivery, maternal race, chorioamnionitis, prenatal care, antenatal steroids, maternal hypertension, multiple birth. Available for calculation online | Death before discharge from NICU |
BE, base excess; BP, blood pressure; dpb, days post birth; BW, birth weight; GA, gestational age; MDI, Mental Developmental Index; NEC, necrotising enterocolitis; PaO2/FiO2, ratio of partial arterial oxygen pressure to fraction of inspired oxygen; PDA, patent ductus arteriosus; PDI, Psychomotor Developmental Index; PMA, postmenstrual age; ROP, retinopathy of prematurity; SGA, small for gestational age; w, weeks.
In Spain, the SEN 1500 Network has been collecting data on infants born before 30 weeks’ gestation or with a BW of 1500g or lower since 2002.32,33 The objectives of this Network are to assess and compare the quality of neonatal care of very low birth weight infants born in Spain and to provide data to professionals for comparison with other populations34 and to develop specific improvement measures in their care settings.35–38 The data obtained by the network is clearly an ideal source for the development of mortality and morbidity prediction models in this population and specifically in Spain.
One of the strengths of the study is that we performed 2 complementary literature searches of studies that included preterm infants and death or survival as an endpoint. One of the searches was based on predominantly clinical criteria and the other on statistical methods. One possible limitation is that both searches focused exclusively on the PubMed database.
In conclusion, decision-making based on prediction models allows a higher degree of individualisation of the care delivered to a child and optimises the use of available resources. It is important to be aware of the risks involved in using these models. At present, there are no externally validated models for predicting outcomes of preterm infants in Spain, nor models developed and validated with Spanish data. The SEN 1500 Network provides an opportunity to develop mortality prediction models for Spanish preterm infants at different time points.
Conflicts of interestThe authors have no conflicts of interest to declare.
Please cite this article as: del Río R, Thió M, Bosio M, Figueras J, Iriondo M. Predicción de mortalidad en recién nacidos prematuros. Revisión sistemática actualizada. An Pediatr (Barc). 2020;93:24–33.