

There are established European guidelines for physical activity in childhood. The main goal of our study was to determine the factors that may influence compliance with European recommendations for physical activity in young children.
MethodsWe included 136 children (aged 2–8 years) classified by weight status, calculated based on the body mass index z-score using the growth standards of the World Health Organization. We measured physical activity over 5 consecutive days with accelerometers and recorded the food intake.
ResultsA greater level of physical activity was associated with a lower weight status category (B = −1.55; 95% CI, −2.02 to −1.08, P < .001), lower age (B = −1.33; 95% CI, −1.72 to −0.93, P < .001) and greater energy expenditure (B = 0.02; 95% CI, 0.02 to 0.03, P < .001). The overall physical activity in the sample was light (mean = 589 cpm/day). Children with overweight and obesity spent less time engaged in moderate to vigorous physical activity (P = .005) and more time engaged in sedentary activities (P = .005) compared to children with normal weight. All groups spent between 90 and 130 min a day in sedentary activities, with a mean time spent that amounted to 15.5% of their time (excluding time spent sleeping). The adherence to European recommendations varied in association with sex (P = .010) and weight status (P = .038).
ConclusionYoung children spent more than 100 min a day engaged in sedentary activities. Most of the sample met the European recommendations for daily moderate to vigorous physical activity. However, the degree of adherence depended on sex and weight status.
Existen recomendaciones europeas de actividad física para la infancia. El principal objetivo de estudio era determinar los factores que podrían influir en el cumplimiento de las recomendaciones europeas de actividad física en la primera infancia. Métodos: 136 niños ( 2-8 años), clasificados según su estado de peso medido con puntajes Z del IMC siguiendo los estándares de la OMS. Se midió la actividad física durante 5 días consecutivos con acelerómetros y la ingesta diaria.
ResultadosUna mayor actividad física se asoció con un menor estado de peso (B=-1,55; 95% CI, -2,02 to -1,08, p < 0,001), menor edad (B=-1,33; 95% CI, -1,72 to -0,93, p < 0,001) y mayor gasto energético (B = 0,02; 95% CI, 0,02 to 0,03, p < 0,001). El total de la muestra tuvo una actividad física ligera (media = 589 cpm/día). Los niños con sobrepeso y obesidad pasaron menos tiempo en actividad física moderada-vigorosa (p = 0,005) y más tiempo en actividad física sedentaria (p = 0,005) que los del grupo normopeso. Todos los grupos pasaron entre 90 y 130 minutos diarios en actividades sedentarias, con una media que supone un 15,5% del tiempo de actividad (eliminando las horas de sueño). El cumplimiento de las recomendaciones europeas depende del sexo (p = 0,010) y el estado de peso (p = 0,038).
ConclusiónLos preescolares pasaron más de 100 minutos diarios en tiempo sedentario. Las recomendaciones europeas de actividad física moderada-vigorosa diarias se cumplieron por la mayoría de la muestra. Sin embargo, este cumplimiento dependía del sexo y el menor estado de peso.
In the past few decades, the childhood obesity prevalence has been increasing worldwide.1 In the case of Spain, the prevalence of overweight and obesity in children has exceeded 35%.2–4 Although these numbers should be lower in early childhood, a recent study conducted in 4-to-6-year-old Spanish children reported a prevalence of overweight and obesity of 20.4%, which means that 1 out of 5 young children had excess weight.5
Environmental 6 factors play an important role on this obesity epidemic, including factors such as consumption of unhealthy food, low levels of physical activity (PA) or sedentary lifestyles.6 In particular, food intake and energy expenditure are at the core of programmes aimed at preventing or treating childhood obesity.7
Self-reported questionnaires are among the means used to assess the level of PA, but they have limitations.8 In recent years, actigraphy has proven to be a valid, accurate and objective method for measurement of PA.9 Accelerometers record PA in counts per minute (cpm), and the values are categorized into different levels of PA. The IDEFICS Study, recommends the use of Evenson's cut points10 to define 4 levels of PA: sedentary, light, moderate and vigorous. The authors also recommend calculating the mean cpm and the minutes per day spent in moderate to vigorous PA (MVPA) or at a sedentary level of activity11 for the purpose of assessing compliance with the European recommendation of at least 60 min per day of MVPA.12
Compliance with these recommendations seems to vary based on the country, age and sex of the individual.11 For this reason, the objective of our study was to identify the factors that may influence compliance with European PA recommendations in young children.
Materials and methodsPopulation under studyRafal is a small town in Alicante, Spain, which a population of 3091 inhabitants. It is located in the middle of a rural area where most of the population is employed in agriculture in the production of fruits, vegetables and wine. Foods that are the mainstays of the Mediterranean diet are widely available. Households in the area are usually of low-to-medium socioeconomic status, with a proportion of children born to immigrant parents of 22.5%, mostly of Moroccan origin.
Study design and participantsWe conducted a cross-sectional observational study with a quantitative analysis. The participants were children aged 2–8 years. We invited the entire population in this age group (by seeking to obtain parental consent) to participate in this study. We gained access to this population through the school and the two child care centres in the town.
To collect the anthropometric data, nutritionists took the children to the multipurpose classroom in small groups of 4 children. Children were in underwear and without shoes during the measurements. Afterwards, the nutritionists placed accelerometers on the children and explained that they should only be removed to have a shower or bath. During these days, parents helped ensure the correct placement of the accelerometers without interruptions and documented the times when children went to bed and got up and any interruptions in the recordings.
The inclusion criteria were: age 2 to 8 years, signed consent from parents after they had been informed about the study.
Variables and measurementsThe primary variable in the study was PA. It was measured without interruption over 5 consecutive days (3 workdays and 2 public holidays) with accelerometers with established validity for the objective measurement of physical activity in this age group.13–15 Data were recorded every 15 epochs to maximize opportunities to capture more accurately the sporadic nature of young children’s physical activity.13 A valid day includes at least 10 h per day according to the National Health and Nutrition Examination Survey,14 and we required a minimum of 4 consecutive days (3 weekdays and 1 weekend day) to include a child in the analysis.15 We defined inactivity as 20 min of consecutive zeros. We determined the times when children were not wearing the accelerometer, for instance during aquatic activities or when children refused to wear it. We compared these periods of time with the periods reported by the parents. We also determined the hours devoted to sleep during night and day,15 which we excluded (an average of 10 h per day) when we calculated the mean of cpm for the sample. We established 4 categories of activity: sedentary, light, moderate and vigorous PA, applying the cut-off in points counts per minute (cpm) proposed by Evenson et al.10 in adherence with the IDEFICS study recommendations.11 To determine the compliance with European PA recommendations,12 we counted the minutes of MVPA and sedentary time and calculated the mean cpm.11 We established the compliance with daily MVPA and sedentary time of 60 min and above for each PA level.
The secondary variables were weight status based on the body mass index (BMI) z-score, food intake, energy expenditure during PA, sex, age and parental origin (Spain or Morocco).
We calculated the BMI (kg/m2) using the obtained weight and height measurements and the BMI z-score using the World Health Organization (WHO) growth standards as reference. We classified children under 5 years based on the BMI z-score into five subgroups: underweight (z-score < −1), normal-weight (–1 < z-score ≤ +1), risk of overweight (1 < z-score ≤ 2), overweight (2< z-score ≤3) and obesity (z-score >3). On the other hand, we classified children aged more than 5 years by BMI z-score into four subgroups: underweight (z-score < –1), normal-weight (–1 < z-score ≤ +1), overweight (1 < z-score ≤ 2) and obesity (z-score >2), based on the recommendations of the WHO.16 However, for the subsequent analyses of weight status, we pooled the at-risk and overweight groups for the entire sample.
Food intake was measured by a 24 h dietary recall.17 The dietary recall was completed by two trained nutritionists that interviewed the parents or grandparents of the children. The nutritionists showed the caregivers pictures of food portions to help them to quantify their children's food intake. We calculated the total energy intake (kcal/day), the total daily physical activity (through movements [cpm] recorded by accelerometers), and energy expenditure (kcal/day) by activity applying the work-energy theorem with the ActiLife software: kcals/minute = 0.0000191 × cpm × body mass in kg.
Two trained nutritionists made the auxological measurements with Seca scales (761 Clas IIII; accurate to 0.5 kg) and a Harpenden stadiometer (Holtain Limited, Crymych, Dyfed, UK; accurate to 0.1 cm). We also used 13 triaxial Actigraph GT1M accelerometers that participants wore above the right iliac crest with an adjustable elastic belt, the ActiLife application, the 24 h dietary recalls17 and the EasyDiet programme of the Fundación Española de Dietistas-Nutricionistas (Spanish Foundation of Dietitians-Nutritionists).
Sample sizeWe calculated the sample size sample to determine the significance of the Pearson χ2 test applying the following parameters: a 5% probability of a type I error and 9 degrees of freedom ([4 PA levels – 1] × [4 weight status levels – 1]). With these parameters, we estimated that the required sample size was of at least 136 children.18
Statistical analysisWe described variables by means of absolute and relative frequencies, means and standard deviations. We compared the level of PA with the secondary variables by mean of the χ2 test (in case of qualitative variables) or the Kruskal–Wallis test (in case of quantitative variables) and an ordinal regression model with a logistic function. We used the Kruskal–Wallis test to analyse the associations between BMI and the mean cpm, MVPA and sedentary time. To identify the factors associated with the primary variable (compliance with PA recommendations), we also compared the secondary variables by means of the χ2 test (qualitative variables) or the Kruskal-Wallis test (quantitative variables) and a forward stepwise binary logistic regression, which progressed to four steps. We established the goodness of fit of this method using the likelihood ratio test of parallel lines. We conducted all the analysis for an alfa level of 0.05 and calculated confidence intervals for all relevant parameters. The statistical analysis was performed with the software IBM SPSS Statistics version 19. We defined statistical significance as a p-value of less than 0.05 in any of the tests.
Ethical considerationsThe study protocol was approved by the ethics committee of the Universidad de Alicante before its initiation (18 of March of 2014). We obtained a signed written consent form from the parents of all participants, who had been previously informed by the researchers about the study, and guaranteed adherence to ethical and confidentiality standards.
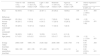
ResultsThe distribution of children across the four PA levels was fairly even; half of the sample had a sedentary or light level of PA and the other half a moderate or vigorous level of PA. As for weight status, a higher percentage of children with a sedentary level of PA (59.4%) had overweight or obesity, whereas only 11.8% of young children with a vigorous level of PA belonged to the obesity group. We found the following factors correlated significantly with a higher level of PA in the multivariable analysis (P < .001) with verified parallel lines (P = .605): lower weight status (B = –1.55; 95% CI, –2.02 to –1.08; P < .001), lower age (B = –1.33; 95% CI, –1.72 to –0.93; P < .001) and higher energy expenditure (B = 0.02; 95% CI, 0.02 to 0.03; P < .001). When it came to energy expenditure, we found that the higher the weight the higher the energy expenditure, as body weight was included in the equation. However, the variables sex (P = .600) and energy intake (P = .363) were not significantly associated with PA level (Table 1).
Physical activity level (sedentary, light, moderate and vigorous)* by sex, BMI group, age, energy intake and energy expenditure in children aged 2–8 years.
| Total N = 136 n (%); median ± IQR | Sedentary n = 32 n (%); median ± IQR | Ligth n = 36n (%); median ± IQR | Moderate n = 34n (%); median ± IQR | Vigorous n = 34 n (%); median ± IQR | Pa | Ordinal regression model | ||
|---|---|---|---|---|---|---|---|---|
| B (95% CI) | P | |||||||
| Boys | 62 (45.6) | 17 (53.1) | 22 (61.1) | 20 (39.2) | 13(38.2) | .109 | −0.19 (−0.88 to 0.51) | .600 |
| BMI group: | ||||||||
| Underweight | 25 (18.4) | 7 (21.9) | 4 (11.1) | 7 (20.6) | 7 (20.6) | .036 | −1.55 (−2.02.to 1.08) | < .001 |
| Normal weight | 35 (25.7) | 6 (18.8) | 6 (16.7) | 11 (32.4) | 12 (35.3) | |||
| Risk of overweight and overweight | 40 (29.4) | 10 (31.3) | 8 (22.2) | 11 (32.4) | 1 (32.4) | |||
| Obesity | 36 (26.5) | 9 (28.1) | 18 (50) | 5 (14.7) | 4 (11.8) | |||
| Age (years) | 5.7 ± 2.5 | 6.0 ± 2.2 | 6.3 ± 3.0 | 5.3 ± 2.7 | 5.3 ± 2.2 | .154 | −1.33 (−1.72 to 0.93) | < .001 |
| Energy intake (kcal/day) | 2083 ± 639 | 1994 ± 751 | 2126 ± 622 | 2036 ± 585 | 2125 ± 709 | .718 | 0.00 (0.00-0.00) | .363 |
| Energy expenditure (kcal/day) | 360 ± 180 | 267 ± 135 | 371 ± 263 | 341 ± 175 | 414 ± 121 | < .001 | 0.02 (0.02 to 0.03) | < .001 |
B, regression coefficient; BMI, body mass index; CI, confidence interval; IQR, interquartile range; n (%), absolute frequency (relative frequency).
Goodness of fit of regression model: χ2 = 96.8, P < .001; p-value for parallel lines: P = .605.
Statistical significance defined as P < 0.05.
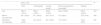
Overall, the level of activity in the sample was light, with a mean of 589 cpm, although this mean was lower in the overweight and obesity groups compared to the normal weight group (P = .003). Children in the overweight and obesity groups also spent less time in MVPA than normal weight children (P = .005). Nevertheless, the whole sample had a mean time spent in MVPA (83.7 min) that exceeded European recommendations, amounting to 10% of the day (sleep hours excluded). We found a similar trend in the time spent in sedentary activity, as young children with overweight spent 22 min more and young children with obesity 32 min more per day in sedentary activities compared to children with normal weight (P = .005). All groups spent between 90 and 130 min a day in sedentary activities, with a mean that amounted to 15.5% of the time spent awake (whole day excluding sleep hours). Surprisingly, the underweight group had a slightly lower mean cpm and time spent in MVPA and a higher mean time spent in sedentary activities compared to the normal weight group (Table 2).
Description of physical activity by weight status in children aged 2–8 years.
| Mean ± SD | *P | |||||
|---|---|---|---|---|---|---|
| Total | Underweight | Normal weight | Risk of overweight or overweight | Obesity | ||
| cpm | 582.9 (121.9) | 592.2 (122.4) | 629.6 (118.2) | 554.4 (138.6) | 555.4 (108.3) | .003 |
| MVPA (minutes/day) | 83.7 (39.4) | 87.1 (44.8) | 99.1 (41.0) | 72.0 (36.8) | 76.5 (34.9) | .005 |
| Sedentary (minutes/day) | 108.8 (45.2) | 92.4 (42.2) | 96.1 (39.8) | 118.3 (48.7) | 128.4 (50.0) | .005 |
cpm, counts per minute; MVPA, moderate to vigorous physical activity; SD, standard deviation.
Statistical significance was defined as P < .05.
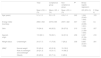
When it came to compliance with European PA recommendations for children, 71.3% of the sample adhered to them, corresponding to 46 girls (62.2%) and 51 boys (82.3%). When we analysed the possible factors influencing compliance, only sex was associated with significant differences in both the bivariate analysis (P = .010) and multivariate analysis (P = .007) analyses. Girls complied with the recommendation of 60 min a day spent in MVPA less frequently than boys (Table 3). We found a significant association with weight status in the bivariate analysis (P = .038), with a higher compliance with these recommendations in the underweight and normal weight groups compared to the overweight group, although the obesity group also exhibited a degree of compliance similar to the underweight and normal weight groups. Weight status was not a significant factor in the multivariable analysis (P = .081).
Compliance with European recommendations for physical activity by age, sex, national origin, energy intake and weight status in children aged 2–8 years.
| Total | Compliance group | Non-compliance group | Pa | Binary logistic regression | |||
|---|---|---|---|---|---|---|---|
| Mean ± SD, n (%) | Mean ± SD, n (%) | Mean ± SD, n (%) | OR (95% CI) | P (Step 4) | |||
| Age (years) | 5.1 ± 1.5 | 5.2 ± 1.5 | 4.9 ± 1.4 | .242 | 1.244 (0.943–1.643) | .123 | |
| Energy intake (kcal/day) | 2063 ± 452 | 2078 ± 465 | 2037 ± 422 | .637 | 1.000 (0.999–1.001) | n/a | |
| Girls | 74 (54.4) | 46 (62.2) | 28 (37.8) | .010 | 3.128 (1.359–7.200) | .007 | |
| Spanish origin | 110 (80.1) | 76 (69.1) | 34 (31.9) | .236 | 0.497 (0.164–1.505) | .216 | |
| Weight status | Underweight | 24 (17.7) | 17 (70.8) | 7 (29.2) | .038 | 0.685 (0.447–1.048) | .081 |
| (BMI)* | Normal weight | 55 (40.4) | 45 (81.8) | 10 (18.2) | |||
| Risk of overweight and overweight | 29 (21.3) | 15 (51.7) | 14 (48.3) | ||||
| Obesity | 28 (20.6) | 20 (71.4) | 8 (28.6) |
BMI, body mass index; CI, confidence interval; n (%), absolute frequency (relative frequency); n/a, not applicable; SD, standard deviation.
Goodness of fit of the multivariate model: χ2 = 12.918; P = .012.
Statistical significance defined as a p-value <0.05.
We did not find a significant association for the rest of the variables (age, parental origin and energy intake) in any of the analyses. Most of the sample had parents of Spanish origin (Table 3). Similarly, we only found differences in the probability of complying with PA recommendations between sexes, with boys complying with recommendations to a greater extent, although we also found a decreasing tendency in association with higher weight status (Fig. 1).
Discussion
Higher levels of PA during the day were associated with lower BMI groups and ages. Compliance with the European recommendations was associated with male sex and lower weight status. When it came to weight status, we observed that children with overweight and obesity spent more time engaged in sedentary and light PA and considerably less time engaged in vigorous PA. Our analysis of the compliance with European recommendations for PA in children showed that young children with overweight and obesity spent less time engaged in MVPA compared to children with normal weigh. Similar results have been found in a study in Canadian pre-schoolers reported similar results, as the lower-BMI group spent more time in MVPA,19 and also in European children, with overweight and obese children spending 24 fewer minutes per day less in vigorous activity compared to children with normal weight.20 Furthermore, there is evidence that accelerometers are very effective for the purpose of assessing the intensity of physical activity intensity and of comparing physical activity between normal weight and overweight children.21 When it came to the time spent in sedentary activities, we did not only find a higher proportion of obese children with a sedentary level of PA compared to a vigorous level of PA, but children with obesity also spent more time per day in sedentary activities (32 more minutes per day in sedentary PA compared to children with normal weight). The link between sedentary habits and childhood obesity is well known,22–26 but recently sedentary habits have been linked with all-cause mortality.27
Similarly, we found an inverse correlation between the level of PA and the age. A study in a sample of French children and youth found that very young children engaged in PA more than schoolchildren and adolescents.28 Another study found that younger children engaged in higher levels of PA in a sample of preschool-aged children.19 When it came to sex, we found a greater frequency of vigorous PA in boys, although the difference was not statistically significant. These results were confirmed in the bivariate and multivariate analyses of the compliance with the recommended 60 min per day of MVPA, which was achieved by a higher proportion of boys compared to the girls. These results were consistent with those of previous studies in European children, such as the IDEFICS study, which found differences in the percentage of children that met these recommendations between countries, but with percentages always being higher in boys,11 or a recent study with a sample of European children, including children from Spain, that found that girls spent 36 fewer minutes a day in MVPA compared to boys20 or a meta-analysis in preschool-aged children that found a higher mean cpm in boys.29 However, a study on Canadian pre-schoolers did not find differences between the sexes.30
We found a mean cpm in the overall sample that corresponded to a light level of PA. This mean is very similar to the means reported for other European countries in the IDEFICS study11 and slightly higher compared to other studies in children in other European countries,20 a difference that could be due to the fact that we collected the data in spring, when children are usually more active than in winter.31 In contrast, one meta-analysis found a higher mean of 714 cpm, a difference that may be due to this review only including studies on younger children aged 3 to 5 years old,29 as we did also confirm that the level of PA was higher in younger children in our sample. The proportion of the sample that complied with MVPA recommendations in our study (70%) was similar to the proportion found in another European study, which found compliance with current European recommendations in 62.3% of children.20 At any rate, compliance was considerably lower in Canadian children and adolescents, with only 4% of girls and 9% of boys meeting these recommendations due to the authors specifying that the recommendations should be met at least 6 days per week.31 Compliance with the MVPA recommendations was also low in most of the countries included in the IDEFICS study, with the proportion of girls that met the recommendations ranging from 2% (Cyprus) to 14.7% (Sweden) and the proportion of boys ranging from 9.5% (Italy) to 34.1% (Belgium).11 A lower level of compliance has also been found in children in the United States, with a mean time spent in MVPA of 37 min per day, although the authors of this study used different cut-off points to define this level of PA.32
Although dietary reference intakes for energy in childhood have been calculated to achieve a balance of energy intake and expenditure based on the level of physical activity to promote health and adequate growth in children, determining energy intake and energy expenditure in children are both challenging.33 In the case of energy expenditure, we found that BMI was directly correlated with energy expenditure during PA. This is due to the fact that the equation used for its calculation includes the body weight, but equations tend to overestimate energy needs in preschool-aged children.33 In the case of energy intake, the 24 h recall is a widely used tool to record dietary intake, but has several well-known limitations, including that it depends on the reporter having a correct recollection and the good will to provide accurate information17; the selective forgetting of foods and the difficulty of accurately assessing the actual amounts of food consumed.34 All these disadvantages and the fact that in this case the reporters were the parents, who may not have spent the whole day with their children because of their work, may be involved in the absence of statistically significant results in the comparison of energy intake and weight status.
Although weight status was not significantly associated with compliance of MVPA, children with obesity spent fewer minutes in MVPA and had lower mean cpm per day, spent more minutes in sedentary PA and had a higher energy expenditure during PA. Therefore, we need programmes to promote an increase in the time spent in MVPA and a decrease in the time spent in sedentary activities in children aimed at decreasing childhood obesity.11,19,20,32,35–37
The main limitation of this study is that it was carried out in a small population. Therefore, it is necessary to replicate the study in other communities before the results can be extrapolated to the general population in this age range. Another limitation is that we only collected one day’s work of dietary intake data, when ideally the 24 -h recall should be completed in different days to minimize its limitations. Moreover, the data for the recall was obtained from the parents or primary caregivers, who may not have spent the whole day with the child or not have provided accurate information, aspects that may have an impact on the significant of dietary intake data. For the purpose of future research, we recommend obtaining 24 h recalls for several days or the use of food diaries to collect dietary intake data.
The strength of this study is the evidence it has found about the variables that have an impact on compliance with European recommendations on PA. Furthermore, by monitoring participants for 24 h a day both on weekdays and weekends, we were able to obtain more accurate measurements of overall PA in young children, including time spent in sedentary or moderate-to-vigorous activity. This very important due to the need to revert the prevalence of obesity in early childhood by promoting PA and reducing sedentary behaviours.
The most significant contribution of our study to clinical practice is the collection of objective measurements of PA for 5 full consecutive days and the identification of factors (sex, age and weight status) that influence compliance with European recommendations for MVPA. Since there is evidence that compliance with these recommendations and the reduction of time spent in sedentary activities are associated with healthier weight status, we recommend that future studies use accelerometers throughout the entire day to quantify PA and include these influential factors for the purpose of developing appropriate PA interventions to improve weight status in early childhood.
We thank the City Council of Rafal for its cooperation and Gaspar Alemañ for the review of the English version of this paper.
Please cite this article as: Gutierrez-Hervas A, et al. ¿Qué variables influyen en el cumplimiento de las recomendaciones de actividad física en preescolares? An Pediatr (Barc). 2020;92:156–164.
