
The transport of critically ill pediatric patients is associated with the occurrence of adverse events (AE) and incidents that worsen patient outcomes. The primary objective was to determine the AEs and incidents that occurred during interhospital transport and to analyze changes after the implementation of safety measures. The secondary objective was to analyze the association between the presence of family accompanying the patient in the ambulance and the number of incidents.
Material and methodsProspective and observational study, including patients transferred by a specialized pediatric transport team during two periods: period 1 (2017-2018) and period 2 (2022-2023). We compared incidents in the two periods after the implementation of safety measures. We also compared the presence of parents during the transport and its association with the occurrence of incidents.
ResultsWe analyzed 1369 transports. A total of 273 (20.7%) patients experienced some incident during transport, with a lower percentage in period 2 (29.2% vs 12.0%; P < .001), especially in patients with clinical incidents (20.3% vs 5.1%; P < .001). Incidents involving a lack of devices or supplies were least frequent, with no differences between the two periods.
Family accompanied the patient in the ambulance more frequently in the second period (76.0% vs 82.6%; P = .001), a finding that was not associated with an increase in incidents, with a higher percentage of transports with parents in the care cabin.
ConclusionsInterhospital pediatric transport performed by teams trained in clinical safety leads to few incidents. Implementing measures to improve patient safety can reduce the frequency of these incidents and optimize care quality.
El transporte de pacientes pediátricos críticos se relaciona con la aparición de eventos adversos (EA) e incidentes que empeoran su pronóstico. El objetivo principal fue conocer los incidentes producidos durante el transporte interhospitalario y analizar los cambios tras la implementación de medidas de seguridad. El objetivo secundario fue relacionar el acompañamiento familiar en la ambulancia con el número de incidentes.
Material y métodosEstudio prospectivo y observacional, incluyendo los pacientes trasladados por un equipo de transporte pediátrico especializado durante dos periodos: periodo 1 (2017-2018) y periodo 2 (2022-2023). Se compararon los incidentes entre los dos periodos tras haber implementado medidas de seguridad. Además, se comparó la presencia de padres en el transporte y su relación con los incidentes.
ResultadosSe analizaron 1369 transportes. En total, 273 (20,7%) pacientes presentaron algún incidente durante el transporte, aunque el porcentaje fue menor en el periodo 2 (29,2 vs. 12,0%, p < 0,001), especialmente de pacientes con incidentes clínicos (20,3 vs. 5,1%, p < 0,001). Los incidentes respecto a la pérdida de dispositivos y material fueron los menos frecuentes, sin diferencias entre los dos periodos.
Hubo un mayor acompañamiento por parte de los familiares en la ambulancia en el segundo periodo (76,0% vs. 82,6%, p = 0,001), sin relacionarse con un aumento en los incidentes, con mayor porcentaje de padres en la cabina asistencial.
ConclusionesEl transporte interhospitalario pediátrico realizado por equipos formados en seguridad clínica conlleva pocos incidentes. Implementar medidas para mejorar la seguridad del paciente permite reducir estos incidentes y optimizar la calidad asistencial.

In Catalonia, pediatric and neonatal intensive care units (ICUs) are located in the main cities. The management of patients in higher-level referral facilities has been found to improve outcomes and to be cost-effective.1–3 This centralization generates a need for the interfacility transport (IFT) of critically ill patients from lower-care facilities.4,5
Thirty years ago, specific pediatric and neonatal transport units were created in the framework of the emergency medical services (EMS) system to handle most IFTs in critically ill pediatric or neonatal patients. At present, this resource comprises two ground critical/emergency care ambulances, one air ambulance and one ground advanced life support ambulance, with additional nursing staff during the winter months.
The transport team consists of a pediatrician, a nurse and an emergency medical technician, all of them with specific training and experience in pediatric and neonatal intensive care and specialized pediatric transport.6
The medical complexity of transported patients may carry a risk of unintended adverse events (AEs), especially in pediatric patients, who are more vulnerable to experiencing medical errors, due to either incorrect dose calculation for medication or in relation to decision-making. The impact of these errors is exacerbated in critically ill patients.7,8 Given the high risk of morbidity and mortality, the quality of IFT depends both on the skills and specialization of the transport team and the adequate stabilization of the patient at the sending hospital.9–11
Numerous publications have addressed the need to promote a patient safety culture to improve health care quality, decrease the incidence of AEs and provide learning opportunities.8,11–13
Performance of IFT by specialized pediatric transport teams has been found to reduce the frequency of AEs and mortality.9,10,14 This type of transport involves longer stabilization times, dispensing with the “golden hour” principle for IFT in order to enable delivery of intensive care to the patients.10,15 Numerous studies have addressed this aspect, but the comparison of their results is hindered by the heterogeneity of transport teams, health care systems and the definitions of AE and severity.16–18 When it came to Spain, we only found two articles conducted in the country that focused on safety during pediatric transport.19,20
Medicine, and pediatric care in particular, is increasingly taking a family-centered approach, which also applies to interfacility transport and may have an impact on the safety of patient transport.
The primary objective of our study was to establish the characteristics of the incidents that took place during ground interfacility transport and evaluate the changes occurred after the implementation of safety measures. The secondary objective was to determine the frequency with which family members accompanied the patient in the ambulance and the association of this aspect with incidents during transport.
Material and methodsWe conducted a prospective observational study. The sample included every patient aged 0 to 18 years transported by a specialized pediatric and neonatal transport team. There were no exclusion criteria.
There were two data collection periods: from July 1, 2017 to June 30, 2018 (period 1) and from October 1, 2022 to September 30, 2023 (period 2).
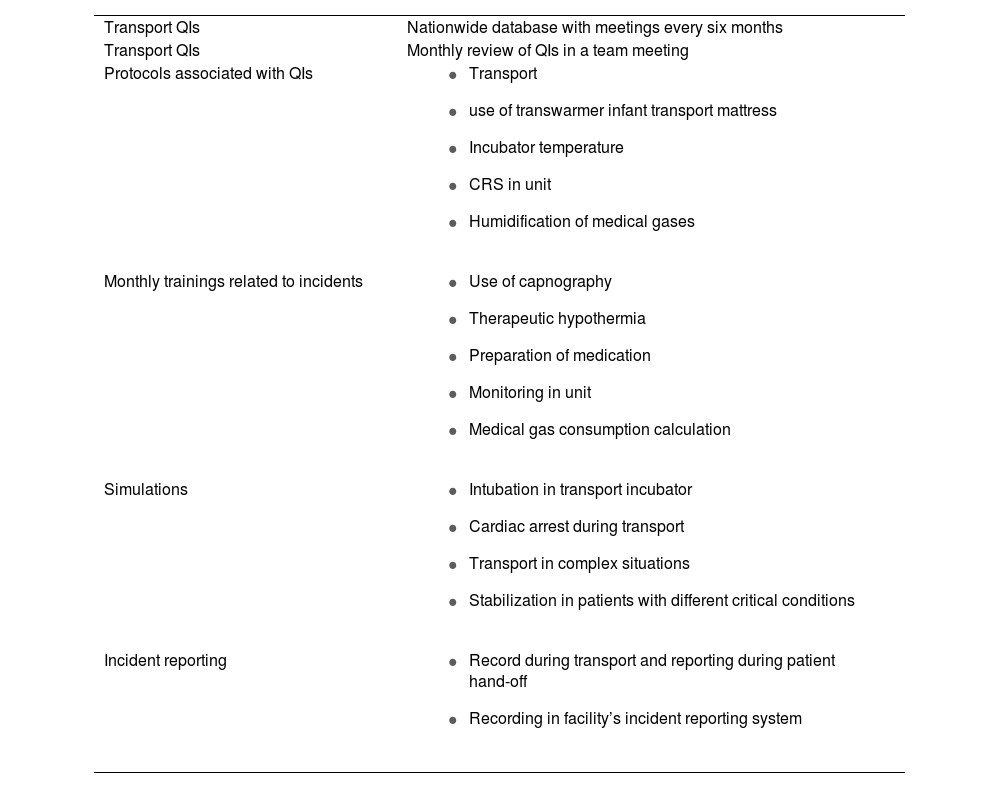
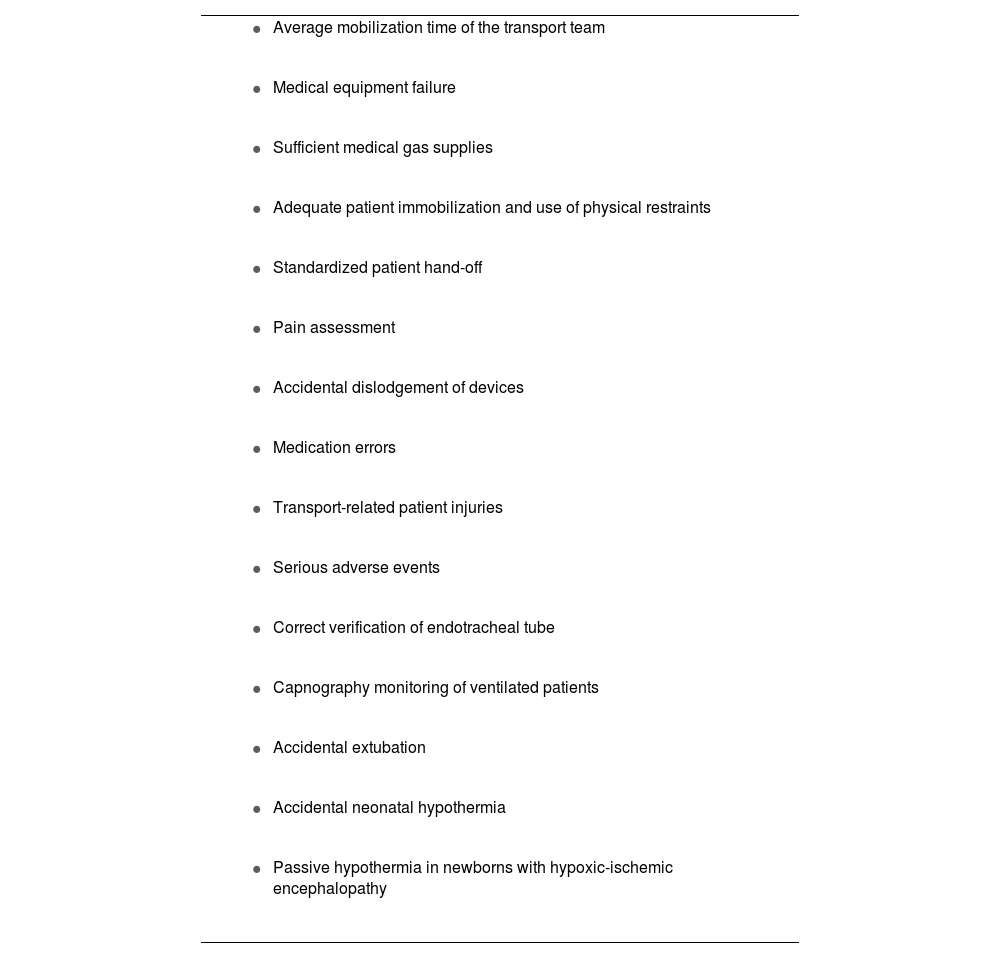
Between the two periods, the EMS safety group carried out a preliminary analysis of the data and decided to implement various measures (Table 1): implementation of the transport quality indicators introduced nationwide in 2018 (Table 2),13 the creation of a working group in the transport unit to monitor safety indicators and disseminate the corresponding results, incident reporting and analysis, development of protocols and a checklist and performance of simulations based on specific scenarios. We decided to let a few years elapse before repeating the assessment of the outcomes of interest to allow assimilation by the team of the introduced measures and dynamics.
Implemented measures.
| Transport QIs | Nationwide database with meetings every six months |
| Transport QIs | Monthly review of QIs in a team meeting |
| Protocols associated with QIs |
|
| Monthly trainings related to incidents |
|
| Simulations |
|
| Incident reporting |
|
QI, quality indicator.
Quality indicators (SECIP 2018).
|
|
|
|
|
|
|
|
|
|
|
|
|
|
|
Based on the definitions published by the World Health Organization in 2009,21 an incident is any event that causes or has the potential to cause harm, and an AE is an incident that causes harm to the patient. In our study, we considered all incidents that could have caused severe harm to a patient AEs, while also including them in the calculation of incidents to maximize the opportunities for improvement.
VariablesWe collected data on demographic and clinical characteristics, such as age, sex and reason for transport, in addition to the interventions carried out by the transport team. These interventions included respiratory support (supplemental oxygen, high-flow nasal cannula, non-invasive ventilation [NIV], conventional mechanical ventilation [MV]) and hemodynamic support (fluid replacement, inotropes). We also documented stabilization and transport times.
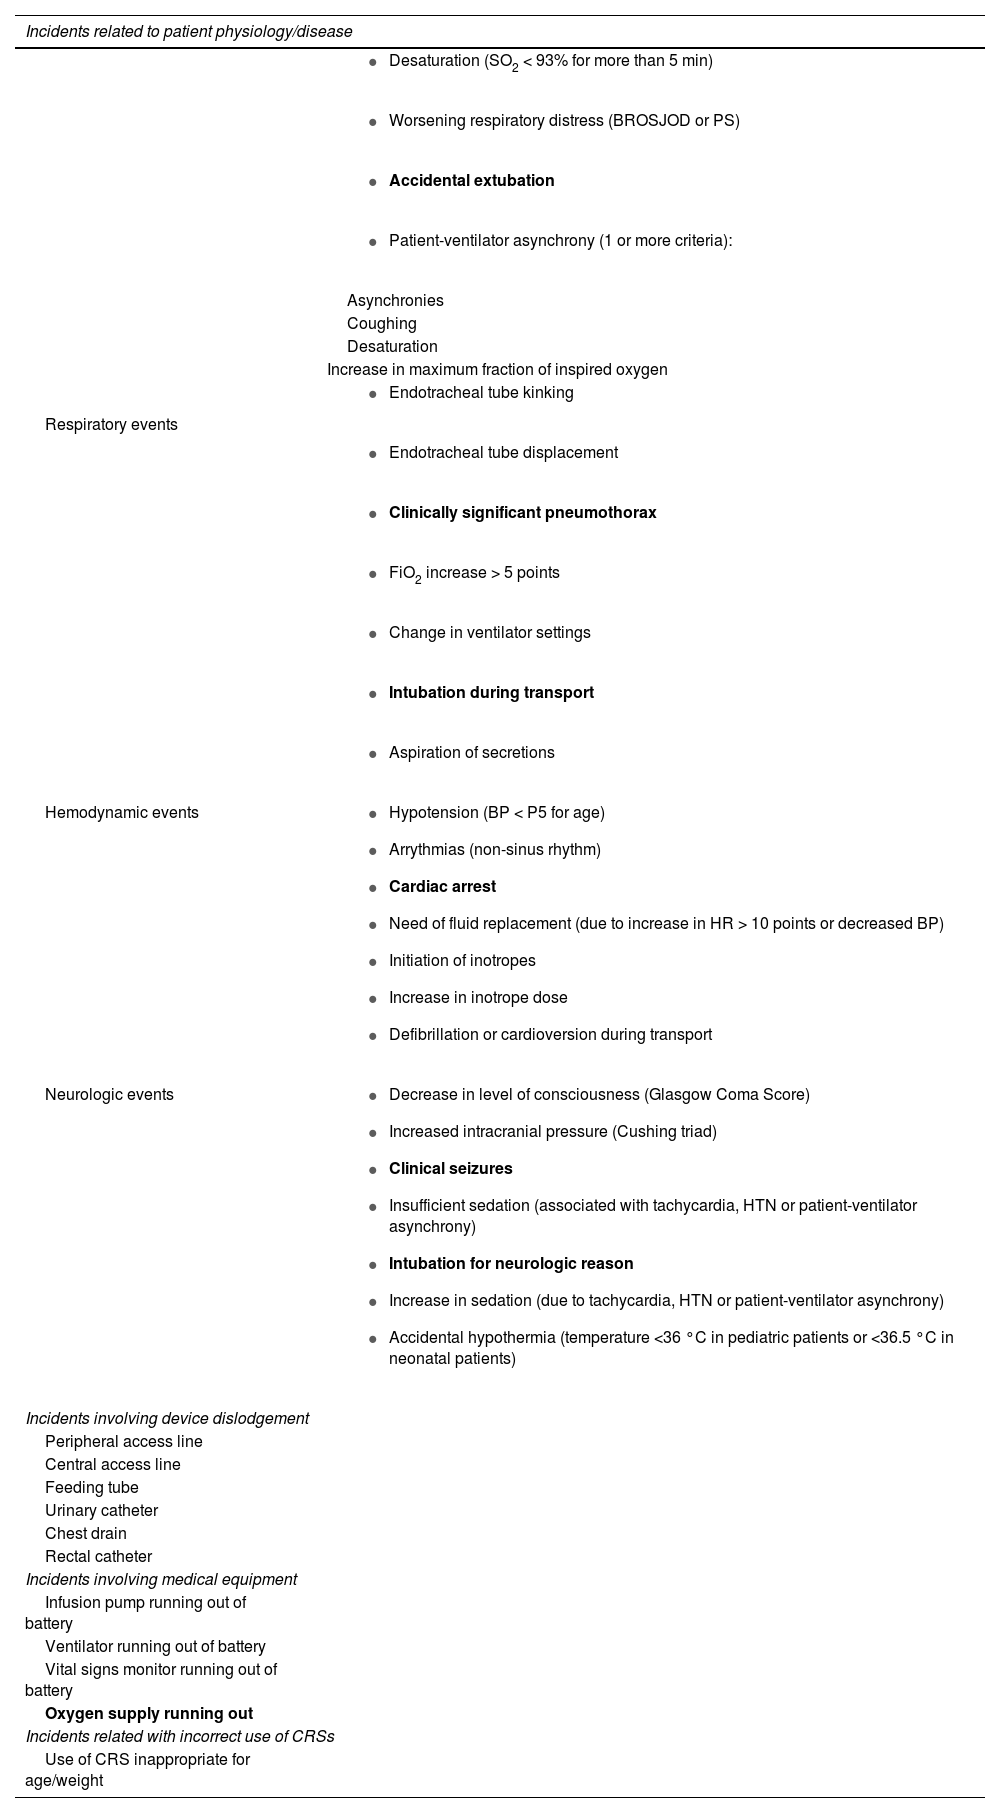
We collected data on specific variables to record incidents during transport, which were classified based on whether they were associated with the patient’s physiology or disease process, medical devices, medical supplies and the incorrect use of child restraint systems (CRSs). Table 3 presents a summary of these variables. The variables presented in boldface are those associated with AEs.
Incident classification.
| Incidents related to patient physiology/disease | |
|---|---|
| Respiratory events |
|
| |
| |
| |
| Asynchronies | |
| Coughing | |
| Desaturation | |
| Increase in maximum fraction of inspired oxygen | |
| |
| |
| |
| |
| |
| |
| |
| Hemodynamic events |
|
| Neurologic events |
|
| Incidents involving device dislodgement | |
| Peripheral access line | |
| Central access line | |
| Feeding tube | |
| Urinary catheter | |
| Chest drain | |
| Rectal catheter | |
| Incidents involving medical equipment | |
| Infusion pump running out of battery | |
| Ventilator running out of battery | |
| Vital signs monitor running out of battery | |
| Oxygen supply running out | |
| Incidents related with incorrect use of CRSs | |
| Use of CRS inappropriate for age/weight | |
Abbreviations: BP, blood pressure; BROSJOD, Hospital Sant Joan de Déu bronchiolitis score; CRS, child restraint system; FiO2, fraction of inspired oxygen; HR, heart rate; HTN, arterial hypertension; P, percentile; PS, Pulmonary Score; SO2, oxygen saturation.
Variables presented in boldface were involved in adverse events (AEs).
Lastly, we documented whether a parent accompanied the child during transport, and whether the parent traveled in the patient compartment or the driver’s compartment.
Statistical analysisThe statistical analysis was performed with the software package IBM SPSS Statistics version 29.0. We summarized categorical variables as absolute frequencies and percentages and continuous variables as median and interquartile range (IQR), as the data did not follow a normal distribution. We compared categorical data with the χ2 or Fisher exact test and continuous data with the Mann-Whitney U test. Statistical significance was defined as a P value of less than 0.05.
Ethical considerationsThe study was approved By the Medical Ethics Committee of the hospital (files PIC-87-17 and PIC-101-22) and we obtained signed informed consent from the parents in every case.
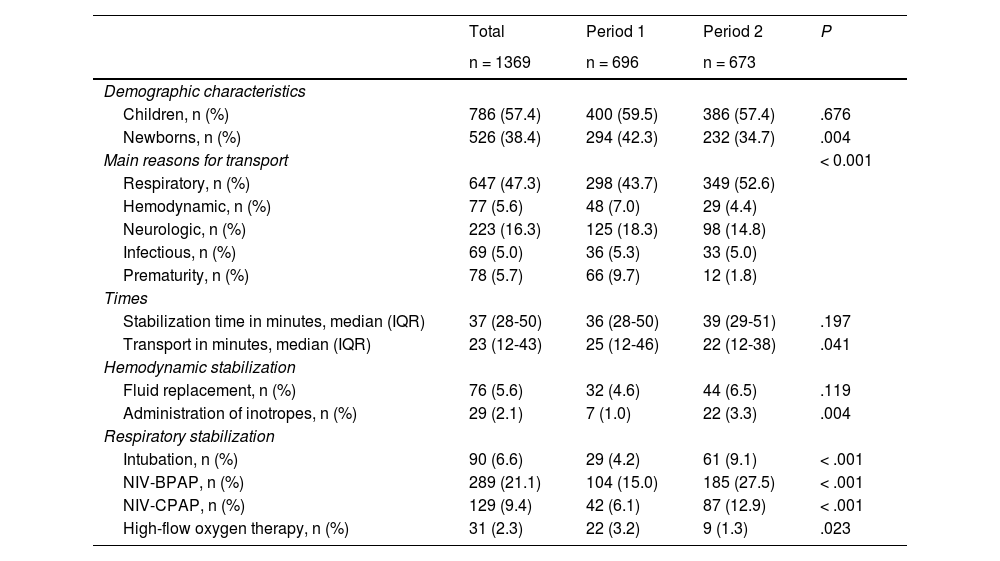
ResultsThe analysis included 1369 transports: 696 (50.8%) in period 1 and 673 (49.2%) in period 2. Of the total patients, 61.4% were pediatric patients and 38.4% were neonatal patients (chronological age < 30 days). When it came to the sex distribution, 786 (57.4%) were male. The median stabilization time was 37 minutes (IQR, 28-50), and the median transport time was 23 minutes (IQR, 12-43).
As regards the level of complexity, 960 patients (73.4%) required transport to a pediatric or neonatal ICU. In addition, 418 patients (30.5%) required NIV: bilevel positive airway pressure (BPAP) in 289 (21.1%) and continuous positive airway pressure (CPAP) in 129 (9.4%). Mechanical ventilation was used during transport in 90 patients (6.6%). With respect to hemodynamic stabilization, 76 patients (5.6%) required fluid replacement and 29 (2.1%) treatment with inotropes. Table 4 presents the differences between the two periods.
Distribution of the Sample by Period.
| Total | Period 1 | Period 2 | P | |
|---|---|---|---|---|
| n = 1369 | n = 696 | n = 673 | ||
| Demographic characteristics | ||||
| Children, n (%) | 786 (57.4) | 400 (59.5) | 386 (57.4) | .676 |
| Newborns, n (%) | 526 (38.4) | 294 (42.3) | 232 (34.7) | .004 |
| Main reasons for transport | < 0.001 | |||
| Respiratory, n (%) | 647 (47.3) | 298 (43.7) | 349 (52.6) | |
| Hemodynamic, n (%) | 77 (5.6) | 48 (7.0) | 29 (4.4) | |
| Neurologic, n (%) | 223 (16.3) | 125 (18.3) | 98 (14.8) | |
| Infectious, n (%) | 69 (5.0) | 36 (5.3) | 33 (5.0) | |
| Prematurity, n (%) | 78 (5.7) | 66 (9.7) | 12 (1.8) | |
| Times | ||||
| Stabilization time in minutes, median (IQR) | 37 (28-50) | 36 (28-50) | 39 (29-51) | .197 |
| Transport in minutes, median (IQR) | 23 (12-43) | 25 (12-46) | 22 (12-38) | .041 |
| Hemodynamic stabilization | ||||
| Fluid replacement, n (%) | 76 (5.6) | 32 (4.6) | 44 (6.5) | .119 |
| Administration of inotropes, n (%) | 29 (2.1) | 7 (1.0) | 22 (3.3) | .004 |
| Respiratory stabilization | ||||
| Intubation, n (%) | 90 (6.6) | 29 (4.2) | 61 (9.1) | < .001 |
| NIV-BPAP, n (%) | 289 (21.1) | 104 (15.0) | 185 (27.5) | < .001 |
| NIV-CPAP, n (%) | 129 (9.4) | 42 (6.1) | 87 (12.9) | < .001 |
| High-flow oxygen therapy, n (%) | 31 (2.3) | 22 (3.2) | 9 (1.3) | .023 |
Abbreviations: BPAP, bilevel positive airway pressure; CPAP, continuous positive airway pressure; IQR, interquartile range; NIV, non-invasive ventilation.
In period 2, the percentage of neonatal patients was smaller (42.3% vs 34.7%; P = .004). In addition, patients in period 2 were more medically complex, as there was a higher frequency of inotrope administration (P = .004) and respiratory support with MV or NIV (P < .001).
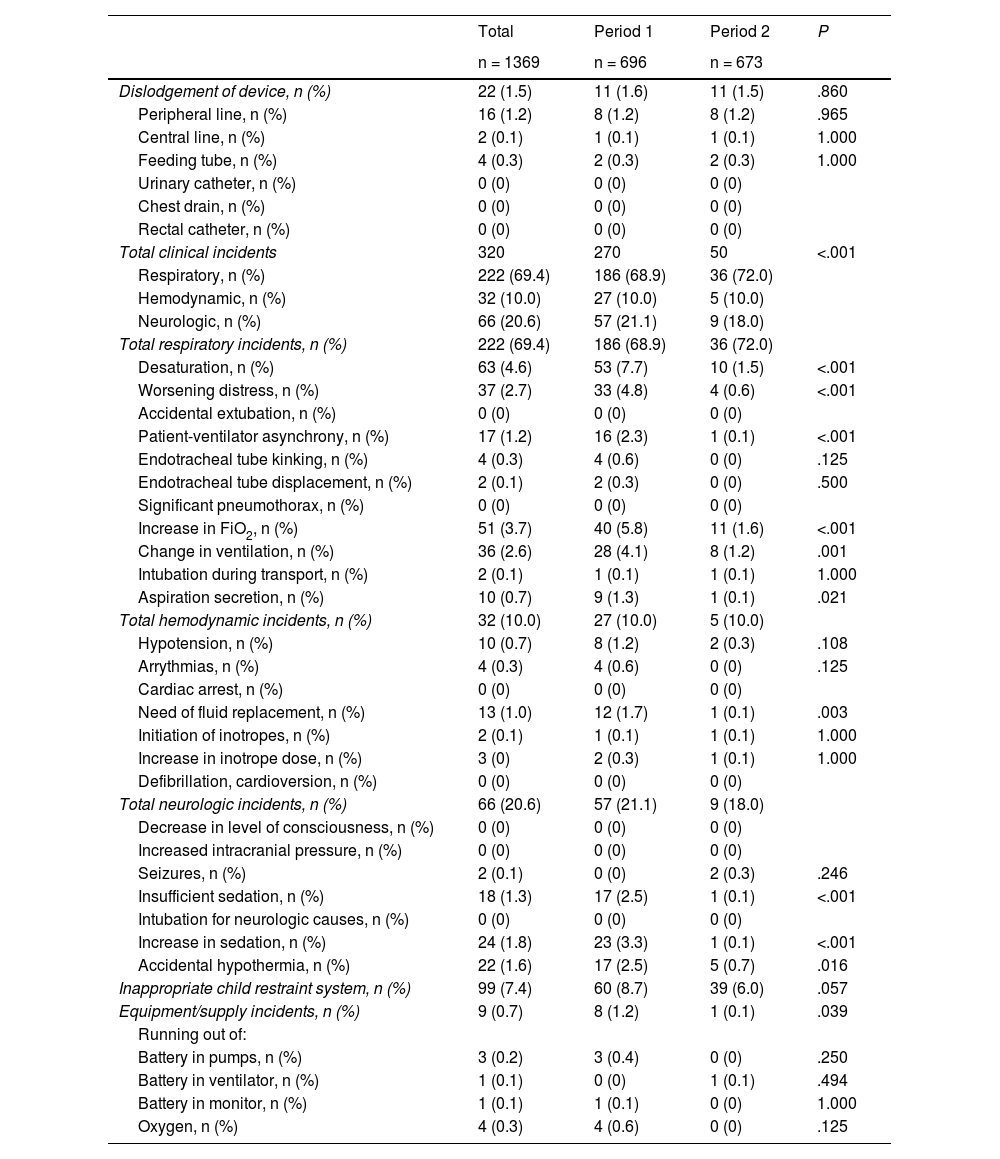
There were a total of 450 documented incidents involving 273 patients (20.7% of total transports). Of these incidents, 349 (77.6%) occurred in period 1 and 101 (22.4%) in period 2. Table 5 summarizes the recorded incidents and compares the incidents in the two study periods. Dislodgment of devices occurred in 1.5% of the total transports, with no differences between the two periods.
Incidents During Transport.
| Total | Period 1 | Period 2 | P | |
|---|---|---|---|---|
| n = 1369 | n = 696 | n = 673 | ||
| Dislodgement of device, n (%) | 22 (1.5) | 11 (1.6) | 11 (1.5) | .860 |
| Peripheral line, n (%) | 16 (1.2) | 8 (1.2) | 8 (1.2) | .965 |
| Central line, n (%) | 2 (0.1) | 1 (0.1) | 1 (0.1) | 1.000 |
| Feeding tube, n (%) | 4 (0.3) | 2 (0.3) | 2 (0.3) | 1.000 |
| Urinary catheter, n (%) | 0 (0) | 0 (0) | 0 (0) | |
| Chest drain, n (%) | 0 (0) | 0 (0) | 0 (0) | |
| Rectal catheter, n (%) | 0 (0) | 0 (0) | 0 (0) | |
| Total clinical incidents | 320 | 270 | 50 | <.001 |
| Respiratory, n (%) | 222 (69.4) | 186 (68.9) | 36 (72.0) | |
| Hemodynamic, n (%) | 32 (10.0) | 27 (10.0) | 5 (10.0) | |
| Neurologic, n (%) | 66 (20.6) | 57 (21.1) | 9 (18.0) | |
| Total respiratory incidents, n (%) | 222 (69.4) | 186 (68.9) | 36 (72.0) | |
| Desaturation, n (%) | 63 (4.6) | 53 (7.7) | 10 (1.5) | <.001 |
| Worsening distress, n (%) | 37 (2.7) | 33 (4.8) | 4 (0.6) | <.001 |
| Accidental extubation, n (%) | 0 (0) | 0 (0) | 0 (0) | |
| Patient-ventilator asynchrony, n (%) | 17 (1.2) | 16 (2.3) | 1 (0.1) | <.001 |
| Endotracheal tube kinking, n (%) | 4 (0.3) | 4 (0.6) | 0 (0) | .125 |
| Endotracheal tube displacement, n (%) | 2 (0.1) | 2 (0.3) | 0 (0) | .500 |
| Significant pneumothorax, n (%) | 0 (0) | 0 (0) | 0 (0) | |
| Increase in FiO2, n (%) | 51 (3.7) | 40 (5.8) | 11 (1.6) | <.001 |
| Change in ventilation, n (%) | 36 (2.6) | 28 (4.1) | 8 (1.2) | .001 |
| Intubation during transport, n (%) | 2 (0.1) | 1 (0.1) | 1 (0.1) | 1.000 |
| Aspiration secretion, n (%) | 10 (0.7) | 9 (1.3) | 1 (0.1) | .021 |
| Total hemodynamic incidents, n (%) | 32 (10.0) | 27 (10.0) | 5 (10.0) | |
| Hypotension, n (%) | 10 (0.7) | 8 (1.2) | 2 (0.3) | .108 |
| Arrythmias, n (%) | 4 (0.3) | 4 (0.6) | 0 (0) | .125 |
| Cardiac arrest, n (%) | 0 (0) | 0 (0) | 0 (0) | |
| Need of fluid replacement, n (%) | 13 (1.0) | 12 (1.7) | 1 (0.1) | .003 |
| Initiation of inotropes, n (%) | 2 (0.1) | 1 (0.1) | 1 (0.1) | 1.000 |
| Increase in inotrope dose, n (%) | 3 (0) | 2 (0.3) | 1 (0.1) | 1.000 |
| Defibrillation, cardioversion, n (%) | 0 (0) | 0 (0) | 0 (0) | |
| Total neurologic incidents, n (%) | 66 (20.6) | 57 (21.1) | 9 (18.0) | |
| Decrease in level of consciousness, n (%) | 0 (0) | 0 (0) | 0 (0) | |
| Increased intracranial pressure, n (%) | 0 (0) | 0 (0) | 0 (0) | |
| Seizures, n (%) | 2 (0.1) | 0 (0) | 2 (0.3) | .246 |
| Insufficient sedation, n (%) | 18 (1.3) | 17 (2.5) | 1 (0.1) | <.001 |
| Intubation for neurologic causes, n (%) | 0 (0) | 0 (0) | 0 (0) | |
| Increase in sedation, n (%) | 24 (1.8) | 23 (3.3) | 1 (0.1) | <.001 |
| Accidental hypothermia, n (%) | 22 (1.6) | 17 (2.5) | 5 (0.7) | .016 |
| Inappropriate child restraint system, n (%) | 99 (7.4) | 60 (8.7) | 39 (6.0) | .057 |
| Equipment/supply incidents, n (%) | 9 (0.7) | 8 (1.2) | 1 (0.1) | .039 |
| Running out of: | ||||
| Battery in pumps, n (%) | 3 (0.2) | 3 (0.4) | 0 (0) | .250 |
| Battery in ventilator, n (%) | 1 (0.1) | 0 (0) | 1 (0.1) | .494 |
| Battery in monitor, n (%) | 1 (0.1) | 1 (0.1) | 0 (0) | 1.000 |
| Oxygen, n (%) | 4 (0.3) | 4 (0.6) | 0 (0) | .125 |
Abbreviation: FiO2, fraction of inspired oxygen.
The most frequent respiratory incidents were desaturation (n = 63 [4.6%]) and the need to increase the FiO2 during transport (n = 51 [3.7%]). None of the patients experienced accidental extubation. In each period, one patient required intubation during transport. When it came to hemodynamic incidents, while they were infrequent (1.7%), there was a clear decrease in the second period (0.6% in period 2 vs 2.8% in period 1; P = .002). As for neurological incidents, fewer patients required an increase in sedation during transport in the second period (3.3% vs 0.1%; P < .001) and there was also improvement in the frequency of accidental hypothermia (2.5% vs 0.7%, P = .016).
Incidents concerning the incorrect use of CRSs amounted to 7.4%, although we observed an improving trend in the second period (8.7% vs 6.0%; P = .057). Lastly, we found that incidents related to equipment and supplies were the least frequent (0.7%). The only recorded type of incident that increased in the second period was the development of seizures during transport, which occurred in two patients.
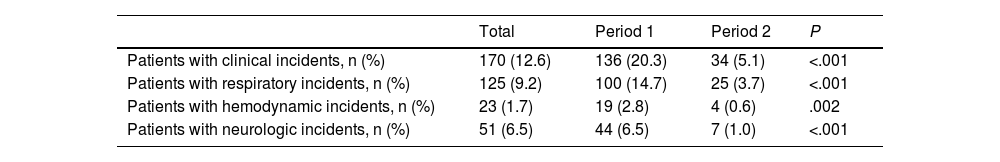
The percentage of patients who experienced an incident was significantly lower in period 2 (29.2 vs 12.0%; P < .001), as was the number of patients who experienced clinical incidents, of 5.1% in period 2 compared to 20.3% in period 1 (P < .001) (Table 6).
Frequency of incidents.
| Total | Period 1 | Period 2 | P | |
|---|---|---|---|---|
| Patients with clinical incidents, n (%) | 170 (12.6) | 136 (20.3) | 34 (5.1) | <.001 |
| Patients with respiratory incidents, n (%) | 125 (9.2) | 100 (14.7) | 25 (3.7) | <.001 |
| Patients with hemodynamic incidents, n (%) | 23 (1.7) | 19 (2.8) | 4 (0.6) | .002 |
| Patients with neurologic incidents, n (%) | 51 (6.5) | 44 (6.5) | 7 (1.0) | <.001 |
Lastly, we calculated the frequency with which patients were accompanied by a family member in the ambulance. In total, 1052 patients (79.3%) out of 1326 (this variable was not documented in 43 patients) were accompanied, with a significant increase in the second period: 516 children (76.0%) in period 1 compared to 536 (82.8%) in period 2 (P = .002). Parents accompanied the patient in the patient compartment of the ambulance more frequently in period 2 (59.4% vs 43.9%; P < .001).
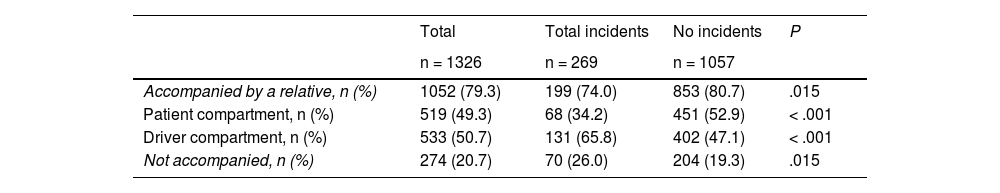
The analysis of the association between the presence of an accompanying relative and incidents during transport showed fewer incidents in transports in which the patient was accompanied (80.7% vs 74.0%, P = .015) (Table 7). In 65.8% of the cases of accompanied patients who experienced incidents, the parents were in the driver’s compartment. However, we found no significant differences between accompanied patients who experienced incidents compared to unaccompanied patients.
Frequency of relatives accompanying patients in relation to the incidence of adverse events.
| Total | Total incidents | No incidents | P | |
|---|---|---|---|---|
| n = 1326 | n = 269 | n = 1057 | ||
| Accompanied by a relative, n (%) | 1052 (79.3) | 199 (74.0) | 853 (80.7) | .015 |
| Patient compartment, n (%) | 519 (49.3) | 68 (34.2) | 451 (52.9) | < .001 |
| Driver compartment, n (%) | 533 (50.7) | 131 (65.8) | 402 (47.1) | < .001 |
| Not accompanied, n (%) | 274 (20.7) | 70 (26.0) | 204 (19.3) | .015 |
| Clinical incidents | No clinical incidents | P | ||
|---|---|---|---|---|
| n = 168 | n = 1158 | |||
| Accompanied by a relative, n (%) | 1052 (79.3) | 128 (76.2) | 924 (79.8) | .281 |
| Patient compartment, n (%) | 519 (49.3) | 32 (25.0) | 482 (52.7) | < .001 |
| Driver compartment, n (%) | 533 (50.7) | 96 (75.0) | 432 (47.3) | < .001 |
| Not accompanied, n (%) | 274 (20.7) | 40 (23.8) | 234 (20.2) | .281 |
In this study, we analyzed the incidents that occurred in transports performed by a specialized pediatric and neonatal transport team with 30 years’ experience.
The overall incidence of incidents was 20%, similar to the incidence reported by other studies,19,22 but showing opportunity for improvement compared to recent studies in which the incidence of AEs was approximately 5%.18,23 We believe that these differences could be due to the fact that we gave all incidents in our study the same weight, whether they involved a poorly secured child restraint system or the development of seizures during transport. We also analyzed, as independent variables, physiological events (such as desaturation) and medical interventions (such as increasing the FiO2 or changing ventilator settings), since, if the ideal transport is one where nothing needs to be done, instances of the patient worsening and the necessary actions that are taken both need to be documented. This may have led to overestimation of the volume of incidents in our study, and, if we focus exclusively in severe AEs, we find that they were rare (4 AEs over four years and 1369 transports: 2 intubations during transport and 2 cases of seizures). Notwithstanding, we found a significant improvement in the frequency of incidents between the two periods (period 1, 29.2% vs period 2, 12.0%; P < .001), especially clinical incidents (20.3% vs 5.1%; P < .001). This is even more relevant if we consider that patients in period 2 were more medically complex and required respiratory support and treatment with inotropes more frequently.
There is no consensus on the different types of AEs and incidents, and each study includes those deemed suitable by the authors, so they are classified or stratified in various ways. Studies like the one conducted by Singh et al.24 used pre-existing consensus-based definitions established at the national level. However, in our case, transport quality indicators were not defined by consensus until 2018,13 so we could not apply them as study variables, although it was possible to use them to guide interventions to mitigate transport incidents.
The measures implemented after obtaining the results for the first phase of the study contributed to the improvement of outcomes. Monitoring and analyzing incidents promoted a safety culture in the transport team. Monthly trainings and simulations allowed training the teams in pretransport patient stabilization. Maintaining high quality in transport requires not only specialized teams but also continuing education, in which simulation plays an important role, and the capability to record and analyze incidents to identify areas of improvement.8,11,12
Severity in our study was defined based on the need of respiratory and hemodynamic support, without use of measures such as the Pediatric Risk of Mortality score (PRISM), the Transport Pediatric Early Warning Score (TPEWS) or mortality in the receiving hospital, because they do not perform well for estimation of patient severity and the potential complications that may develop in the specific context of transport.24,25 However, a validated severity scale that is both quick and easy to use is needed to help identify risk factors and would allow risk stratification of patients and comparison of different studies.
Although there is a substantial amount of studies in the literature, there is also substantial heterogeneity, and it is difficult to draw conclusions or compare them, as the composition of transport teams, training of staff, material resources, patient severity and pretransport stabilization, the distance to cover in transport or the very definitions of AE and incident vary between studies. A meta-analysis by Jeyaraju et al.26 in adult transport excluded outright any study that had not defined AEs. The authors concluded that the incidence of AEs was low (of around 11%) and were associated with patient severity. A broader meta-analysis or a more homogeneous approach to pediatric interfacility transport may be necessary to be able to draw firm conclusions and improve the safety of our patients.
Parental presence during pediatric IFT is increasingly frequent, coinciding with the implementation of open-door policies in ICUs for parents in recent years, and the presence of parents in the patient compartment is becoming commonplace.27–29
In fact, a recent study did not find an increase in complications in association with parental presence, which supports the presence of the adult accompanying the patient in the patient compartment in the framework of a comprehensive patient- and family-centered care model.22
In our study, we found changes in this area, with an increase in the number of accompanied patients between the first and second periods as well as in the presence of relatives in the patient compartment of the ambulance. Even so, the proportion of patients that experienced incidents was lower when the patient was accompanied by a family member, and the accompanying adult tended to be in the driver’s compartment in cases where incidents occurred. This probably stemmed from a conscious decision on the part of the team, who, anticipating the need to stabilize the patient during transport, preferred to have the parents in the front cab. Another frequent reason to place the accompanying relative in the front cab is the lack of seating in instances in which the transport team includes staff in training. These findings highlight the importance of continuing to work to ensure the involvement of parents throughout the entire care episode of their children and for health care professionals to learn to be comfortable working in their presence.
The main limitations of this study are its single-center design and small sample size, which precluded generalization to the entire territory. However, since we were able to compare outcomes before and after intervention, we could assess the usefulness of improvement interventions, although, given the lack of control groups, we cannot rule out that confounding variables were at play in the results in addition to the interventions.
ConclusionsPediatric IFT, when performed by qualified teams receiving continuing education, is safe and associated with a low incidence of complications. Training of the transport team and the use of simulation, protocols and quality indicators, adverse event reporting and incident analysis are key strategies for improving care quality and patient safety. The presence of parents in the ambulance was not associated with an increased frequency of incidents during transport.
FundingThis research did not receive any external funding.

Anales de Pediatría (English Edition) follows the Recommendations for the Conduct, Reporting, Editing and Publication of Scholarly Work in Medical Journals