


In the daily practice it is necessary to have quick, easy and accesible methods to adequately assess the renal function. The objectives were: 1. Quantify the relationship and concordance of the glomerular filtration rate (FG) calculated by the clearance of creatinine in 24 h urine (CCr) and the original and modified Schwartz equation (SE). 2. Correlate urine elimination of substances that depend on the volume of excreted urine in a unit of time with other parameters that are calculated measuring the concentration of these substances in blood and urine.
Materials and methodsThe study included 401 healthy children in the ages between 3 to14 (187 male and 214 female). The analysis between the variables was carried out by Pearson’s correlation coeficient and the intraclass correlation coefficient.
ResultsThe correlation between values of CCr and the original SE (non standardized creatinine measuring) was r = 0.58 (P < 0.001) and the concordance, CCI = 0.74. Correlation between values of CCr and the modified SE (standardized creatinine measuring) was r = 0.68 (P < .001) and the concordance CCI = 0.78. There is a very significant correlation between the elimination of sodium in 24 h urine (mEq/Kg/24 h) and the Na-Fractional-Excretion (EFNa): r = 0.8 (P < .001). There was a correlation between the potasium elimination in 24 h (mEq/Kg/24 h) and EFK: r = 0.85 (P < .001). Between volume/minute/1.73 m² and the urine volume for each 100 ml FG was: r = 0.88 (P < .001).
ConclusionsThese equations provide valuable information of the state of the basal renal function without having to turn to the minuted urine.
En la práctica diaria es necesario disponer de métodos rápidos, sencillos y accesibles para valorar adecuadamente la función renal. Los objetivos fueron: 1) Cuantificar la relación y concordancia de la tasa de filtración glomerular (FG) calculada mediante el aclaramiento de creatinina en orina de 24 h (CCr) y la fórmula de Schwartz (FS) original y la FS modificada. 2) Relacionar la eliminación urinaria de sustancias que dependen del volumen de orina expulsada en una unidad de tiempo con otros parámetros que se calculan midiendo la concentración de estas sustancias en sangre y en orina.
Material y métodosEl estudio incluyó 401 niños sanos de 3–14 años (187 hombres y 214 mujeres). El análisis entre las variables se realizó mediante el coeficiente de correlación de Pearson y el coeficiente de concordancia interclase tipo consistencia.
ResultadosLa correlación entre los valores de CCr y FS original (medición de creatinina no estandarizada) fue r = 0,58 (p < 0,001) y la concordancia (CCI = 0,74). La correlación entre las cifras de CCr y FS modificada (medición de creatinina estandarizada) fue r = 0,68 (p < 0.001) y la concordancia CCI = 0,78. Existía una correlación muy significativa entre la eliminación de sodio en orina de 24 h (mEq/Kg/24 h) y la Excreción-Fraccional-Na (EFNa): r = 0,8 (p < 0,001). También entre la eliminación de potasio en 24 h (mEq/Kg/24 h) y EFK: r = 0,78 (p < 0,001). Entre la proteinuria (mg/m²/hora) y el cociente proteína/creatinina urinario: r = 0,85 (p < 0,001). Y entre el volumen urinario (ml/minuto/1,73 m²) y el volumen por cien FG r = 0,88 (p < 0,001).
ConclusionesEstas ecuaciones proporcionan una valiosa información del estado de la función renal basal sin tener que recurrir a la orina minutada.
In everyday clinical practice, quick, simple and accessible methods are required to adequately assess renal function. Measuring creatinine clearance is the most widely used method for estimating the glomerular filtration rate (GFR). Timed urine collection poses challenges, especially in young or incontinent children, so the use of formulas based in the serum level of creatinine is recommended for the initial evaluation of the GFR.
The Schwartz formula (SF)1–3 is the one used most frequently for estimating the GFR in paediatric patients. In case of using untimed “spot” urine samples, measuring both the serum and urine concentrations of the substances allows us to calculate the clearance or fractional excretion of sodium, potassium and chloride. Similarly, we can use the serum and urine concentrations of creatinine to calculate the urine volume that corresponds to 100 mL of glomerular filtration (UVGFR). The transtubular potassium gradient (TTKG) is used to assess potassium clearance in random urine samples and, last of all, the urine protein/creatinine ratio is used to evaluate proteinuria.4,5
The objectives of the study were the following:
On one hand, to assess the correlation and agreement of creatinine clearance values obtained from analysis of 24-h urine collection samples (CrCl) and by applying the original SF and the modified SF.
On the other, to analyse the correlation between the clearance values per unit of time obtained from timed specimens with other parameters calculated by measuring the concentration of these substances in urine and blood and that do not depend on the amount of urine produced per time unit:
- none-
Assess the association of values that depend on the volume of urine excreted per unit of time (mL/min/1.73 m2) and the milliequivalents of sodium, potassium and chloride excreted in 24 h (mEq/kg/day) with formulas that combine the concentration of these substances in blood and urine.
- none-
Similarly, to assess the correlation between the potassium clearance calculated from 24-h urine specimens (mEq/kg/day) and the TTKG.
- none-
Last of all, to assess the correlation between proteinuria values obtained from timed specimens (mg/m2/h) and the urine protein/creatinine ratio
We conducted a cross-sectional analytical study in a sample of children aged 3–14 years between 2000 and 2012. We recruited most of the sample from the caseload managed at the outpatient paediatric surgery clinic of our hospital, where children underwent minor surgical procedures. We also included healthy siblings of children managed in the outpatient paediatric nephrology clinic. Blood samples for analysis were obtained at the outpatient level in children leading their ordinary lives and following their usual diet. The sample included 401 healthy children (187 male and 214 female) that met the following criteria for the definition of “healthy”: absence of metabolic, neuromuscular, endocrine or renal disease. We excluded children currently receiving pharmacotherapy or children that had undergone amputations. We recorded the age, sex, weight and height of the patients and calculated their body surface area (BSA) and body mass index (BMI). We measured the following variables in blood and 24-h urine samples: levels of creatinine, sodium, potassium and chloride, and osmolality. We also measured the urine total protein. The level of creatinine was measured using the Jaffé method. In 98 children, it was measured with the kinetic Jaffé method, whose results were subject to external and internal quality controls with a coefficient of variation of 4.8%. In the remaining 303 children, we used the standardised Jaffe IDMS-traceable method. We assumed that the sample collection was adequate if the level of creatinine ranged between 15 and 25 mg/kg/day.6 In all patients, we calculated the urine values of creatinine (mg/kg/24 h); sodium (mEq/kg/24 h), potassium (mEq/kg/24 h), chloride (mEq/kg/24 h) and total protein (mg/m2/h), as well as the following variables:
- none-
BMI: weight (kg)/height (m2).
- none-
BSA (m2): weight kg×height (cm)/3600
- none-
Volume of urine per minute normalised to a standard BSA of 1.73 m2: urine volume per minute × (1.73/m2 BSA).
- none-
UVGFR, that is, the volume of urine (as a percentage) produced per 100 mL of blood filtrated by the kidney (glomerular filtration): (SCr × 100) ÷ (UCr). Where SCr is the serum creatinine level (mg/dL) and UCr the concentration of creatinine in urine (mg/dL).
- none-
Creatinine clearance in 24-h urine collection (CrCl), expressed in mL/min/1.73 m2 BSA. We used the following formula: (UCr × urine volume in 1 min/SCr) × (1.73/m2 BSA).
- none-
Original SF (mL/min/1.73 m2 BSA): K × height (cm)/SCr. Where K is 0.7 for male adolescents, 0.57 for female adolescents and 0.55 for all other children.
- none-
Modified SF (mL/min/1.73 m2 BSA): 0.413 × height (cm)/SCr.
- none-
Fractional excretion of sodium (FENa) expressed as a percentage of the glomerular filtration volume in mL, and defined as the volume of blood (mL) cleared of sodium per 100 mL of blood filtrated by the kidney: [(SCr × UNa) × 100] ÷ (UCr × SNa), where UNa is the sodium concentration in urine in mEq/L and SNa the serum level of sodium in mEq/L.
- none-
Fractional excretion of potassium (FEK): [(SCr × UK) × 100] ÷ (UCr × SK), Where UK is the concentration of potassium in urine in mEq/L and SK the serum level of potassium in mEq/L.
- none-
Fractional excretion of chloride (FECl): [(SCr × UCl) × 100] ÷ (UCr × SCl), where UCl is the chloride concentration in urine in mEq/L and SCl the serum level of chloride in mEq/L.
- none-
TTKG: (UK)/(UOsm/SOsm)/(SK), where UOsm is the urine osmolality in mOsm/kg and SOsm the serum osmolality in mOsm/kg.
- none-
Protein/creatinine ratio: mg of protein in urine per mg of cleared creatinine: urine protein (mg/dL)/urine creatinine (mg/dL).
We performed the statistical analysis with the software SPSS®. We have expressed the data as mean and standard deviation (SD). We used the Student t test to compare continuous data, the Pearson correlation coefficient to assess the association between 2 variables, and the intraclass correlation coefficient (ICC) to assess the degree of consistency. We defined statistical significance as a p-value of less than 0.05.
The parents or guardians of the children gave consent for their participation in the study.
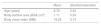
ResultsTable 1 summarises the clinical data corresponding to age, BSA and BMI.
Table 2 presents the mean values of the GFR obtained through different methods. We did not find differences between the sexes in the mean values of the different parameters used to assess renal function.
Mean value and standard deviation of parameters under study.
| Parameter | Mean | Standard deviation |
|---|---|---|
| Creatinine clearance in 24-h urine (mL/min/1.73 m2) | 139.97 | 23.91 |
| Original Schwartz formula (mL/min/1.73 m2) (n = 98) | 141.32 | 23.55 |
| Modified Schwartz formula (mL/min/1.73 m2) (n = 303) | 111.52 | 16.72 |
| Serum creatinine (mg/dL) | 0.52 | 0.12 |
| Urine creatinine (mg/kg/24 h) | 19.49 | 2.87 |
| Urine volume % glomerular filtration | 0.73 | 0.28 |
| Urine output (mL/min/1.73 m2) | 0.99 | 0.34 |
| Fractional excretion of sodium (FENa) | 0.62 | 0.25 |
| Natriuresis (mEq/kg/day) | 3.44 | 1.22 |
| Fractional excretion of potassium (FEK) | 9.59 | 3.19 |
| Transtubular potassium gradient (TTKG) | 5.68 | 1.62 |
| Urine potassium (mEq/kg/day) | 1.57 | 0.57 |
| Fractional excretion of chloride (FECl) | 0.89 | 0.81 |
| Urine chloride (mEq/kg/day) | 3.52 | 1.23 |
| Proteinuria (mg/m2/h) | 2.7 | 1.14 |
| Protein/creatinine ratio | 0.11 | 0.06 |
In the subgroup in which creatinine was measured by nonstandardised methods (n = 98), we found a statistically significant positive correlation between the GFR estimated using the CrCl and the original SF (r = 0.58; P < 0.001). The CCI showed good agreement between both variables (CCI, 0.74; 95% confidence interval [CI], 0.61–0.82).
In the subgroup with the remaining 303 children in which creatinine was measured with the standardised method, the correlation between the CrCl and the modified SF was also positive and significant (r = 0.68; P < 0.001), and the CCI demonstrated a good level of agreement between the variables (CCI, 0.78; 95% CI, 0.72–0.82).
We compared children with a BMI greater than 22 kg/m2 with other children of similar age and lower BMI values. Although the mean value of standardised creatinine was higher in children with a BMI greater than 22 kg/m2, we did not find statistically significant differences in the estimates of the GFR calculated with the 2 different approaches (Table 3).
Comparison of mean values (standard deviation) of serum creatinine level, creatinine clearance obtained through the 24-h urine specimen and modified Schwartz formula in children with and without excess weight.
| Body mass index (BMI) | Mean (SD) | P | |
|---|---|---|---|
| Serum creatinine (mg/dL) | >22 (38) | 0.62 (0.11) | 0.039 |
| <22 (42) | 0.57 (0.09) | ||
| Modified Schwartz formula (mL/min/1.73 m2) | >22 (38) | 153.6 (23.93) | NS |
| <22 (42) | 146.19 (20.88) | ||
| Creatinine clearance in 24-h urine (mL/min/1.73 m2) | >22 (38) | 136.96 (21.89) | NS |
| <22 (42) | 138.17 (22.87) |
NS, not significant; SD, standard deviation.
Table 2 presents the mean values with the corresponding standard deviations of the rest of the analysed variables.
The concentration of protein in urine exhibited a good correlation with the urine protein/creatinine ratio (r = 0.85; P < 0.001) (Fig. 1).
 and urine protein/creatinine ratio.")
The correlation coefficient for the association between the FENa and the measured urinary sodium clearance (mEq/kg/day) was 0.8 (P < 0.001) (Fig. 2).
 and fractional excretion of sodium.")
The correlation coefficient for the association between the potassium clearance calculated from the timed urine sample (mEq/kg/day) and the FEK was 0.78 (P < 0.001). The correlation coefficient for the association between the potassium clearance calculated from the timed urine sample (mEq/kg/day) and the TTKG was 0.67 (P < ).001).
We found a very strong correlation between the urine output per minute adjusted for a BSA of 1.73 m2 and the UVGFR (r = 0.88; P < 0.001) (Fig. 3).
Discussion
In everyday clinical practice, the GFR is calculated based on the 24-h endogenous creatinine clearance.7
The main limitations of the CrCl are the potential overestimation of the GFR due to tubular secretion of creatinine and the inconveniency and discomfort involved in obtaining a 24-h urine sample in young or incontinent children. Equations have been developed to attempt to estimate the GFR based on the serum concentration of creatinine, of which the SF is currently the one recommended to assess the GFR in the paediatric population.8–10 In agreement with the results of other studies,3,11 we found a good correlation in our sample between the CrCl values and the values obtained with the original SF and the modified SF.
The correlation was stronger in the subgroup of children in which the creatinine level was measured by the standardised method, which is the method currently recommended for estimation of the GFR in the paediatric population.8 We found a good level of consistency in both subgroups.
There is evidence that obesity is a risk factor for the development and progression of renal disease in children.12 While we found a significantly higher serum level of creatinine in children with a BMI of more than 22 kg/m2, we did not find significant differences when we compared the GFR obtained applying either of the 2 parameters. However, we do recognise the need to perform an exhaustive evaluation and adequate follow-up of these children to obtain thorough information on their renal function. It is also important to assess for potential comorbidities with a known association with obesity that could also cause kidney injury.
The detection of protein in the urine may be a benign finding or an early marker of chronic disease. A normal protein/creatinine ratio in a first morning urine specimen in a child with proteinuria is suggestive of orthostatic proteinuria, a condition frequently found in paediatric nephrology practice.4
Under normal conditions, the amount of sodium eliminated in urine equals the amount of sodium consumed in the diet.13 Thus, if renal function is normal, a high FENa is indicative of a high dietary salt intake.
Similarly, the FEK is a valid parameter to estimate renal clearance of potassium. The amount of potassium excreted in the urine depends mainly on dietary intake and the action of aldosterone in the collecting duct. Since the TTKG assesses aldosterone activity in renal tubules,14 it is also useful for the assessment of potassium clearance in urine. These measurements are important in the aetiological evaluation of renal lithiasis and its follow-up.
The strong correlation between the urine volume per minute adjusted for a BSA of 1.73 m2 and the VUGFR suggests that the latter is a valid indicator of urine output in these patients.4 Thus, the presence of a low VUGFR in a child with normal renal function would rule out a severe renal concentrating defect. Evidently, the values obtained from creatinine concentrations in urine that we sought to analyse vary throughout the day and based on the timing of urine sample collection. For instance, the values corresponding to urine samples collected after drinking water would result in a high UVGFR, which would be suggestive of polyuria. For this reason, measurements performed in samples of fasting first morning urine, if possible having urinated in the middle of the night, would be more reliable compared to spot samples taken at any other time of the day.
In short, we found an adequate correlation and agreement between the CrCl and the modified SF. We found a good correlation between the values for urine output and concentrations of sodium, potassium and protein obtained from a 24-h urine collection and the UVGFR, FENa, FEK and protein/creatinine ratio, parameters that do not involve the urine output and based on the concentration of these substances in blood and urine. In everyday clinical practice, these equations offer valuable information on the baseline renal function in paediatrics and can be calculated based on the results from a spot urine sample, without having to resort to collection of a 24 -h sample, which poses a considerable challenge in the paediatric age group.
Conflicts of interestThe authors have no conflicts of interest to declare.
Please cite this article as: Ubetagoyena Arrieta M, Areses Trapote R, Mendia Ubetagoyena J, Perez Revuelta M, Irati García Albizua I. Funcion renal basal en pediatria: correlacion de metodos que dependen de la recogida de orina de 24 horas con otros mas sencillos que no requieren orina minutada. An Pediatr (Barc). 2020;92:65–70.
