


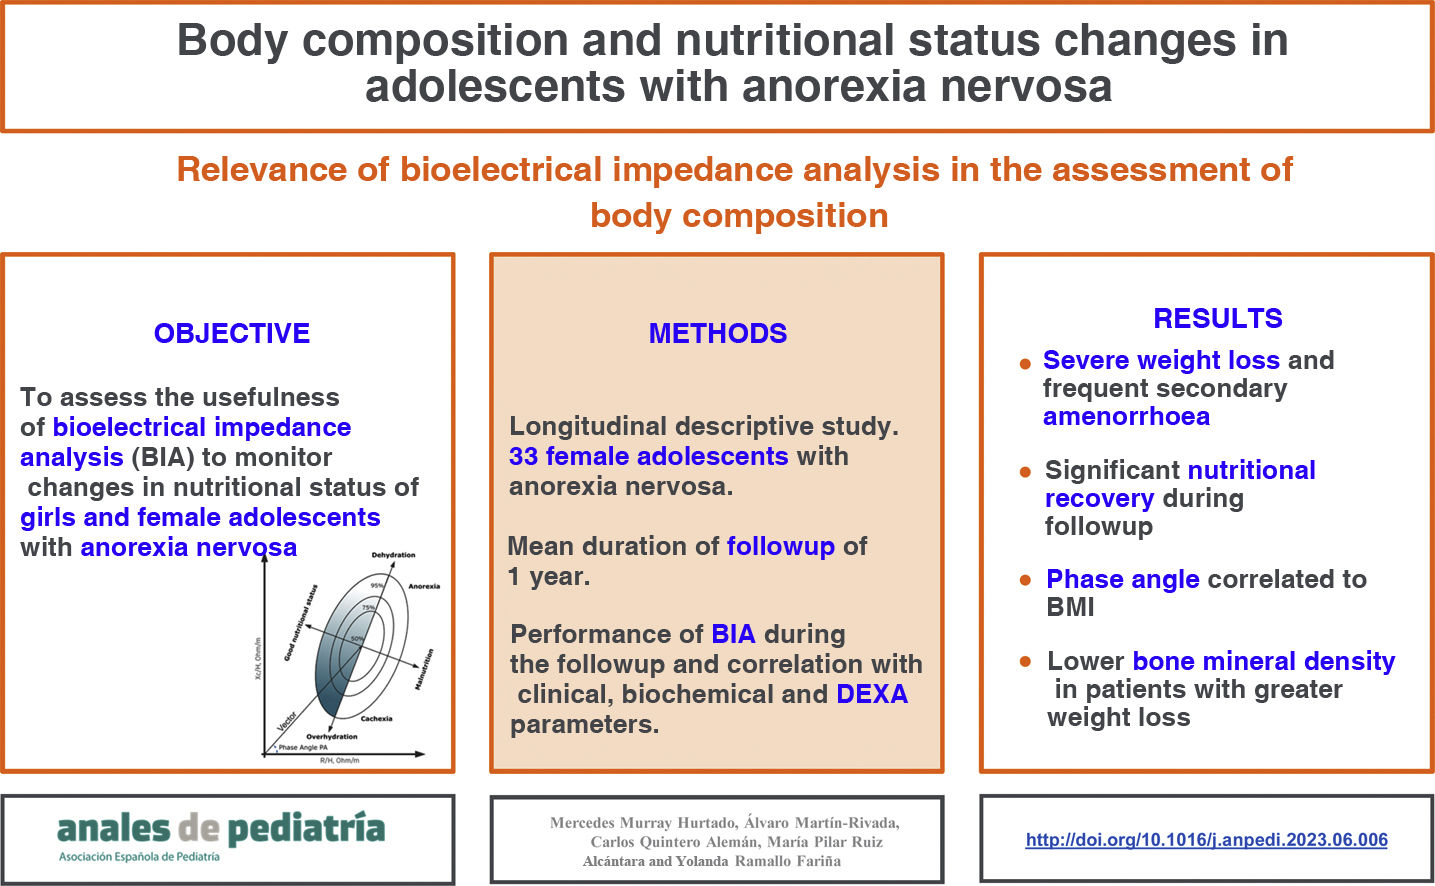
Nutritional status assessment in anorexia nervosa (AN) includes the evaluation and monitoring of body composition throughout the treatment period. The gold standard for the study of body composition is dual-energy X-ray absorptiometry (DEXA), although electrical bioimpedance (BIA) is a more accessible, cheaper and faster method that does not involve exposure to radiation.
Material and methodsWe recruited 33 female adolescents with AN (age, 11.7–16.3 years) by consecutive sampling. We collected data on clinical, anthropometric and laboratory variables. Patients were assessed with BIA and DEXA at inclusion in the study and at the end of the study, with a mean duration of follow-up of 1 year, during the nutritional rehabilitation phase.
ResultsThere was significant improvement in nutritional status, reflected by the body composition obtained by anthropometric measurements and BIA. The phase angle increased significantly during the follow-up. Greater weight loss was associated with the presence of secondary amenorrhoea and decreased bone mineral density in the spine.
ConclusionsElectrical BIA is a useful tool for assessment and monitoring of nutritional status in paediatric patients with AN. Dual-energy X-ray absorptiometry continues to be essential to assess bone mineral density. The role of hormones such as leptin remains to be elucidated.
La valoración nutricional en anorexia nerviosa (AN) incluye determinar la composición corporal y monitorizar su evolución a lo largo del periodo de tratamiento. La prueba gold standard para el estudio de la composición corporal es la absorciometría de rayos X de energía dual (DEXA), si bien la bioimpedancia eléctrica (BIA) se postula como una alternativa más accesible, barata, rápida y que no irradia.
Material y métodosSe reclutaron secuencialmente a 33 mujeres adolescentes (11,7–16,3 años) diagnosticadas de AN. Se recogieron parámetros clínicos, antropométricos y analíticos, y se realizó BIA y DEXA a la inclusión en el estudio y a la finalización del mismo con separación media de un año, durante la fase de rehabilitación nutricional.
ResultadosSe objetivó mejoría significativa a nivel nutricional, reflejada en la composición corporal obtenida mediante antropometría y BIA. El ángulo de fase aumentó significativamente durante el periodo de seguimiento. Una mayor pérdida ponderal se correlacionó con la presencia de amenorrea secundaria y con una menor densidad mineral ósea en columna.
ConclusionesLa BIA es una herramienta útil para la valoración y el seguimiento del estado nutricional en pacientes con AN en edad pediátrica. La DEXA sigue siendo imprescindible para conocer la afectación de la densidad mineral ósea. El papel de hormonas como la leptina está aún por determinar.
Eating disorders (EDs) are characterized by a persistent disturbance of eating or eating-related behaviour that significantly impairs physical health or psychosocial functioning.1 Among them, anorexia nervosa (AN) is characterised by restricted eating that results in a significantly low weight due to an intense fear of gaining weight in association with a distorted body image.
The incidence of AN peaks in girls and young women, and the risk is highest between ages 10 and 24 years.2 At present, it is the third most frequent chronic illness in female adolescents, following asthma and obesity,3 and both its incidence and prevalence are increasing in this group,4 especially since the start of the COVID pandemic.5,6
Anorexia nervosa has the highest fatality rate among psychiatric disorders and is also associated with physical and psychiatric comorbidities. Some of its salient physical complications are hypothalamic hypogonadism (with delayed onset of puberty or secondary amenorrhoea) and osteopenia. The resumption of menstruation entails a relative recovery of hormonal balance and is an indicator of a favourable prognosis. This hormonal recovery requires reaching a minimal body fat threshold,7 which sometimes can only be achieved when the patient is near or back to the baseline weight before the onset of the ED.
Historically, anthropometric measurements have been the sole means used to assess nutritional status and body composition in these patients. However, despite its usefulness and applicability, anthropometry may not allow an adequate differentiation of the main body compartments.
Dual-energy X-ray absorptiometry (DEXA) is considered the gold standard for body composition analysis. However, it also has limitations,8 so it may be worth assessing body composition through other means, among which bioelectrical impedance analysis (BIA) may be of particular interest.
Contrary to DEXA, BIA does not require specially trained staff, is inexpensive, portable, quick and does not entail exposure to radiation. Based on impedance vector and phase angle data, it is possible to determine the distribution of body water, body cell mass and cellular integrity as indicators of nutritional status, and the change in the phase angle can be used as a predictor to assess the course of disease and predict nutritional recovery outcomes.9
The additional assessment of laboratory parameters (nutritional and hormonal) makes it possible to monitor the progress in the recovery of body weight homeostasis. Leptin, a hormone secreted by adipose tissue and related to reproductive function, seems to play an important role in the maintenance of the menstrual cycle and fat restoration during nutritional recovery.10
The objectives of our study were to evaluate the usefulness of BIA in the assessment of body composition changes as a means to monitor changes in nutritional status in female paediatric patients with AN and to analyse the correlation between BIA findings and clinical and laboratory parameters.
MethodsWe conducted a longitudinal descriptive study with a mean follow-up of 1 year in a sample of female patients with AN managed in the paediatric nutrition clinic of our hospital, recruited consecutively between October 2020 and May 2021. We included female patients of paediatric age (less than 18 years at the time of inclusion) who met the Diagnostic and Statistical Manual of Mental Disorders, Fifth Edition (DSM-5) criteria for AN and accepted to participate, and none were excluded due to the presence of relevant comorbidities unrelated to AN.
We collected data on the following variables: age; menarche, duration of amenorrhoea and resumption of menstruation; blood chemistry and hormone levels at the beginning and the end of follow-up; anthropometric measurements levels at the beginning and the end of follow-up—weight, height and body mass index [BMI] and their z scores for age using the Hernández et al. charts for the Spanish population of 1988 as reference, percent weight loss at diagnosis, triceps skinfold, arm circumference and the Waterlow weight index (percent of the normal weight for the patient’s height).
The patients were assessed by means of BIA at the beginning and the end of the follow-up with a portable, whole-body single frequency bioimpedance analyser (Akern 101) with the tetrapolar (4 electrodes) method. All measurements were taken by the same evaluator during the routine follow-up visits. We collected data on the following variables: resistance, reactance, phase angle (PhA), bioimpedance vector, impedance index, total body water (TBW) and TBW percentile, extracellular water (ECW) and ECW percentile, intracellular water (ICW) and ICW percentile, fat-free mass (FFM) and FFM percentile, as well as the extracellular mass (ECM: bone, collagen, plasma and inter- and transcellular fluids), fat mass (FM) and FM percentile, body cell mass (BCM) and body cell mass index (BCMI). We compared them with the reference values for the different BIA parameters obtained in the healthy Spanish population aged 4–18 years.11
A DEXA scan was also performed at the beginning and end of the follow-up or as close as possible to the corresponding dates. We collected the z scores for the spine and the total body, the FFM, FM and percent FM.
The nutritional intervention started with an educational strategy in which the concepts of weight and BMI and notions of healthy nutrition (food groups, recommended serving size and frequency, the Harvard healthy eating plate etc) were explained to the patient and the parents and any questions and myths around these subjects were addressed. Then, depending on the level of undernutrition and the estimated requirements for each patient, a nutrition plan was developed (usually with prescription of the normal energy intake for age and sex through consumption of varied foods following the Mediterranean diet pattern) with addition of oral nutrition supplements (when it was not possible to cover the requirements or promote weight gain through natural food sources or the patient refused sufficient intake). Nutritional management was adjusted as needed based on the progress of the patient. In every case, caution was exerted to prevent refeeding syndrome, and patients were reassessed at regular intervals (ranging from 1 week to 1 month at the outpatient level, and daily at the inpatient level).
The study was conducted in adherence to current ethical principles, laws and regulations in Europe and Spain. It was approved by the Ethics Committee of Research with Medicines of our hospital under file code CHUC_2021_123.
We have expressed quantitative variables as mean, standard deviation and interquartile range. Qualitative variables were expressed as absolute frequencies and percentages. We applied the Kolmogorov-Smirnov test to outcome variables to assess whether the data followed a normal distribution. For most variables, the null was not rejected, but due to the small sample size and to use a homogenous format for our results, we chose to be conservative and apply nonparametric methods to all variables. As a measure of sensitivity, we also applied parametric methods to perform the various comparisons (data not published), and did not find relevant differences with the results obtained in the nonparametric analysis.
We compared independent measures with the Mann–Whitney U test and dependent measures with the Wilcoxon test. We analysed associations by means of the Pearson correlation test. The threshold of statistical significance was established at an α of 0.05. The statistical analyses were performed with the software package IBM SPSS® version 25.0 (IBM Corp. Armonk, NY).
ResultsCharacteristics of the sampleOf a total of 33 patients who met the inclusion criteria and enrolled in the study, 27 completed the follow-up and 6 did not complete the minimum duration of follow-up (4 because they stopped attending the follow-up visits and the other 2 because there was not enough time between the date they were recruited and the end of the study period). The mean duration of follow-up was 1 year, with a range of 8–15 months.
The mean age of the patients was 14.3 years (range, 11.7–16.3). The mean percentage weight loss at diagnosis was 21.9% (range, 7%–40%) of the reported maximum past weight. One hundred percent of the patients presented restrictive intake, accompanied by excessive exercise in 75.8%, purging in 21.2% and bingeing in 24.2%.
At the beginning of the study, the mean BMI of the patients was 16.9 kg/m2 (SD, 2.2) with a mean z score of −1.07 (SD, 0.6). The mean weight z score was −0.7 (SD, 0.6) and the mean height z score 0.2 (SD, 0.7). The mean Waterlow weight index was 83% (SD, 0.7%), the triceps skinfold was 12.3 mm (SD, 3.1) and the arm circumference was 23.3 cm (SD, 2.6).
As regards biochemical abnormalities at baseline, 46.7% of patients had vitamin D deficiency, 31% dyslipidaemia, 23% hypoproteinaemia, 10% abnormal iron metabolism and 13.3% respiratory acidosis.
During the study period, 33% of the patients required oral supplementation (hypercaloric polymeric formula), 15% hospital admission and a single patient (3%) enteral nutrition delivered through a nasogastric tube.
Of the 33 patients, 30 had experienced menarche before enrolling in the study and the remaining 3 went through menarche during the follow-up. In the former group, 73.3% had secondary amenorrhoea (mean total duration, 20.9 months; SD, 11.3), of who 13 (39.4%) achieved the resumption of menstruation during the follow-up.
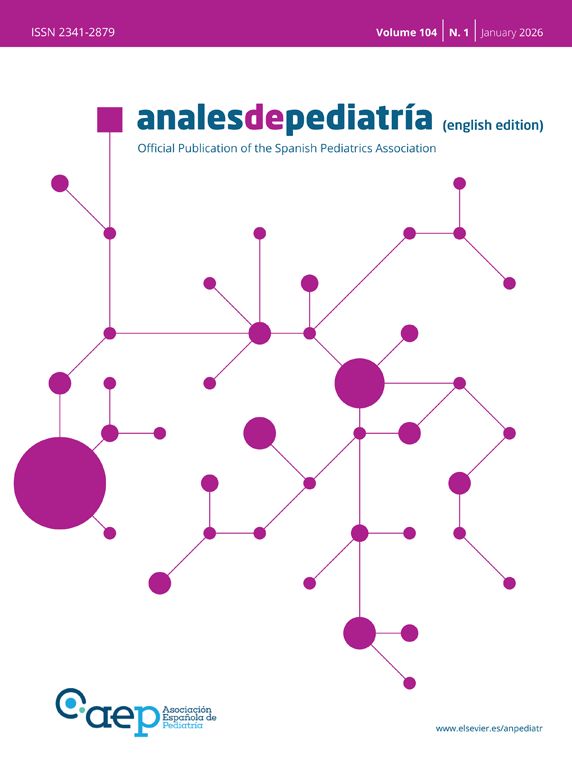
Patients who presented with amenorrhoea at the time of recruitment had lost more weight (P = .025) and a lower Waterlow weight index (P = .028). Patients who continued to menstruate had higher levels of estradiol (P = .027), without differences in any of the other hormone levels or the BIA or DEXA parameters. There were differences in leptin levels with a P value that neared the threshold of statistical significance (P = .054) (Table 1).
Association between amenorrhoea and anthropometric, hormone and BIA parameters at the time of enrolment.
| Without amenorrhoea (n = 8) | With amenorrhoea (n = 22) | ||||||
|---|---|---|---|---|---|---|---|
| Mean (SD) | Median | IQR | Mean (SD) | Median | IQR | P (Mann–Whitney) | |
| Weight z | −0.32 (0.66) | −0.25 | −0.8 to 0.25 | −0.63 (0.41) | −0.60 | −0.97 to −0.36 | .152 |
| BMI | 19.23 (1.87) | 18.8 | 17.87 to 2.84 | 17.71 (1.99) | 17.28 | 16.16–19.01 | .083 |
| BMI z | −0.50 (0.61) | −0.65 | −1.11 to .15 | 0.96 (0, 54) | −0.99 | −1.32 to −0.63 | .067 |
| Percent weight loss | 15.34 (5.11) | 14 | 11.40–21 | 23.27 (8.63) | 20.50 | 16.75 to 30.44 | .025 |
| Waterlow weight index | 94.14 (8.25) | 95.30 | 87.13–97.16 | 83.90 (15.46) | 83.72 | 76.17–91.45 | .028 |
| Phase angle | 5.56 (0.61) | 5.55 | 5.30 to 6.00 | 5.16 (0.63) | 5.05 | 4.80 to 5.63 | .105 |
| FM percentile | 26.18 (6.51) | 26.60 | 19.08–32.70 | 22.81 (6.05) | 21.50 | 19.70 to 28.08 | .241 |
| FFM percentile | 73.83 (6.51) | 73.40 | 67.30 to 8.93 | 77.19 (6.05) | 78.50 | 71.93 to 80.30 | .241 |
| TBW percentile | 59.99 (6.12) | 59.40 | 54.15–65.43 | 62.42 (6.02) | 60.75 | 58.88 to 67.00 | .325 |
| ECW percentile | 4.85 (16.55) | −1.00 | −1.00 to -1.00 | 10.45 (21.65) | −1.00 | −1.00 to 10.63 | .481 |
| ICW percentile | 59.49 (3.07) | 60.40 | 57.03–62.00 | 57.31 (4.25) | −58.90 | 55.48–60.30 | .189 |
| BCMI | 7.29 (0.75) | 7.45 | 6.73 to 7.90 | 6.73 (0.92) | 6.60 | 6.07 to 7.33 | .121 |
| FSH (mIU/mL) | 4.29 (2.46) | 5.30 | 1.78 to 6.31 | 6.30 (3.31) | 6.87 | 3.23 to 8.57 | .176 |
| LH (mIU/mL) | 5.32 (2.69) | 4.13 | 3.11 to 8.12 | 4.70 (3.68) | 3.90 | 1.32 to 7.76 | .709 |
| Estradiol (pg/mL) | 119.10 (96.57) | 92.55 | 45.50–219.25 | 35.84 (43.33) | 14.00 | 10.00 to 53.25 | .027 |
| Leptin (ng/mL) | 19.00 (15.46) | 16.70 | 5.55 to 34.75 | 7.13 (8.99) | 4.00 | 1.70 to 9.65 | .054 |
BCMI, body cellular mass index; BMI, body mass index; BIA, bioelectrical impedance analysis; ECW, extracellular water; FFM, fat-free mass; FM, fat mass; FSH, follicle-stimulating hormone; ICW, intracellular water; IQR, interquartile range; LH, luteinising hormone; SD, standard deviation; TBW, total body water; z, z score.
Statistically significant P values are presented in boldface.
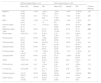
Most anthropometric variables were significantly correlated to body composition values obtained by BIA at the time of enrolment (Table 2).
Correlation between anthropometric and BIA parameters at the time of enrolment.
| Correlation | P | |
|---|---|---|
| BMI in relation to phase angle | 0.387 | .028 |
| BMI z in relation to phase angle | 0.422 | .016 |
| Weight z in relation to phase angle | 0.214 | .240 |
| BMI in relation to fat mass | 0.773 | < .001 |
| BMI in relation fat mass percentile | 0.680 | < .001 |
| BMI z in relation to fat mass | 0.649 | < .001 |
| BMI in relation to fat-free mass | 0.427 | .015 |
| BMI in relation to fat-free mass percentile | −0.680 | < .001 |
| BMI z in relation to fat-free mass | 0.275 | .127 |
BMI, body mass index; BIA, bioelectrical impedance analysis; z, z score.
Statistically significant P values are presented in boldface.
The correlation between the results obtained by DEXA (bone mineral density z score) and biochemical and anthropometric values at enrolment was only significant between the the spine z score and the percent weight loss (r = 0.419; P = .047) and between the leptin level and both the spine z score (r = −0.58; P = .039) and whole body z score (r = −0.736; P = .004) (Table 3).
Correlation between DEXA results at enrolment and anthropometric and biochemical parameters.
| Correlation | P | |
|---|---|---|
| Spine z score | ||
| BMI z | −0.059 | .794 |
| Percent weight loss | −0.419 | .047 |
| Estradiol | −0.210 | .512 |
| Leptin | −0.576 | .039 |
| Duration of amenorrhoea | 0.157 | .509 |
| Whole body z score | ||
| BMI z | −0.120 | .594 |
| Percent weight loss | −0.381 | .073 |
| Estradiol | −0.210 | .512 |
| Leptin | −0.736 | .004 |
| Duration of amenorrhoea | 0.060 | .803 |
BMI, body mass index; DEXA, dual-energy X-ray absorptiometry; z, z score.
Statistically significant P values are presented in boldface.
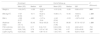
We found significant changes in anthropometric variables (weight z score, BMI, BMI z score and Waterlow weight index) between enrolment and the end of follow-up that reflected an improvement in nutritional status. However, there were no significant differences in hormone levels (Table 4).
Changes in anthropometric and biochemical parameters during follow-up (n = 27).
| Enrolment | End of follow-up | P (Wilcoxon) | |||||
|---|---|---|---|---|---|---|---|
| Mean (SD) | Median | IQR | Mean (SD) | Median | IQR | ||
| Weight z | −0.6 (0.47) | −0.58 | −0.92 to −0.27 | −0.31 (0.6) | −0.26 | 0.66 to 0.01 | .004 |
| BMI (kg/m2) | 17.97 (2.03) | 18.11 | 16.22 to 19.11 | 19.86 (1.7) | 19.45 | 18.63 to 21.30 | < .001 |
| BMI z | −0.89 (0.57) | −0.93 | −1.27 to −0.44 | −0.45 (0.54) | −0.53 | −0.87 to 0.02 | < .001 |
| Waterlow index | 86.5 (15.11) | 85.48 | 78.52–95.35 | 97.76 (1.96) | 96.88 | 87.79–107.37 | < .001 |
| FSH (mIU/mL) | 6.61 (3.3) | 6.17 | 3.04–7.61 | 6.24 (2.38) | 6.18 | 4.92 to 8.51 | .754 |
| LH (mIU/mL) | 5.26 (7.69) | 3.78 | 1.87 to 7.45 | 7.69 (7.99) | 4.37 | 2.33 to 8.08 | .249 |
| Leptin (ng/mL) | 5.23 (5.22) | 4.60 | 1.88–15.15 | 1.33 (7.57) | 7.80 | 6.23 to 16.93 | .123 |
BMI, body mass index; FSH, follicle-stimulating hormone; LH, luteinising hormone; z, z score.
Statistically significant P values are presented in boldface.
The significant correlation found between anthropometric parameters and the BIA phase angle at the time of enrolment stopped being significant once nutritional status improved, but the correlation of the BMI with both the fat mass percentile (r = −0.694) and the fat mass (r = 0.694) remained significant (P < .001 for both).
We also found significant changes in most of the BIA parameters between the time of enrolment and the end of follow-up, which reflected an improvement in the nutritional status of the patients (Table 5).
BIA parameters at enrolment and at the end of follow-up (n = 27).
| Enrolment | End of follow-up | P (Wilcoxon) | |||||
|---|---|---|---|---|---|---|---|
| Mean (SD) | Median | IQR | Mean (SD) | Median | IQR | ||
| Fat-free mass | 34.85 (3.18) | 35.40 | 32.25–37.55 | 38.13 (4.06) | 38.40 | 34.30–41.55 | .000 |
| Total body water | 28.22 (1.82) | 28.10 | 26.90 to 29.65 | 29.40 (2.63) | 28.75 | 27.30–31.55 | .004 |
| Extracellular water | 11.84 (1.27) | 11.80 | 1.90 to 12.85 | 12.88 (1.67) | 13.10 | 11.35 to 13.83 | .003 |
| Body cellular mass | 17.22 (2.26) | 17.10 | 15.65 to 19.05 | 19.66 (2.54) | 19.55 | 17.80 to 21.43 | .000 |
| Fat mass | 11.05 (3.86) | 11.10 | 7.80 to 13.35 | 13.29 (4.00) | 12.90 | 1.23 to 15.95 | .001 |
| Phase angle | 5.22 (.64) | 5.20 | 4.80 to 5.70 | 5.60 (.60) | 5.45 | 5.12 to 6.00 | .001 |
| Fat mass percentile | 23.59 (6.03) | 22.60 | 19.90 to 28.75 | 25.52 (5.23) | 25.80 | 21.15 to 3.03 | .021 |
| Fat-free mass percentile | 76.41 (6.03) | 77.40 | 71.25 to 8.10 | 74.48 (5.23) | 74.20 | 69.98 to 78.85 | .021 |
| Total body water percentile | 62.13 (5.99) | 6.60 | 58.75 to 66.85 | 57.62 (5.13) | 58.15 | 53.20 to 6.30 | .000 |
| Extracellular water percentile | 8.05 (19.54) | −1.00 | −1.00 to −1.00 | 21.18 (24.72) | −1.00 | −1.00 to 46.53 | .168 |
| Intracellular water percentile | 58.02 (3.87) | 59.00 | 57.05–6.60 | 56.18 (4.26) | 56.20 | 53.48–59.88 | .157 |
BIA, bioelectrical impedance analysis; IQR, interquartile range.
Statistically significant P values are presented in boldface.
The bone mineral density measured by DEXA was not associated with the biochemical and anthropometric values obtained at the end of the follow-up.
Although we could not compare the body composition results obtained by BIA with those obtained by DEXA, since these tests were not performed at the same time, we ought to highlight that we found that the BIA phase angle was positively correlated to the fat-free mass obtained by DEXA at diagnosis (r = 0.438; P = .037), and the whole body bone mineral density z score at the end of follow-up (r = 0.738; P = .015).
DiscussionThe main goal of the medical management of AN is nutritional recovery. The use of non-invasive techniques to assess body composition may be helpful in monitoring nutritional status over time, as our study demonstrates.
In the sample under study, most patients had severe weight loss, biochemical abnormalities were frequent and secondary amenorrhoea was present in more than 70% of patients, who tended to have more severe weight loss.
The changes in body composition assessed by BIA associated with nutritional recovery were consistent with the findings of previous studies, whose authors have highlighted the performance of the phase angle,9,12 a variable associated with the cell mass, which is metabolically active13; the phase angle has been found to decrease in patients with undernutrition and to increase during nutritional recovery in inverse proportion to the loss of the water contained in the fat-free mass,14 so it has been proposed as a prognostic indicator to assess the course of AN that can be used to differentiate patients with active AN from patients in remission and healthy controls.15 In our study, the phase angle was significantly correlated to the BMI at diagnosis, although the correlation was no longer significant at the end of the follow-up, due to the low sensitivity of body weight and BMI in the assessment of nutritional status or the recovery of different body compartments.14,15
As regards the assessment of body water by BIA, it is worth noting that previous studies have found changes in the fluid compartments in patients with AN, with certain factors identified as possible contributors: impaired renal concentrating ability, abnormal secretion of antidiuretic hormone,9 the tendency of some patients to drink excessive amounts of water to feel sated and of other patients to not drink water to avoid weight gain,16 or the development of oedema in the lower extremities due to hypoalbuminaemia, among others.12 In our sample, we did not observe significant changes in the fluid compartment values obtained by BIA during the follow-up.
Dual-energy X-ray absorptiometry is considered the gold standard for assessment of body composition in patients with AN,17 but it also has significant logistic limitations. In our study, the bone mineral density was abnormally low in patients who had lost a greater percentage of their body weight, so this could be a variable to consider in determining whether performance of DEXA would be appropriate.
A substantial percentage of the patients had biochemical abnormalities, the most frequent of which was vitamin D deficiency, followed by dyslipidaemia and hypoproteinaemia. The high prevalence of vitamin D deficiency could be explained by a reduced exposure to sunlight in individuals who have a distorted body image in addition to an insufficient dietary intake; however, studies comparing patients with AN and controls have found similar levels in both groups.18 Furthermore, in the Canary Islands, the prevalence of vitamin D deficiency is high in the general population, despite the significant levels of ultraviolet radiation in the region,19 so we could not conclude that the low levels of vitamin D were secondary to the eating disorder.
As for dyslipidaemia, a frequent finding in patients with AN, it has been hypothesised that serum cholesterol levels may increase due to an increased absorption of exogenous cholesterol and in association with endocrine mechanisms that are frequently altered in these patients, such as the insulin signalling pathway, free triiodothyronine (fT3), growth hormone, cortisol or estradiol.20
Leptin is a hormone secreted by fat cells that is involved in energy homeostasis, reproductive function21 and the maintenance of bone mineral density.22 Its levels are correlated to the total body fat, and decreased levels are associated with impaired hypothalamic-pituitary-gonadal axis function and a decreased bone mineral density in the spine in patients with AN, reflecting the link between bony tissue, adipose tissue and sex hormones.23,24 In consequence, decreased leptin serum levels are also considered a marker of disease severity in AN, and normalization of leptin levels appears to be indispensable for the resumption of menstruation, which can be a factor to consider in cases of persistent amenorrhoea despite achievement of an acceptable BMI.25
In our sample, nearly all patients without amenorrhoea had normal leptin levels. We found a correlation between the levels of leptin at enrolment and bone mineral density both in the lumbar spine and in the whole body, as well as results with P values near the threshold of significance in the association with amenorrhoea, although we did not find a significant increase in the levels of leptin by the end of the follow-up, which could be due to the study period being too short for these changes to take place or to the small sample size.
We ought to highlight that our findings did not yield a biochemical, anthropometric or body composition parameter that could predict the resumption of menstruation, although, given that patients with amenorrhoea presented with a significantly greater weight loss, it is reasonable to hypothesise that weight recovery could be a key contributor to the resolution of hormone imbalances.
Our study had limitations, chief of which are the relatively small sample size and a study period that may not have been long enough to detect certain differences. In addition, the growth standards we chose as reference in the anthropometric assessment may cause controversy, as there are more recent standards, both in Spain and at the international level, that could be a better fit for today’s adolescents. However, this is still a subject of debate within the scientific community and there is no consensus on the matter.26,27 There is widespread consensus, on the other hand, that no matter which reference is chosen, it is essential to be aware of its strengths and weaknesses and to apply the same standard in the follow-up of all participants. Thus, in our region, the Department of Health of the Canary Islands had established the tables of Hernández et al. of 1988 as the reference to be used at the primary care level, and we considered that it would be preferable to keep using the reference that had been applied to monitor the growth of the patients since childhood.
On one hand, our study contributes a novel perspective in the paediatric age group, as no previous works had analysed body composition in this level of detail and its association with amenorrhoea in patients with AN. On the other, it would be useful to carry out prospective studies in larger samples and with longer follow-up periods specifically designed to assess the accuracy and validity of BIA and its correlation with DEXA, with the ultimate goal of developing specific standards for this disease.
Conclusion- •
Our patients with AN presented with severe weight loss, frequently accompanied by biochemical abnormalities and secondary amenorrhoea, and exhibited significant improvement in nutritional status during the follow-up.
- •
We found a significant correlation between anthropometric values and the body composition estimated by means of BIA, both at diagnosis and during the follow-up. The phase angle was associated with the BMI at baseline and increased significantly during the follow-up as nutritional status improved.
- •
The bone mineral density was lower in patients with greater weight loss, which could help select patients in whom this test would be appropriate.
- •
Larger percentages of weight loss at diagnosis and lower leptin levels appeared to be important indicators in relation to amenorrhoea, and we did not identify any variables that could predict the resumption of menstruation in our patients.
Mercedes Murray Hurtado and Álvaro Martín Rivada have received financial support in the past five years to cover travel, accommodation and enrolment expenses to attend courses and congresses as well as speaker and instructor fees for their participation in courses and conferences from Nestlé Health Science, Abbott, Nutricia, Fresenius Kabi, Mead & Johnson and Casen Recordati; although they had no conflicts of interest that would interfere with the results of this research project.
Yolanda Ramallo Quintero, Carlos Quintero Alemán and María Pilar Ruiz Alcántara have no conflicts of interest to disclose.
We thank the Colegio Oficial de Médicos of Tenerife for their guidance in relation to the methods and statistical analysis of this study.
