

The consumption of free sugars has been related to excess weight, with the WHO recommending an intake of <10% of total energy. The aim of this study is to assess the association between the consumption of free sugars at 12 months and the risk of excess weight at 30 months in healthy children.
Materials and methodsA longitudinal study was conducted on 81 children followed-up from birth to 30 months. A record was made of the clinical history and anthropometry, at birth, and at 12 and 30 months. Weight status was classified as with or without excess weight, according to WHO values. At 12 months, the intake of energy and nutrients was analysed by differentiating the intake of free and natural sugars. Multivariate analyses adjusted for the main confounding variables were performed.
ResultsFree sugars were consumed by 40.4% of the 12-month-old children, being higher than that recommended, and being significantly higher in children with excess weight at 30 months (60.9%). The higher intake of free sugars at 12 months is associated with an increased risk of excess weight at 30 months (OR: 1.130, 95% CI: 1.032–1.238).
ConclusionsThe consumption of free sugars is much higher than that recommended in 12-month-old infants. This high intake could be a risk factor for excess weight, even at early ages.
El consumo de azúcares libres se ha relacionado con el exceso de peso, recomendando la OMS una ingesta <10% de la energía total. El objetivo fue valorar la asociación entre el consumo de azúcares libres a los 12 meses y el riesgo de exceso de peso a los 30 meses en niños sanos.
Material y métodosEstudio longitudinal en 81 niños seguidos desde el nacimiento hasta los 30 meses. Se registró: historia clínica y antropometría al nacer, a los 12 y 30 meses. Se clasificó el estado ponderal en con y sin exceso de peso, según los valores de la OMS. A los 12 meses se analizó la ingesta de energía y nutrientes diferenciando la ingesta de azúcares libres y azúcares naturales. Se realizaron análisis multivariantes ajustados por las principales variables confusoras.
ResultadosUn 40,4% de los niños de 12 meses realizaron ingestas de azúcares libres superiores a las recomendadas, siendo significativamente mayores en los niños con exceso de peso a los 30 meses (60,9%). La mayor ingesta de azúcares libres a los 12 meses se asocia a un mayor riesgo de exceso de peso a los 30 meses (OR: 1,136; IC 95%: 1,033-1,248).
ConclusionesLos lactantes de 12 meses realizan una ingesta de azúcares libres muy superior a la recomendada. Esta ingesta elevada podría ser un factor de riesgo de exceso de peso ya en edades tempranas.
Obesity is a chronic disease that may manifest from the first years of life.1 The increase in the prevalence of overweight and obesity in the paediatric age group2,3 continues to be a significant social and public health problem, and this is a worldwide trend.4 Specifically, the global prevalence of excess weight in children aged 0–5 years was 4.2% in 1990 compared to 6.7% in 2010, and the World Health Organization (WHO) has estimated that it will reach 9% by 2020.5 Obesity in childhood and adolescence is associated with an increased risk of type 2 diabetes, hypertension, coronary disease and metabolic syndrome in adulthood, in addition to its negative impact on physical and psychosocial wellbeing.6,7
Dietary practices in the first year have been identified as an important factor that may lead to excess body fat in childhood.8 During this critical period in which substantial changes occur in the diet, an excessive energy intake, an imbalance in macronutrient composition and nutrient deficiencies or overconsumption may contribute to the development of poor dietary habits that may be associated with metabolic changes and increase the risk of obesity.9 In recent years, the increased consumption of free sugars (FSs) has attracted considerable interest, as it is associated with obesity, especially in children and adolescents.10 This increase is associated with a poorer nutritional value of the diet. In this context, the WHO has recommended limiting the intake of FSs (added sugars [ASs] and sugars naturally present in fruit juices and fruit juice concentrates) to no more than 10% of the total energy intake to prevent obesity and associated diseases, and specified that restricting the intake of FSs to less than 5% of the total energy could have additional health benefits, especially in relation to dental caries.11 The results from prospective studies analysing the intake of free and added sugars in relation to the body composition of children have been contradictory.12–15 These studies have been conducted in children aged 9 months to 9 years in Europe, the United States and Africa. The meta-analysis published by Te Morenga et al. provided evidence that a high intake of FSs, ASs or sugary beverages is a determinant of body weight and of an association between a high sugar intake and diseases like hypertension, dyslipidaemia and insulin resistance in both childhood and adulthood.16 On the other hand, the meta-analysis by Forshee et al. estimated an associated risk that neared zero.17
Few studies have assessed the role of a high consumption of FSs in infancy in the increase in obesity. For this reason, the aim of our study was to analyse the association between the intake of FSs at age 12 months and the probability of excess weight at age 30 months in a group of healthy children in Spain.
Materials and methodsDesignWe conducted a longitudinal study of children, with the followup extending from birth to age 30 months.
SampleWe selected 81 healthy newborns from the population included in the DeFensas study18 for who data were available on the main clinical, nutritional and anthropometric variables at ages 12 months and 30 months.
The study was approved by the Ethics Board of the Hospital Universitario Sant Joan de Reus (Tarragona, Spain).
The sample size required to detect differences in weight status at 30 months in children that consumed more than 10% of the total energy in the form of free sugars at 12 months (39.1% and 60.9%) was 42 patients per group for a risk of alpha error of 0.05 and a beta error of less than 0.2 in two-tailed tests (calculated with GRANMO version 7.12, Institut Hospital del Mar d’Investigacions Mèdiques, Barcelona, Spain).
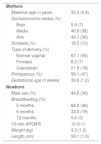
Measurements and data collectionPrenatal and delivery records were available for all children under study. Table 1 summarises these data along with the anthropometric measures at ages 12 and 30 months. We also collected data on the medical history, nutrition and anthropometric measurements obtained by paediatricians and dieticians using a standardised protocol.
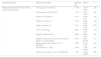
General characteristics of mothers and children.
| Mothers | |
| Maternal age in years | 32.3 (4.4) |
| Socioeconomic status (%) | |
| Bajo | 8.9 (7) |
| Medio | 46.8 (38) |
| Alto | 44.3 (36) |
| Smokers (%) | 16.5 (13) |
| Type of delivery (%) | |
| Normal vaginal | 67.1 (56) |
| Forceps | 8.2 (7) |
| Caesarean | 21.9 (18) |
| Primiparous (%) | 58.1 (47) |
| Gestational age in weeks | 39.6 (1.2) |
| Newborn | |
| Male sex (%) | 44.6 (36) |
| Breastfeeding (%) | |
| 0 months | 84.2 (48) |
| 6 months | 33.3 (19) |
| 12 months | 5.4 (3) |
| 10-min APGAR | 10 (0.1) |
| Weight (kg) | 3.3 (1.2) |
| Length (cm) | 50.1 (1.9) |
| 12 months | 30 months | |
|---|---|---|
| Anthropometric values | ||
| Weight (kg) | 10.1 (1.2) | 14.4 (1.6) |
| Height (cm) | 75.9 (3) | 92.8 (4.1) |
| Weight status (%)a | ||
| Underweight | 5.2 (5) | 9.9 (7) |
| Normal weight | 63.6 (52) | 50.6 (42) |
| Overweight | 19.5 (15) | 27.2 (22) |
| Obesity | 11.7 (9) | 12.3 (10) |
Values expressed as mean (standard deviation) or percentage (absolute frequency).
We retrieved data on sociodemographic variables, and maternal and newborn health at the time of birth. We classified socioeconomic status into 3 categories (low, middle, high) using the four-factor index proposed by Hollingshead.19 We collected data for the following obstetric and perinatal variables: newborn sex (male/female), gestational age, type of delivery, infant nutrition (breastfeeding or formula feeding) and 10-min Apgar score. We documented maternal use of tobacco during pregnancy using a questionnaire specifically designed for the purpose. We also recorded all medical problems and all vaccines administered to the child during the followup.
Anthropometric variablesWe recorded the child's weight and length/height at birth and ages 12 months and 30 months. At birth and 12 months, the weight was measured with a SECA digital scale accurate to 5g (Vogel & Halke GmbH & Co, Hamburg, Germany), and length with an infantometer accurate to 0.1cm (PE-RILB-STND). The head circumference was measured with a flexible measuring tape accurate to 1mm. At 30 months, the weight and height were measured with a combined digital scale and stadiometer (SECA 764). We calculated the z-scores for child growth indicators such as weight-for-age at birth, weight-for-length at 12 months and weight-for-height at 30 months using the LMS method.20,21 The z-score corresponds to the number of standard deviations from the mean, with values ranging from −3 to +3 SDs. Based on weight-for-age at birth, weight-for-length at 12 months and weight-for-height at 30 months, we classified children as having underweight (−3≤z<−1), normal weight (−1<z≤+1), overweight (+1<z≤+2) or obesity (z>+2) (WHO21). We also defined a weight status dichotomous variable with the following categories: no excess weight (underweight or normal weight) and excess weight (overweight or obesity).
Infant nutritionWe obtained a 24-h dietary recall at 12 months through standardised interviews with parents held by 2 trained dieticians. All the quantities of food and drink consumed were expressed in grams/person/day. To calculate nutrient intake, we used the REGAL (Répertoire général des Aliments) food composition table22 supplemented with the Mataix Verdú Spanish food composition table.23 We calculated the percent of the total energy intake contributed by the different macronutrients.
The recall documented all breastmilk, artificial formula and cow's milk feedings. We estimated the volume of breastmilk based on the age of the infant (600mL/day at 6 months).24 We calculated the intake of formula taking into account that 4.7g of powder formula are usually added to every 30mL of water. We obtained the data for calculation of the composition of breastmilk from the Tratado de nutrición edited by Gil.25
We created 2 categories to classify simple carbohydrates: natural sugars contained in whole fruits, vegetables, milk and cereals (rice, bread, pasta, flour), and free sugars contained in sweetened dairy desserts, sugary drinks (fresh and processed juices, soft drinks), sweetened cereals (sweetened breakfast cereals, biscuits, baked goods) and chocolate, sugar and honey.
We calculated the percent of the total energy intake contributed by free sugars. This calculation allowed us to define the standard threshold proposed by the WHO,11 which recommends that FSs should contribute less than 10% of the total energy.
Statistical analysisWe present the results as percentages, means and standard deviations.
We used the Student's t test to compare means and the chi square test to compare categorical variables.
To analyse the association between the percentage of the total energy contributed by FSs at 12 months and the presence of excess weight at 30 months, we fitted a logistic regression model. The dependent variable was weight-for-height at 30 months, which was a dichotomous variable with the following categories: 0 (absence of excess weight) and 1 (presence of excess weight). The independent variable was the percent energy from FSs at 12 months, and the logistic regression was performed selecting the ENTER method and adjusting for the following confounders: percent energy contributed by natural sugars (%), starches (%), proteins (%) and lipids (%), fibre intake (g) and energy intake (kcal) at 12 months, birth weight status (0: no excess weight; 1: excess weight), mode of infant feeding through 6 months (0: formula; 1: exclusive/mixed breastfeeding), sex (0: female, 1: male) and socioeconomic status (0: low; 1: middle/high).
We defined statistical significance as a P-value of less than 0.05 in any of the tests. The statistical analysis was performed with the software SPSS for Windows, version 20.0.
ResultsTable 1 presents the characteristics of the mother and of the child at birth and ages 12 and 30 months. The sample included 81 children, of who 44.6% were male. A total of 84.2% of infants were exclusively breastfeed as newborns. Excess weight was identified in 31.2% of the sample at age 12 months and 39.5% of the sample at 30 months.
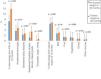
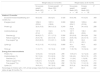
Children with excess weight at 30 months had consumed a higher percentage of the total energy in the form FSs at 12 months compared to the group of children without excess weight at 30 months (Table 2). Of all children with excess weight, 60.9% consumed more than 10% of the total energy in the form of FSs, compared to 39.1% in the group without excess weight. Overall, 40.4% of children were consuming FSs in excess of the 10% of the total energy intake recommended by the WHO. Fig. 1 shows the percent of the total energy contributed by free and natural sugars at 12 months by weight status at 30 months. We found a significantly greater absolute intake of FSs in children with excess weight compared to children without excess weight at 30 months (P=.030). The excessive intake of FSs resulted from a greater consumption of sugary drinks, sweetened breakfast cereals, biscuits, baked goods, chocolate, sugar and honey.
Energy and macronutrient intake at age 12 months by weight status at age 30 months.
| Weight status at 12 months | Weight status at 30 months | |||||
|---|---|---|---|---|---|---|
| No excess weight Mean (SD) n=57 | Excess weight Mean (SD) n=24 | P | No excess weight Mean (SD) n=49 | Excess weight Mean (SD) n=32 | P | |
| Intake at 12 months | ||||||
| Exclusive/mixed breastfeeding at 6 months (%) | 69.2 (55) | 30.8 (27) | 0.435 | 54.5 (44) | 47.8 (37) | .489 |
| Energies (kcal) | 1056.5 (233.6) | 1057.3 (189.9) | 0.990 | 1089.5 (234.7) | 1053.6 (215.6) | .484 |
| Protein (g) | 32.6 (10.3) | 36.6 (12.3) | 0.240 | 34.8 (12.3) | 34 (10.9) | .288 |
| Carbohydrates (g) | 137.3 (31.2) | 134.5 (20.3) | 0.716 | 137.7 (29.3) | 138.3 (29.6) | .863 |
| Starches (g) | 26.8 (21.7) | 27.1 (17.2) | 0.956 | 29 (19.9) | 28.8 (24) | .782 |
| Natural sugarsa (g) | 24.4 (7.6) | 23.0 (7.8) | 0.531 | 24.9 (7.8) | 23.3 (7.4) | .574 |
| Free sugarsb (g) | 29.3 (30.5) | 31.6 (31.1) | 0.286 | 28.8 (31.1) | 33.8 (32.1) | .646 |
| Lipids (g) | 41.2 (11.0) | 41.3 (13.2) | 0.866 | 43.1 (11.8) | 40.5 (12.2) | .423 |
| Fibre (g) | 11.3 (7.7) | 10.7 (3.4) | 0.991 | 11.8 (7.8) | 10.3 (2.4) | .347 |
| Energy from macronutrients | ||||||
| Protein (%) | 12.9 (2.3) | 13.6 (2.8) | .298 | 13.6 (2.7) | 12.7 (2.2) | .224 |
| Carbohydrates (%) | 52.1 (5.4) | 51.6 (6.9) | .762 | 5.8 (4.9) | 52.9 (7.0) | .279 |
| Starches (%) | 9.5 (6.7) | 10.1 (5.9) | .764 | 1.1 (6.4) | 1.3 (6.8) | .263 |
| Natural sugarsa (%) | 6.8 (2.7) | 6.3 (2.6) | .555 | 6.4 (2.4) | 6.8 (2.6) | .711 |
| Free sugarsb (%) | 7.9 (7.6) | 10.3 (8.9) | .092 | 7.3 (7.2) | 11.9 (1.5) | .030 |
| Lipids (%) | 34.9 (4.1) | 34.7 (5.6) | .866 | 35.3 (4) | 34.4 (5.8) | .500 |
| Percentage of children with >10% of total energy intake from free sugars by weight status at age 30 months (%) | 39.1 | 60.9 | .032 | |||
Values expressed as mean and standard deviation (SD).
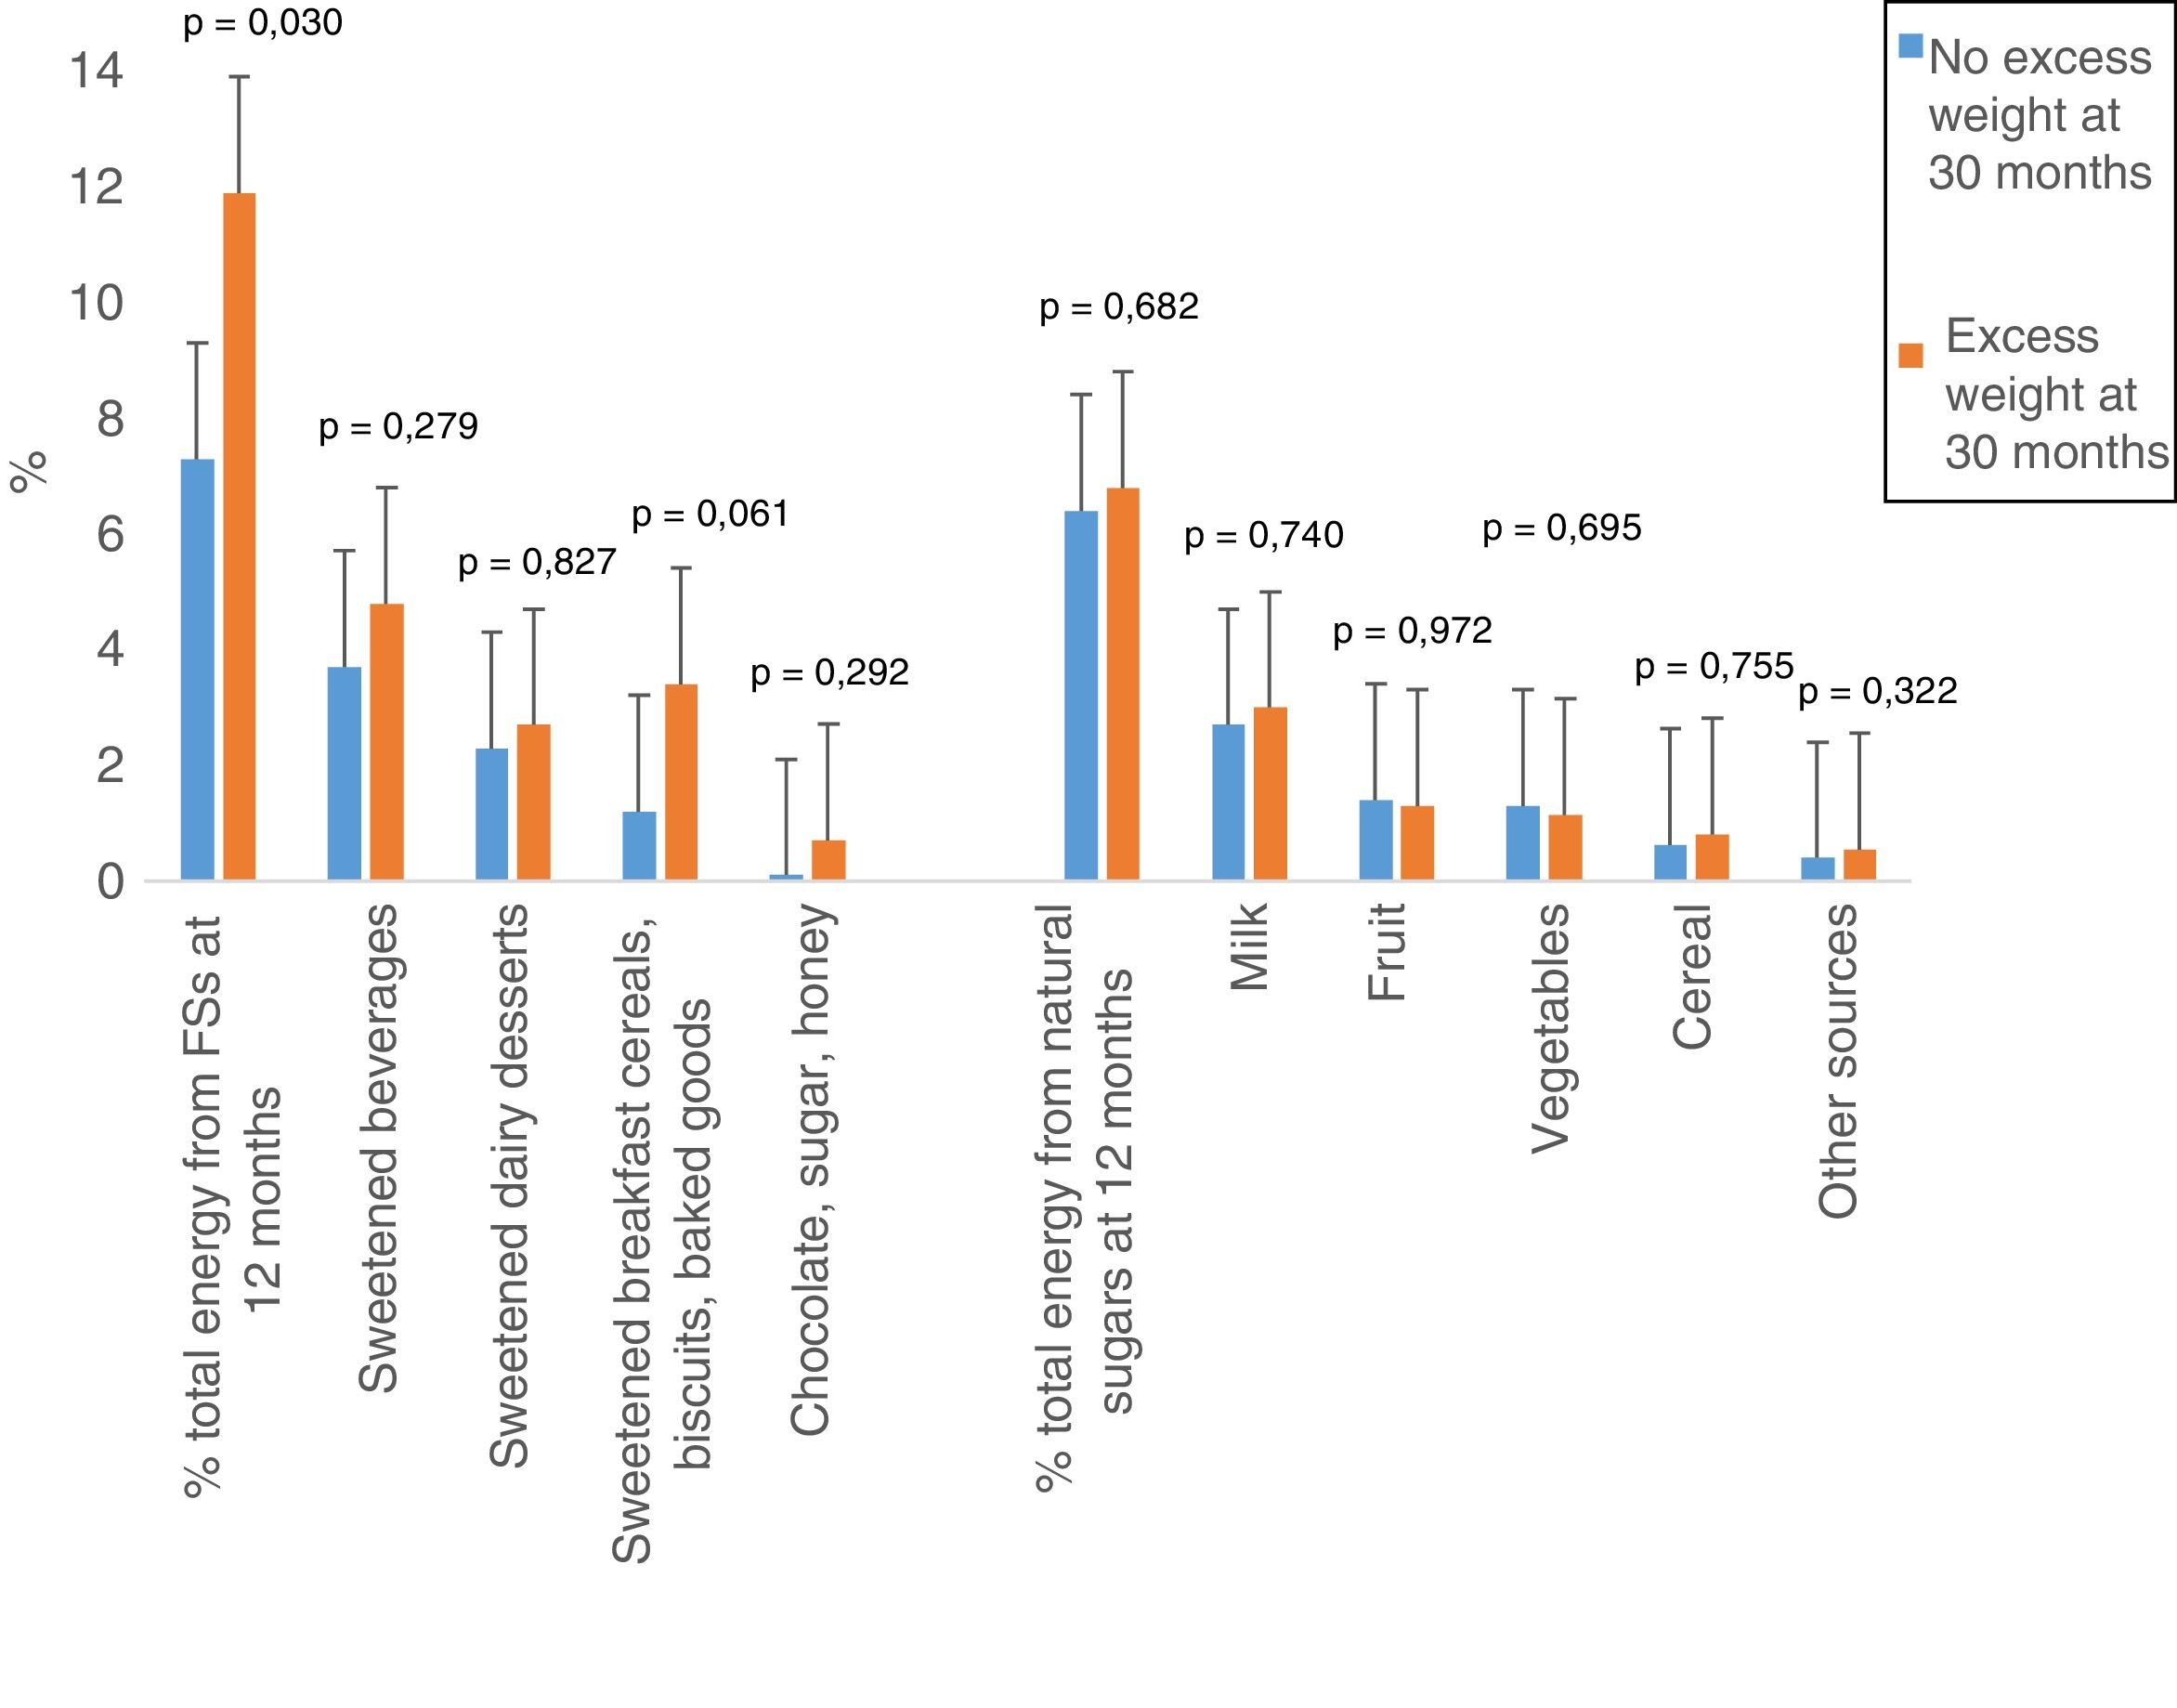
Table 3 presents the results of the logistic regression analysis of the association of macronutrient intake at 12 months and the risk of excess weight at 30 months. Consumption of FSs at 12 months was associated with an increased probability of excess weight at 30 months (OR=1.136; P=.008). Male sex was also associated with an increased risk of excess weight (OR=5.348; P=.045).
Association between macronutrient intake at age 12 months and other variables and the risk of having developed excess weight by 30 months.
| Dependent variable | Independent variable | Adjusted OR | 95% CI | P |
|---|---|---|---|---|
| Weight-for-height at 30 months (without vs with excess weight) | Free sugars 12 months (%) | 1.136 | 1.033–1.248 | .008 |
| Natural sugars 12 months (%) | 1.139 | 0.815–1.592 | .445 | |
| Starches 12 months (%) | 1.101 | 0.964–1.257 | .154 | |
| Protein 12 months (%) | 0.770 | 0.548–1.082 | .132 | |
| Lipids 12 months (%) | 1.013 | 0.854–1.202 | .879 | |
| Fibre 12 months (g) | 0.903 | 0.779–1.047 | .176 | |
| Energy 12 months (kcal) | 0.998 | 0.994–1.003 | .420 | |
| Weight-for-age z-score 0 month (0: no excess weight; 1: excess weight) | 5.370 | 0.574–50.236 | .141 | |
| Mode of feeding at 6 months (0: FF; 1: EBF/MBF) | 0.669 | 0.118–3.776 | .649 | |
| Sex (0: female; 1: male) | 5.348 | 1.036–27.605 | .045 | |
| Socioeconomic status (0: low; 1: middle/high) | 1.700 | 0.128–22.560 | .688 |
Multivariate logistic regression. Odds ratio adjusted for intake of free sugars, natural sugars, starches, protein, fibre, lipids, weight-for-age z-score at 0 months (0: no excess weight; 1: excess weight), mode of feeding at 6 months (0: formula feeding; 1: exclusive/mixed breastfeeding), sex (0: female; 1: male), and socioeconomic status (0: low; 1: middle/high).
Our study analysed the association between the excessive contribution of FSs to the total dietary energy intake at 12 months and the presence of excess weight at 30 months. We found an intake of FSs in infants that vastly exceeded the threshold of 10% of the total energy recommended by the WHO.11 Several studies have described this association in adolescents and adults, but the data on young children are scarce.
We carried out our study in the city of Reus (Tarragona, Spain). Most children belonged to families of middle-to-high socioeconomic status. The protocol for measurement of anthropometric variables, dietary assessment and the performance of interviews and administration of questionnaires was standardised for implementation by all professionals involved in the study with the aim of minimising interrater variability in data collection.
Our results show that a high percentage of children had excess weight at age 12 months (31.2%), and that this percentage increased even more by 30 months (39.5%), which was consistent with the findings of a nationwide study conducted recently in Spain.4 This high prevalence in young children has been associated with a high consumption of high-energy processed foods rich in fats, sugars and protein and a low consumption of fruits and vegetables, a low household socioeconomic level, sedentary lifestyles and sleep deprivation.26
The WHO recommends restricting the consumption of FSs to less than 10% of the total energy intake in the general population. However, there is disagreement as to whether fruit juices are included in the FS definition.11 In our analysis, we included juice in the sugars applied to the WHO threshold, since the consumption of fruit juices has been associated with a lower degree of energy compensation compared to consumption of fruit in solid form, thus promoting the overconsumption of energy and underconsumption of fibre.27 However, other authors consider that there is insufficient evidence to confirm an association of fruit juice with overweight and obesity like the one that exists between excess weight and other sugary beverages.28
In our study, we observed that a high percentage of infants consumed more than the 10% of the total energy recommended by the WHO in the form of HFs, and that this percentage increased with age. The study conducted in Italy by Sette et al. in a cohort of 3323 children and adults found a higher intake of soluble carbohydrates (25%) in the 0–2.9 years age group.29 This percentage may correspond to free sugars, although the term “soluble carbohydrates” was not clearly defined. The Diet and Nutrition Survey of Infants and Young Children aged 4–18 of the Department of Health and Food standards in the United Kingdom also found evidence of a higher-than-recommended consumption of ASs.30,31 This intake pattern in which free and added sugars contribute more than 10% of the total energy has been associated with obesity and chronic diseases.9–11,16,32 There is considerable variability in the terminology used to refer to sugars. Alles et al. analysed different studies on nutrient intake in Europe and highlighted the diversity of the terminology used.9 Hur et al. measured the consumption of sugar-sweetened beverages and included natural fruit juices in this category.10
Our results show that consumption of FSs at age 12 months is associated with a 12% increase in the prevalence of excess weight at 30 months. Most studies conducted in adults or children have compared the consumption of sugar-sweetened beverages to the increase in obesity, and very few have considered the total intake of FSs.16 While the total intake of FSs and/or ASs has been associated with excess weight in adults, few studies in children have found an association between their intake and excess weight, as most of them have focused solely on sugar-sweetened beverages.17,32,33 Only 2 studies have found an association with the risk of excess weight in children,4,15 while others have not found an association.13,34–36 In agreement with our findings, in the Turku Coronary Risk Factor Intervention Project, children with a high intake of FSs between ages 13 months and 9 years had greater body weights in the first year of followup, while between ages 4 and 9 years their body mass index (BMI) was lower compared to children with an average to low consumption of FSs.14 Maunder et al. found a greater proportion of excess weight in children aged 4–8 years that consumed more ASs.15 In contrast, other prospective studies conducted in children in Germany and Hispanic children and youth in the United States did not find an association with changes in BMI,13,34,36 although the study by Davis et al. did analyse the consumption of ASs and sugary beverages.36 The intake of all other macronutrients conformed to the nutritional guidelines established by the WHO.37
Many of the foods marketed for infants or young children are rich in free or added sugars and tend to be introduced in the diet at an early stage, so that in addition to increasing the risk of future obesity, they may predispose individuals to develop a taste preference for sweet foods in the future.32,38 Although the WHO recommends reducing the intake of FSs in children and not introducing sugar in the diet of young children until age 1 year, European legislation and Commission Directive 2006/125/EC or the Spanish Royal Decree 490/1998 allow a higher-than-recommended proportion of sugar (20% of the total energy from ASs) in foods marketed to young children.39 Elliot and Conlon found that most of these foods contravene nutritional recommendations, and some vastly exceed the recommended sugar content.40
This excessive consumption of both free and added sugars at early ages should be restricted, as it not only contributes to excess weight, but also predisposes individuals to the development of caries, type 2 diabetes, hypertension, insulin resistance and dyslipidaemia,16 and to consumption of a poorer diet overall, as these foods do not contribute essential nutrients. Thus, nutrition in this stage of life should be evaluated to increase adherence to nutritional recommendations for this age group with the aim of achieving an optimal nutritional status in the short as well as the long term. The establishment of a single, standardised nomenclature for sugars would also be helpful, resolving the confusion that exists to date.
There are limitations to our study, such as its small sample size. Nevertheless, our study contributes longitudinal data on an age group for which there is little evidence in the current literature. We consider that our results clearly reflect the excessive consumption of FSs in this age group, although further studies with larger samples are required to confirm the association under study. Another limitation is that we had no methodological means to make adjustments to determine the role of fresh vs processed fruit juices due to the current controversy regarding the inclusion of these foods in the FS definition. At any rate, in our study we applied the criterion defined by the WHO. Yet another was that we were unable to assess the weight of mothers in the study, although we took into account other important confounders described in the previous literature that may have an impact on excess weight in young children.
ConclusionOur study contributes new data on the association between free sugar intake at age 12 months and excess weight at 30 months. At 12 months, 40.4% of infants had a FS intake that exceeded the threshold recommended by the WHO. This excessive intake at 12 months was associated with a greater probability of having excess weight at age 30 months, which means that excessive consumption of FSs have deleterious effects even in early childhood. However, our results should be confirmed by further research in young children.
Conflicts of interestThe authors have no conflicts of interest to declare.
We are thankful to the young children and the parents that participated in the study, and to the entire DeFensas research team: Núria Voltas, Carmen Hernández, Josefa Canals, Joaquín Escribano, Rosa Jiménez and Josep Maria Barroso.
Please cite this article as: Jardí C, Aranda N, Bedmar C, Ribot B, Elias I, Aparicio E, et al. Ingesta de azúcares libres y exceso de peso en edades tempranas. Estudio longitudinal. An Pediatr (Barc). 2019;90:165–172.
