


The present study evaluates energy and nutrient intake in Spanish children under three years of age, and compares the results with the current recommendations in order to identify possible inadequate nutrient intake.
Patients and methodsA cross-sectional pilot study. The mothers completed a diet diary for four non-consecutive days, recording the products and amounts consumed by their children. Nutrient intake was calculated, and the results were compared with the dietary reference intakes (DRI) for each age group.
ResultsA total of 188 children (93 boys and 95 girls) aged 0–6 (n=41), 7–12 (n=24), 13–24 (n=57), and 25–36 months (n=66) were included. Statistically significant differences in DRI were observed for most of the nutrients analysed. Protein intake, in particular was 376% of DRI in children between 1 and 3 years of age. By age groups, 96% of the children aged 7–12 months, 88% of the children aged 13–24 months, and 97% of the children aged 25–36 months showed protein intakes more than twofold DRI.
ConclusionsNutrient intake differed from the DRI, particularly as regards proteins. A new study is required to determine whether the observed study deviations could be representative of the national population of this age group, as well as the possible effects on child health.
El objetivo de este estudio fue evaluar el consumo de energía y nutrientes en niños españoles menores de 3 años y comparar los resultados con las recomendaciones actuales, para comprobar si su ingesta era adecuada.
Pacientes y métodosEstudio piloto transversal. Las madres completaron un diario dietético sobre el consumo de alimentos de sus hijos, durante 4 días no consecutivos, registrando los productos y las cantidades consumidas. Se calcularon el consumo de nutrientes y los resultados se compararon con las Dietary Reference Intakes (DRI) para cada grupo de edad.
ResultadosSe incluyó a 188 niños (93 niños, 95 niñas) con edades de 0-6 meses (41), 7-12 meses (24), 13-24 meses (57) y 25-36 meses (66). Se observaron diferencias estadísticamente significativas respecto a las DRI en el consumo de la mayoría de los nutrientes analizados. Destacó el exceso de consumo de proteínas, que alcanza el 376% de las DRI en los niños entre uno y 3 años. El 96% de los niños de 7 a 12 meses, el 88% de los niños de 13 a 24 meses y el 97% de los niños de 25 a 36 meses consumían proteínas por encima del doble de las DRI.
ConclusionesLa ingesta de nutrientes difirió de las DRI, especialmente en lo referido a las proteínas. Se debería evaluar si las desviaciones observadas en el estudio son extensibles a la población nacional de este grupo de edad en un estudio con una muestra representativa y las posibles repercusiones sobre la salud de los niños.
The increased prevalence of childhood obesity has become an issue of global interest due to its relationship with cardiovascular diseases and cancer in the adult age, and its social and public health impact.1,2 All nations have started world-wide obesity prevention programmes and have proposed various nutrient and energy intake guidelines for different age groups based on available scientific evidence.2
In 2005, the Ministerio de Sanidad y Consumo (Ministry of Health and Consumer Affairs) launched NAOS (Strategy for Nutrition, Physical Activity and Prevention of Obesity).3 Research projects on school-age children started as part of this strategy,4,5 but so far none of them have analysed the dietary habits of the youngest children, from birth to 3 years of age, so we can know whether the nutrient intake deviations observed in children start from the early years of life. This study was designed to evaluate this question.
The ALSALMA project has been developed in 3 phases. In the first phase, it examined what 151 paediatricians believed to be the main dietary issues in children who visited their offices. The second phase examined the opinions on the same subject of 712 parents of children between 0 and 36 months of age.6 The third phase has started with a pilot study whose results we are presenting in this paper. This study evaluated the actual nutrient intake in Spanish children, and it is the first of this kind in this age group in Spain.
MethodsStudy design and ethical normsObservational cross-sectional pilot study with data collected in April 2011. We adhered to the Declaration of Helsinki and the norms applicable to observational studies in Spain. The study was approved by the Ethics Board of the Hospital Clínic i Provincial de Barcelona. Every parent or guardian agreed to participate in the study by means of written informed consent.
Participant selection criteriaWe selected the families from a consumer database that had information on over 30,000 families by random sampling, stratified by sex and 4 age groups.7 We selected families from cities with populations greater than 200,000 inhabitants. We calculated the sample size for the purposes of a descriptive pilot study.
Data collection method for the variables under studyWe designed a diet diary for the parents, who were instructed on how to complete it. It was used to record all the foods consumed by the children in 4 non-consecutive days, 2 week and 2 weekend days. We collected sex and age data for the children.
Breast milk volume was estimated according to the child's age: 700–900ml/day in children younger than 6 months, and 600ml/day in children older than 6 months.8
Statistical analysisWe performed a descriptive analysis using frequency distribution and percentages for qualitative variables, and the mean, percentiles, standard deviation, and 95% confidence interval for quantitative variables. We compared proportions using the chi-squared test, and ANOVA for quantitative variables, with a 0.05 significance level. We used the SPSS statistics software version 14.0.
We converted each food to its nutrient and caloric content using the “Tabla de composición de alimentos españoles” (Table of Spanish foods composition).9 We calculated the composition of child nutrition products using the available data of the commercial brand consumed. We followed the guidelines for designing population-based studies on diet and nutrition in Spain.10
We compared the results of the study with the Recommended Dietary Allowances/Adequate Intake (RDA/AI) guidelines for each nutrient, outlined in the Dietary Reference Intakes (DRI) (2002/2005) of the National Academy of Sciences and the Committee on Nutrition of the AEP (Spanish Association of Paediatrics).11–13
ResultsSociodemographic dataOut of 200 selected children, the information of 188 was valid for our analysis: Alicante (35 participants), Barcelona (32), Gijon (26), Madrid (38), Seville (26), and Valencia (31).
Of all children, 49.5% were boys (93 participants) and 50.5% girls (95 participants), with a mean age of 19 months (95% CI, 17–20), a median of 18 months, and an age range of 1–36 months. We analysed 4 age groups: 41 children 0–6 months (21.8%), 24 children 7–12 months (12.8%), 57 children 13–24 months (30.3%) and 66 children 25–36 months of age (35.1%).
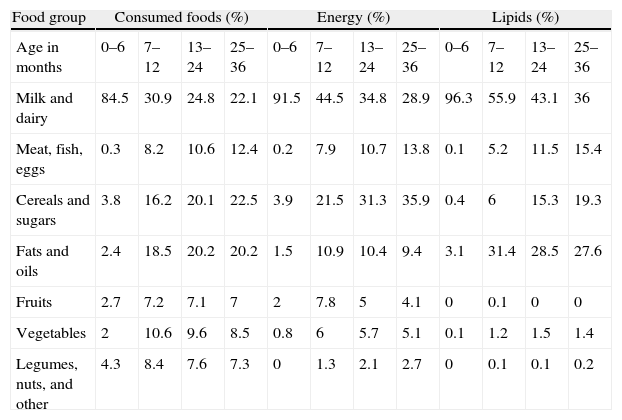
Consumed foodsWe analysed 9520 foods, with a mean daily consumption of 13 foods per child. Table 1 lists the foods consumed by food groups, with their contribution to energy intake and their macronutrients. Out of the 29 children younger than 4 months, 65.5% (n=19) breastfed exclusively. Children who consumed more than 500ml of milk a day were 100% of children between 0 and 6 months (an average of 897ml, 95% CI, 823–971), 58.3% of children 7–12 months (656ml, 95% CI, 519–793), 59.6% of children 13–24 months (561ml, 95% CI, 480–643) and 48.5% of children older than 25 months (490ml, 95% CI, 430–549).
Energy intake, proteins, lipids, and carbohydrates per each food group consumed.
| Food group | Consumed foods (%) | Energy (%) | Lipids (%) | |||||||||
| Age in months | 0–6 | 7–12 | 13–24 | 25–36 | 0–6 | 7–12 | 13–24 | 25–36 | 0–6 | 7–12 | 13–24 | 25–36 |
| Milk and dairy | 84.5 | 30.9 | 24.8 | 22.1 | 91.5 | 44.5 | 34.8 | 28.9 | 96.3 | 55.9 | 43.1 | 36 |
| Meat, fish, eggs | 0.3 | 8.2 | 10.6 | 12.4 | 0.2 | 7.9 | 10.7 | 13.8 | 0.1 | 5.2 | 11.5 | 15.4 |
| Cereals and sugars | 3.8 | 16.2 | 20.1 | 22.5 | 3.9 | 21.5 | 31.3 | 35.9 | 0.4 | 6 | 15.3 | 19.3 |
| Fats and oils | 2.4 | 18.5 | 20.2 | 20.2 | 1.5 | 10.9 | 10.4 | 9.4 | 3.1 | 31.4 | 28.5 | 27.6 |
| Fruits | 2.7 | 7.2 | 7.1 | 7 | 2 | 7.8 | 5 | 4.1 | 0 | 0.1 | 0 | 0 |
| Vegetables | 2 | 10.6 | 9.6 | 8.5 | 0.8 | 6 | 5.7 | 5.1 | 0.1 | 1.2 | 1.5 | 1.4 |
| Legumes, nuts, and other | 4.3 | 8.4 | 7.6 | 7.3 | 0 | 1.3 | 2.1 | 2.7 | 0 | 0.1 | 0.1 | 0.2 |
| Proteins (%) | Carbohydrates (%) | ||||||
| 0–6 | 7–12 | 13–24 | 25–36 | 0–6 | 7–12 | 13–24 | 25–36 |
| 90.9 | 31.6 | 32.4 | 28.3 | 86.6 | 40 | 28.9 | 24.0 |
| 1.6 | 42.6 | 38.9 | 44.5 | 0 | 0.2 | 1.4 | 2.7 |
| 4.6 | 14.1 | 19.0 | 19.6 | 7.3 | 33.6 | 47.1 | 52.6 |
| 0 | 0 | 0 | 0 | 0 | 0 | 0 | 0 |
| .8 | 1.5 | 0.9 | 0.7 | 4.6 | 15.1 | 10.1 | 8.1 |
| 2.2 | 9.7 | 7.9 | 5.9 | 1.5 | 8.6 | 8.4 | 7.5 |
| 0 | 0.6 | 0.8 | 1.0 | 0 | 2.5 | 4.1 | 5.1 |
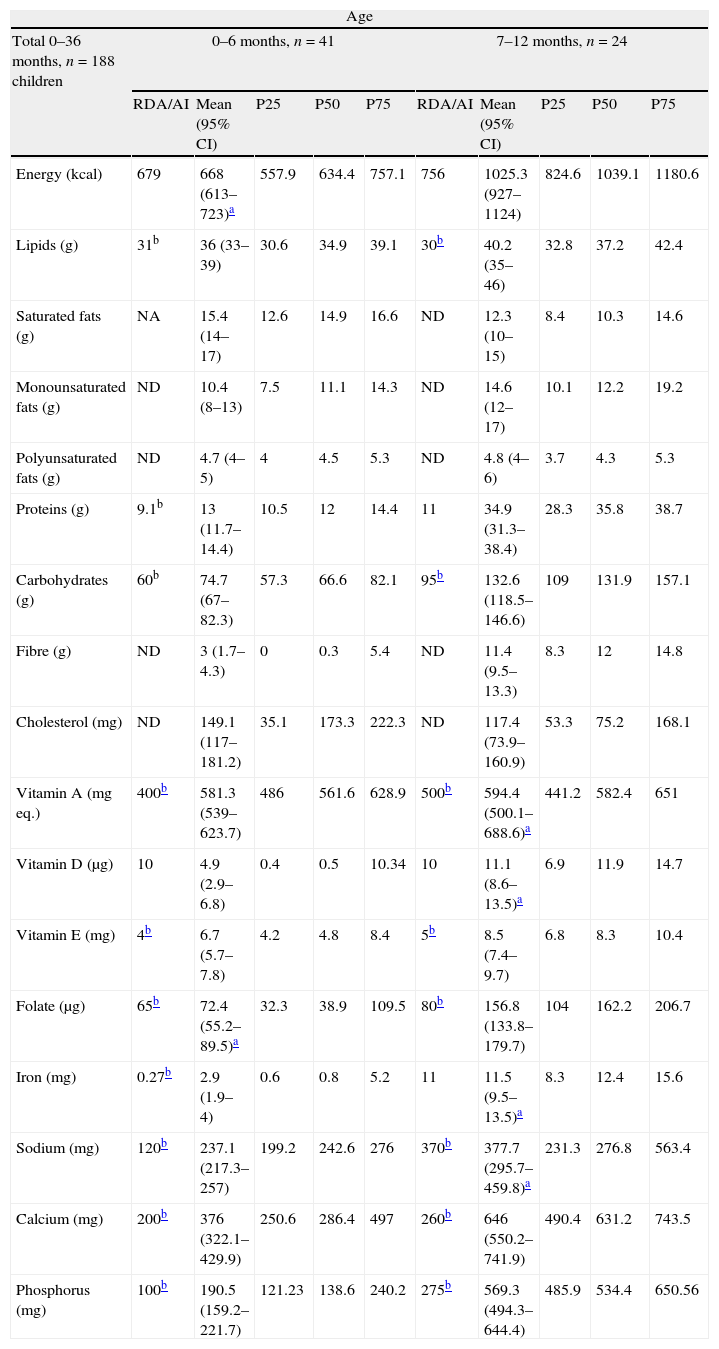
Table 2 lists the average daily intake of energy and nutrients. We did not find significant differences between boys and girls.
Mean daily energy and nutrient intake by age group.
| Age | ||||||||||
| Total 0–36 months, n=188 children | 0–6 months, n=41 | 7–12 months, n=24 | ||||||||
| RDA/AI | Mean (95% CI) | P25 | P50 | P75 | RDA/AI | Mean (95% CI) | P25 | P50 | P75 | |
| Energy (kcal) | 679 | 668 (613–723)a | 557.9 | 634.4 | 757.1 | 756 | 1025.3 (927–1124) | 824.6 | 1039.1 | 1180.6 |
| Lipids (g) | 31b | 36 (33–39) | 30.6 | 34.9 | 39.1 | 30b | 40.2 (35–46) | 32.8 | 37.2 | 42.4 |
| Saturated fats (g) | NA | 15.4 (14–17) | 12.6 | 14.9 | 16.6 | ND | 12.3 (10–15) | 8.4 | 10.3 | 14.6 |
| Monounsaturated fats (g) | ND | 10.4 (8–13) | 7.5 | 11.1 | 14.3 | ND | 14.6 (12–17) | 10.1 | 12.2 | 19.2 |
| Polyunsaturated fats (g) | ND | 4.7 (4–5) | 4 | 4.5 | 5.3 | ND | 4.8 (4–6) | 3.7 | 4.3 | 5.3 |
| Proteins (g) | 9.1b | 13 (11.7–14.4) | 10.5 | 12 | 14.4 | 11 | 34.9 (31.3–38.4) | 28.3 | 35.8 | 38.7 |
| Carbohydrates (g) | 60b | 74.7 (67–82.3) | 57.3 | 66.6 | 82.1 | 95b | 132.6 (118.5–146.6) | 109 | 131.9 | 157.1 |
| Fibre (g) | ND | 3 (1.7–4.3) | 0 | 0.3 | 5.4 | ND | 11.4 (9.5–13.3) | 8.3 | 12 | 14.8 |
| Cholesterol (mg) | ND | 149.1 (117–181.2) | 35.1 | 173.3 | 222.3 | ND | 117.4 (73.9–160.9) | 53.3 | 75.2 | 168.1 |
| Vitamin A (mgeq.) | 400b | 581.3 (539–623.7) | 486 | 561.6 | 628.9 | 500b | 594.4 (500.1–688.6)a | 441.2 | 582.4 | 651 |
| Vitamin D (μg) | 10 | 4.9 (2.9–6.8) | 0.4 | 0.5 | 10.34 | 10 | 11.1 (8.6–13.5)a | 6.9 | 11.9 | 14.7 |
| Vitamin E (mg) | 4b | 6.7 (5.7–7.8) | 4.2 | 4.8 | 8.4 | 5b | 8.5 (7.4–9.7) | 6.8 | 8.3 | 10.4 |
| Folate (μg) | 65b | 72.4 (55.2–89.5)a | 32.3 | 38.9 | 109.5 | 80b | 156.8 (133.8–179.7) | 104 | 162.2 | 206.7 |
| Iron (mg) | 0.27b | 2.9 (1.9–4) | 0.6 | 0.8 | 5.2 | 11 | 11.5 (9.5–13.5)a | 8.3 | 12.4 | 15.6 |
| Sodium (mg) | 120b | 237.1 (217.3–257) | 199.2 | 242.6 | 276 | 370b | 377.7 (295.7–459.8)a | 231.3 | 276.8 | 563.4 |
| Calcium (mg) | 200b | 376 (322.1–429.9) | 250.6 | 286.4 | 497 | 260b | 646 (550.2–741.9) | 490.4 | 631.2 | 743.5 |
| Phosphorus (mg) | 100b | 190.5 (159.2–221.7) | 121.23 | 138.6 | 240.2 | 275b | 569.3 (494.3–644.4) | 485.9 | 534.4 | 650.56 |
| Age | ||||||||||
| Total 0–36 months, n=188 children | 13–24 months, n=57 | 25–36 months, n=66 | ||||||||
| RDA/AI | Mean (95% CI) | P25 | P50 | P75 | RDA/AI | Mean (95% CI) | P25 | P50 | P75 | |
| Energy (kcal) | 1092 | 1202.6 (1117–1288) | 1000.9 | 1129.7 | 1361.2 | 1092 | 1281.3 (1192–1371) | 1062.1 | 1234.4 | 1412.9 |
| Lipids (g) | 30–40c | 48.6 (45–53) | 37.4 | 48.3 | 57.3 | 30–40c | 48.7 (45–53) | 42.4 | 46.4 | 56.1 |
| Saturated fats (g) | ND | 15.9 (14–18) | 10.7 | 15.1 | 19.2 | ND | 16.2 (15–18) | 12 | 15.5 | 18.6 |
| Monounsaturated fats (g) | ND | 19.4 (18–21) | 15.4 | 19.6 | 23.5 | ND | 19.7 (18–21) | 16.5 | 20 | 22.4 |
| Polyunsaturated fats (g) | ND | 4.9 (4.5–5) | 3.8 | 5 | 6 | ND | 4.7 (4.3–5) | 3.8 | 4.4 | 5.3 |
| Proteins (g) | 13 | 45.1 (40.7–49.5) | 30.5 | 42.5 | 55.5 | 13 | 52.1 (48.7–55.4) | 45.4 | 52.1 | 58.2 |
| Carbohydrates (g) | 130 | 151.5 (138.8–164.3) | 124.3 | 140.6 | 171.9 | 130 | 165.7 (152.1–179.3) | 126.1 | 152.4 | 195.3 |
| Fibre (g) | 19b | 10 (8.9–11.1) | 7.2 | 10.6 | 12.3 | 19b | 9.1 (8–10.2) | 5.8 | 8 | 12.1 |
| Cholesterol (mg) | ND | 189.6 (165.4–213.8) | 121.5 | 174.3 | 255.2 | ND | 212.2 (188.9–235.4) | 154.8 | 215.9 | 252.8 |
| Vitamin A (mgeq.) | 300 | 489.4 (435.9–542.9) | 348.7 | 496.1 | 609.6 | 300 | 434.2 (373.3–495.1) | 242.6 | 382.6 | 571.7 |
| Vitamin D (μg) | 15 | 7.4 (5.8–9.1) | 1.6 | 6.6 | 11.4 | 15 | 6.6 (5.1–8.1) | 1.7 | 3.9 | 11.4 |
| Vitamin E (mg) | 6 | 7.1 (6.3–7.9) | 4.7 | 6.6 | 8.6 | 6 | 6.8 (6–7.6)a | 4.1 | 5.6 | 9.3 |
| Folate (μg) | 150 | 166 (148.1–183.9)a | 130.2 | 162.4 | 199.78 | 150 | 170 (154.1–186) | 120.1 | 157.8 | 217.7 |
| Iron (mg) | 7 | 10.4 (9.1–11.8) | 6.8 | 9.6 | 14.1 | 7 | 11.1 (9.9–12.4) | 7.2 | 9.9 | 13.8 |
| Sodium (mg) | 1000b | 821.3 (703.8–938.7) | 500.1 | 714.9 | 1109.6 | 1000b | 988.1 (890.3–1086)a | 717.6 | 900.4 | 1236.2 |
| Calcium (mg) | 700 | 749.9 (652–847.9)a | 514.3 | 692.6 | 974.9 | 700 | 798.2 (725–871.4) | 583.3 | 803.9 | 970.9 |
| Phosphorus (mg) | 460 | 834.9 (742.1–927.7) | 617.8 | 814.4 | 991.8 | 460 | 955.5 (889.4–1021.6) | 807.3 | 946.7 | 1104.4 |
95% CI, 95% confidence interval for the mean; NA, no recommendations exist for this nutrient or this age group; P25, P50, P75: 25, 50, and 75 percentiles for each variable and age group.
Energy or nutrients with no significant statistical difference relative to the RDA/AI (p>0.05), other p values are described in the text body (compliance with RDA/AI).
RDA/AI: Recommended Dietary Allowances/Adequate Intake: RDA are established as the reference values for each nutrient that would cover the needs of 97–98% of individuals in that group. AI are values that are estimated to cover the requirements of all individuals in each age group. This figure is used as a reference in the absence of a reference RDA. AI values are marked with a b.
Table 2 shows the recommended daily intake values (RDA/AI) for energy and nutrients.11–13
Children 0–6 months showed a statistically significant difference in the mean daily intake of every nutrient relative to RDA/AI values (p<0.001), save for the intake of energy (p=0.683), polyunsaturated fats (p=0.235), and folate (p=0.391).
At 7–12 months, we observed significant differences compared with RDA/AI in all nutrients (p<0.001) except polyunsaturated fats (p=0.359), vitamin A (p=0.05), vitamin D (p=0.77), iron (p=0.615) and sodium (p=0.847).
Between 13 and 24 months, we observed significant differences relative to the RDA/AI in all nutrients (p<0.001), except folate (p=0.08) and calcium (p=0.312).
Between 25 and 36 months, we observed significant differences relative to the RDA/AI in all nutrients (p<0.001), except vitamin E (p=0.059) and sodium (p=0.810).
The mean daily protein intake in children 0–12 months was 21g (95% CI, 18–24), with a median of 15.6g, and in children 13–36 months the mean was 48.9g (95% CI, 46.1–52), with a median of 50.3g.
Percentage of adequacy in relation to recommendationsFig. 1 shows the results in percentages of compliance with RDA/AI.
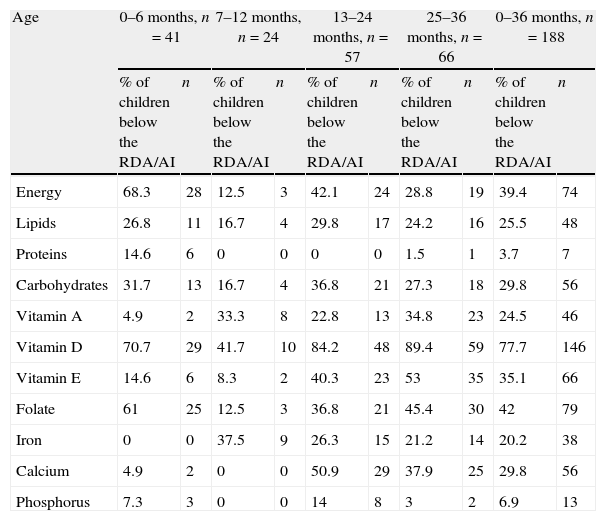
Proportion of children below the Recommended Dietary Allowances.")
Table 3 lists the proportion of children who had energy and nutrient intakes below the RDA.
Energy and nutrient intake: proportion of children below the RDA/AI.
| Age | 0–6 months, n=41 | 7–12 months, n=24 | 13–24 months, n=57 | 25–36 months, n=66 | 0–36 months, n=188 | |||||
| % of children below the RDA/AI | n | % of children below the RDA/AI | n | % of children below the RDA/AI | n | % of children below the RDA/AI | n | % of children below the RDA/AI | n | |
| Energy | 68.3 | 28 | 12.5 | 3 | 42.1 | 24 | 28.8 | 19 | 39.4 | 74 |
| Lipids | 26.8 | 11 | 16.7 | 4 | 29.8 | 17 | 24.2 | 16 | 25.5 | 48 |
| Proteins | 14.6 | 6 | 0 | 0 | 0 | 0 | 1.5 | 1 | 3.7 | 7 |
| Carbohydrates | 31.7 | 13 | 16.7 | 4 | 36.8 | 21 | 27.3 | 18 | 29.8 | 56 |
| Vitamin A | 4.9 | 2 | 33.3 | 8 | 22.8 | 13 | 34.8 | 23 | 24.5 | 46 |
| Vitamin D | 70.7 | 29 | 41.7 | 10 | 84.2 | 48 | 89.4 | 59 | 77.7 | 146 |
| Vitamin E | 14.6 | 6 | 8.3 | 2 | 40.3 | 23 | 53 | 35 | 35.1 | 66 |
| Folate | 61 | 25 | 12.5 | 3 | 36.8 | 21 | 45.4 | 30 | 42 | 79 |
| Iron | 0 | 0 | 37.5 | 9 | 26.3 | 15 | 21.2 | 14 | 20.2 | 38 |
| Calcium | 4.9 | 2 | 0 | 0 | 50.9 | 29 | 37.9 | 25 | 29.8 | 56 |
| Phosphorus | 7.3 | 3 | 0 | 0 | 14 | 8 | 3 | 2 | 6.9 | 13 |
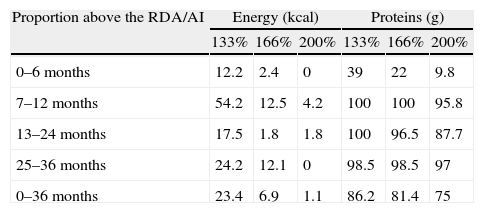
Table 4 shows the proportion of children whose energy and protein intakes were 1/3, 2/3 and 2 times greater than the RDA/AI. The proportion of children between 1 and 3 years with a protein intake 1/3 greater than the RDA/AI was 99.2%, it was 97.6% for an intake 2/3 greater, and 92.7% for an intake at least twice the RDA/AI.
Energy and protein intake: proportion of children above 133%, 166%, and 200% of the RDA/AI.
| Proportion above the RDA/AI | Energy (kcal) | Proteins (g) | ||||
| 133% | 166% | 200% | 133% | 166% | 200% | |
| 0–6 months | 12.2 | 2.4 | 0 | 39 | 22 | 9.8 |
| 7–12 months | 54.2 | 12.5 | 4.2 | 100 | 100 | 95.8 |
| 13–24 months | 17.5 | 1.8 | 1.8 | 100 | 96.5 | 87.7 |
| 25–36 months | 24.2 | 12.1 | 0 | 98.5 | 98.5 | 97 |
| 0–36 months | 23.4 | 6.9 | 1.1 | 86.2 | 81.4 | 75 |
Out of all participants, 1.5% (3 children) had an iron intake below 33.3% of the RDA/AI. Iron intake was between 33.3% and 66.6% in 6.3% (12) of children, and 12.23% (23) had an intake between 66.6% and 100% of the RDA/AI.
Analysis of the energy intake profileFig. 2 shows the proportion of energy contributed by each macronutrient as a function of the child's age. We observed a significant increase in the proportion of calories contributed by proteins as the child grew older (p<0.05), as well as a significant reduction in the proportion of the energy intake contributed by lipids (p<0.05). We did not observe differences in the proportion of calories contributed by carbohydrates as a function of the child's age.
Discussion
Nutrition in the early years of life is important to ensure proper development in children and has an impact on their future health. More specifically, nutrition in the first year of life may influence the physical, neurological, and cognitive development not only in this first year of life but also later on.14–21 This is why we should know what our children eat in these early years and assess whether there are any imbalances in their dietary habits.
The paediatricians who participated in the first phase of the ALSALMA project considered that the main dietary issues in children younger than 3 years were iron and vitamin deficiencies and low weight gain up to 12 months of age. In older ages, they thought the main issues were excessive intake of carbohydrates and lipids, and overweight. Parents’ opinions were consistent with physicians’ opinions.6
The concerns of paediatricians and parents contrasted with the results as analysed by the ALSALMA study. While carbohydrate and lipid intakes fell within acceptable ranges, protein intake was almost 4 times the recommended intake for this age group, a fact that had escaped the notice of paediatricians and parents.
The main sources of energy until 12 months of age were milk and dairy (Table 1), and from then on cereals and sugars. The contribution to the energy intake of the remaining food groups increased with age, except for lipids starting at 24 months, and fruits and vegetables starting at 12 months (p<0.05), the consumption of which decreased gradually as the child grew older, especially for vegetables, which went from 10.6% at 7–12 to 8.5% at 36 months. This deviation from the Mediterranean diet has been reported in other studies, both in children4,5 and adults,22 and was observed in our study at this early age.
We could already observe an excessive calorie intake relative to the recommended intake in 70% of children (Table 3). In this transitional period in the child's nutrition, the paediatrician's advice on when to start introducing solids is very important, but it is also important to counsel on portion size to avoid excessive energy intakes. Although there does not seem to be a clear relationship between when solids are introduced and childhood obesity,21 there is an evident relationship between excessive energy intake and excess weight at every age.
Protein intake, which was already high in infants (127% of the RDA/AI), reached values of up to 376% of the RDA/AI in children older than one year. This increasing trend in protein intake has also been observed in other European countries in children 1–3 years of age, with protein intakes of 131% of the RDA/AI in Italian children,23 138% in French children,24 and 284% in British children.25 High protein intake has been linked to greater weights in children younger than 2 years,26 increasing the risk of later obesity.27–30 It is believed that protein intake stimulates secretion of insulin-like growth factor 1 (IGF-I), which leads to cell proliferation, accelerates growth, and increases the amount of adipose tissue.30,31
It is important to note that the protein intake of 96%, 88%, and 97% of the children aged 7–12, 13–24, and 25–36 months, respectively (Table 4), was over twofold the recommended intake, which only occurred in 9.8% of children 0–6 months of age, who were not receiving complementary foods yet.
In children younger than 6 months, most of the protein intake came from milk and dairy consumption. In subsequent ages, the main source of protein was meat, fish, and eggs, followed by dairy (Table 1). If the protein intake needs reducing, it should be done by eating less meat and dairy, the foods with the highest protein content.
The intake of polyunsaturated fats amounted to 90.7% of the RDA/AI in children younger than one year, and 62% of the RDA/AI in older children. We observed that lipids contributed 20% of the energy intake in children older than 6 months (Fig. 2). This figure could be accounted for if the amounts of oil added to porridges and purées cooked at home had not been entered correctly in the study questionnaires.
We observed a deficient dietary vitamin D intake in children younger than 12 months, which was only 4.5% of the recommended intake. This can probably be explained by exclusive breastfeeding, as the study did not collect data on vitamin supplements. Between 13 and 36 months, vitamin D intake increased noticeably relative to the previous age group, but it remained 45% lower than the recommended amount. It is worth noting that the vitamin D intake of 71%, 42%, 84%, and 89% of the children under study in the 4 age groups was below the RDA/AI. This fact could be important for their later health, as there is a relationship between vitamin D deficiency and cardiovascular and metabolic disease risk factors.32,33
The dietary folate intake went over the recommended intake in 12% of children older than 1 year, probably due to the greater variety of plant-based foods eaten by these children. We only observed a deficient folate intake in the younger age group (0–6 months), while the intake of children 6–12 months went up to 200% of the recommended intake.
The mean iron intake went over the recommended amounts by 230% in children younger than 12 months and by 154% in older children (Fig. 1). No children between 0 and 6 months had an intake below the recommended one, while in older age groups, 38%, 26%, and 21% consumed less iron than recommended. The prevalence of iron-deficiency anaemia is estimated at 9.6% in children younger than a year in Spain, and at 16.7% (95% CI, 10.5–23) in European children younger than 5 years,34,35 so the proportions of children with iron intakes below the recommendations observed in our study could be consistent with the iron deficiency rates observed in our setting.
Calcium intake was considered adequate (137.8% of RDA/AI in children younger than 12 months and 110.8% of RDA/AI in children older than 12 months), as was the proportion of children who consumed calcium beyond the recommended amounts, although we saw a decreasing trend in calcium intake as age increased.
The limitations of our study are those common to all nutrition studies. Specifically, the prospective recording of several days used in this study could induce changes in the composition of the usual diet. Still, it has been recognised as the standard method for studies with questionnaires on food intake frequency, dietary history, or using the 24-h recall method. The various food composition tables used to estimate nutrient intake and the various reference values used to calculate dietary adequacy further complicate the comparison of studies.36,37
Another limitation of the study was that the sample size was too small to extrapolate the results to the reference population, as this was a pilot study. Paediatricians should have been involved in the selection of families to facilitate an appropriate measurement of anthropometric and socio-demographic data and assessment of the health of children and families, and to partake in the quality control of data collection in the diaries. We did not collect data on the intake of vitamin supplements or other micronutrients, so the deficiencies we saw in vitamin D and folate intakes may have been overestimated. We chose to use the DRI of the United States population as opposed to the European recommendations because they are the most widely used reference values in paediatric studies and because the reference values in European countries are still being established.38–40 However, it will be possible to compare the results of this study with other reference values in the future using the data presented in Table 2 of this publication.
The study included a pilot sample of children ages 0–36 months, an age group that has not been studied often, and contributes relevant information to estimate the actual nutrient intakes at these ages. The imbalance of the diet was noteworthy, especially from 6 months of age, with an excessive protein intake and an insufficient intake of vitamin D and folate. The high daily protein intake levels we observed and their potential relationship with obesity in subsequent ages warrant the performance of studies with representative samples in order to confirm these findings. It would be good to do prospective follow-up studies to assess whether the dietary habits observed in these children were maintained or changed in subsequent ages.
FundingEvery phase of this study has been funded by Danone Nutricia Early Life Nutrition (Almiron).
Conflict of interestThe authors have no conflict of interest to declare.
Please cite this article as: Dalmau J, Moráis A, Martínez V, Peña-Quintanad L, Vareae V, Martínezf MJ, et al. Evaluación de la alimentación y consumo de nutrientes en menores de 3 años. Estudio piloto ALSALMA. An Pediatr (Barc). 2014;81:22–31.
Previous presentations: Congreso Nacional de Pediatría, 2012: Presentation during congress, Science Day, June 21, 2012.

Anales de Pediatría (English Edition) follows the Recommendations for the Conduct, Reporting, Editing and Publication of Scholarly Work in Medical Journals