


Epidemiology is a fundamental discipline in medical research, as it examines the distribution and determinants of diseases within populations. To achieve this, it employs various research designs, which are broadly classified into observational and experimental studies. Observational studies include descriptive studies, such as case series and cross-sectional studies, as well as analytical studies, such as cohort and case-control studies, which assess associations between exposures and health outcomes. Experimental studies, particularly randomized controlled trials, establish causal relationships. The choice of study design depends on the research question, feasibility and available resources.
It is essential to understand their characteristics, the contexts in which they should be applied and the most common sources of bias to ensure the accurate interpretation of results.
La epidemiología es una disciplina clave en la investigación médica, ya que estudia la distribución y los determinantes de las enfermedades en las poblaciones. Para ello, emplea distintos diseños metodológicos, que se dividen en observacionales y experimentales. Los estudios observacionales incluyen los descriptivos, como series de casos y estudios transversales, y los analíticos, como los de cohortes y casos y controles, que evalúan asociaciones entre exposiciones y salud. Los estudios experimentales, como los ensayos clínicos aleatorizados, establecen relaciones de causalidad. La elección del diseño depende de la pregunta de investigación, la factibilidad y los recursos disponibles.
Es conveniente conocer sus características, las situaciones en que se deben aplicar y los sesgos más frecuentes, para la interpretación correcta de los resultados obtenidos.
Epidemiology is a fundamental discipline in medical research, as it helps elucidate the distribution and determinants of diseases in populations. In pursuit of this goal, different methodological designs have been developed to facilitate data collection, analysis and interpretation, each with its own advantages, limitations and specific applications.
Epidemiological study designs can be classified into two broad groups: observational studies and experimental studies. The former include descriptive studies, such as case series and cross-sectional studies, which provide information on the frequency and distribution of a disease in a population. They also include analytical studies, such as cohort studies and case-control studies, which allow for the evaluation of possible associations between exposure variables and health effects. Finally, experimental studies, particularly randomized controlled trials, are the most robust tool for establishing causal relationships through direct intervention in the exposure of participants (Table 1).1–3
Classification of epidemiological study designs.
| Based on purpose | |||
|---|---|---|---|
| Classification | General characteristics | Types of study | Comments |
| Descriptive studies: study the frequency and distribution of health and disease phenomena. | They answer the questions: What? When? How many? How? Where? | Ecological (aggregate data) | Frequently used in public health research, health depend on the existence of registers |
| They provide data on absolute and relative frequencies, incidence, prevalence, mortality, etc. | |||
| Case report and case series | They can be useful for developing new hypotheses | ||
| Longitudinal case series provide evidence on the natural history of a disease | |||
| Cross-sectional | Also known as prevalence studies | ||
| These include studies that evaluate diagnostic tests and those that assess agreement between techniques and observers. | |||
| Analytical studies: they assess hypothesized cause-effect relationships | They answer the question: Why? | Observational (cohort studies and case-control studies) | Their objective is to test hypotheses. They are classified according to the researcher’s stance toward the factor that is evaluated in observations or interventions. |
| Interventional or experimental | |||
| Based on level/unit of analysis | |||
|---|---|---|---|
| Classification | General characteristics | Types of study | Comments |
| Individual | Disaggregated data for each subjects | Any study design except those applicable only to populations | Data presented for each participant. |
| Population | Aggregate data from groups of individuals (schools, districts, families, etc) | Ecological studies | They can be descriptive or interventional |
| Community-based studies | |||
| Based on directionality (order in which exposure/cause and outcome/effect are investigated) | |||
|---|---|---|---|
| Classification | General characteristics | Types of study | Comments |
| Forward | Inquiry from exposure/cause to outcome/effect | Cohort study, interventional study | Only forward-directed studies can establish the temporal association between exposure/cause and outcome/effect, which is one of the criteria for establishing causality |
| Backward | Inquiry from outcome/effect to exposure/cause | Case-control study | |
| Nondirectional | Exposure/cause and outcome/effect evaluated at the same time | Case series | |
| Cross-sectional study | |||
| Based on sample selection | |||
|---|---|---|---|
| Classification | General characteristics | Types of study | Comments |
| Random sampling | Selection with the aim of obtaining a sample that is representative of the target population | Descriptive prevalence studies | The measure of frequency is the prevalence |
| Convenience sampling | Selection of individuals who exhibit the outcome/effect or are exposed to a rare factor, or a combination of both | Analytical studies that analyze causal hypotheses | Useful to study exposures or effects that are infrequent or that the researcher wants to control. |
| Based on timing (timing of the study relative to when the analyzed events took place) | |||
|---|---|---|---|
| Classification | General characteristics | Types of study | Comment |
| Historical or retrospective | The exposure and the outcome have already occurred when the study starts | Retrospective cohort study | Data obtained from existing records, so the quality of the records must be taken into account |
| Case-control study with prevalent cases | Less expensive and quicker | ||
| Concurrent or prospective | Records events that occur after the start of the study | Clinical trials | More costly and difficult to carry out, susceptible to changing circumstances and loss of participants. |
| Prospective cohorts | |||
| Case-control study with incident cases | |||
| Hybrid | Usually, the exposure is historical and the outcome occurs during the follow-up | Mixed studies | |
| Based on the allocation to the exposure under study | |||
|---|---|---|---|
| Classification | General characteristics | Types of study | Comments |
| Non-experimental or observational studies: the exposure/factor has occurred for a reason unrelated to the research | Descriptive, single group, nondirectional | Case report and case series | They can be useful for generating new hypotheses |
| Longitudinal series allow observation of the natural history of a disease | |||
| Descriptive study, single group, which may be further subdivided, nondirectional, population-level | Ecological study | In ecological studies, variable assessment, analysis, and inference must all be done at the same level. | |
| Descriptive study with aggregated data | |||
| Descriptive or analytical, single group, usually with subdivisions, retrospective | Cross-sectional study | Particularly suitable for chronic diseases, they yield prevalence measures, quick and inexpensive | |
| They allow simultaneous analysis of several effects/outcomes | |||
| They cannot establish causal relationships | |||
| Not useful for rare diseases | |||
| Analytical study, with comparison group, backward | Case-control study | Useful for rare diseases or those with a long latency period | |
| Allows analysis of multiple exposures | |||
| Cannot be used to obtain incidence rates | |||
| Analytical study, single group (single cohort) or with comparison group, forward | Cohort study | Useful for rare exposures | |
| Allow for the study of one exposure and several effects | |||
| Concurrent cohort studies minimize bias in exposure measurement | |||
| Can be used to obtain incidence rates | |||
| Other observational studies | Incomplete designs | Ecological correlational study | Study of cause-effect associations, but due to the intrinsic limitations of their design, they are considered exploratory |
| Proportional morbidity or mortality study | |||
| Time-space cluster studies | |||
| Hybrid designs | Cohort and case-control study | Sampling of controls from the cohort at the start of the study | |
| The measure of association is the odds ratio | |||
| Nested case-control study | Incidence density sampling of controls | ||
| The measure of association is the odds ratio | |||
| Experimental studies: the researcher controls the allocation to the exposure of interest. | Experimental, with comparison group, prospective, individual | Randomized controlled trial | Can establish the temporal sequence in the cause-effect association |
| Greater control over exposure, confounding factors and certain biases | |||
| Can be used to study a single intervention. | |||
| Experimental, with comparison group, prospective, population-level | Field study | They evaluate primary prevention measures in large groups of individuals | |
| Community trial | |||
| Experimental without random allocation | Quasi-experimental study | Studies without controls or randomization of the intervention | |
| Very susceptible to bias | |||
| Require cautious interpretation | |||
The selection of the most appropriate design depends on multiple factors, such as the research question, the feasibility of the study and the available resources. This article analyzes the characteristics, applications and limitations of the main epidemiological designs with the aim of providing guidance for their selection and correct implementation in research practice.
Observational studiesObservational studies are those in which researchers act as mere observers, without exerting any influence on exposure. They are divided into descriptive and analytical studies. Descriptive studies provide data collected from a sample of a population, and they include case series and cross-sectional studies. Analytical studies, which have a comparison group, include cohort studies and case-control studies.4
Case seriesA case series describes a group of subjects who have the same characteristic or disease.
They can be used to formulate hypotheses and to explore the possibility of performing analytical or experimental studies, but not to assess for a statistical association.
Cross-sectional studiesCross-sectional studies are non-directional: all measurements are taken at approximately the same time, and there is no follow-up. They are used to estimate the frequency of a disease or characteristic in a sample of a population at a given time, which is why they are also known as prevalence studies.5
They are useful for generating hypotheses that need to be tested at a later stage with more complex studies.
This type of study can provide evidence of association but cannot determine causality.
Cohort studiesA cohort is a group of subjects who share a common characteristic, usually exposure to the factor under study.
The cohort is observed over time, and compared with another cohort of unexposed subjects, until participants develop the outcome of interest, are lost to follow-up or the study ends.
They can be prospective or retrospective. In prospective cohort studies, the two groups (exposed and unexposed) are formed before the development of the outcome or disease of interest. In retrospective cohort studies, the exposure and outcome have both taken place by the time the study starts. Less frequently, cohort studies can be hybrid (ambispective, with collection of both retrospective and prospective data from the same cohort).6
They can be classified according to whether they use an internal or external comparison group and also depending on when subjects can be included in the study, giving rise to closed cohorts, fixed from the start, or open or dynamic cohorts in which subjects continue to be included throughout the follow-up.
Cohort studies can answer clinical questions regarding prognosis and outcomes in situations in which it would be ethically unacceptable to conduct a clinical trial. They can also be used to formulate causal hypotheses as a preliminary step for clinical trials.
In general, cohort studies are less susceptible to bias than other observational studies and allow assessment of the effect of a single exposure factor on more than one disease.
Case-control studiesIt starts with two subsets of the population groups, differentiated according to the presence (cases) or absence (controls) of the outcome or disease under study, and the exposure to a specific factor is assessed in both with the aim of finding an association between outcome and exposure.7,8
Controls should be representative of the level of exposure to the risk factor under study and of the population from which the cases were selected.
Case-control studies are more susceptible to bias than cohort studies.
This study design is particularly useful for studying rare diseases or diseases with a very long latency period. They are not as costly as cohort studies, allow for the study of a larger number of subjects with the disease, and, unlike cohort studies, can evaluate several risk factors at the same time.
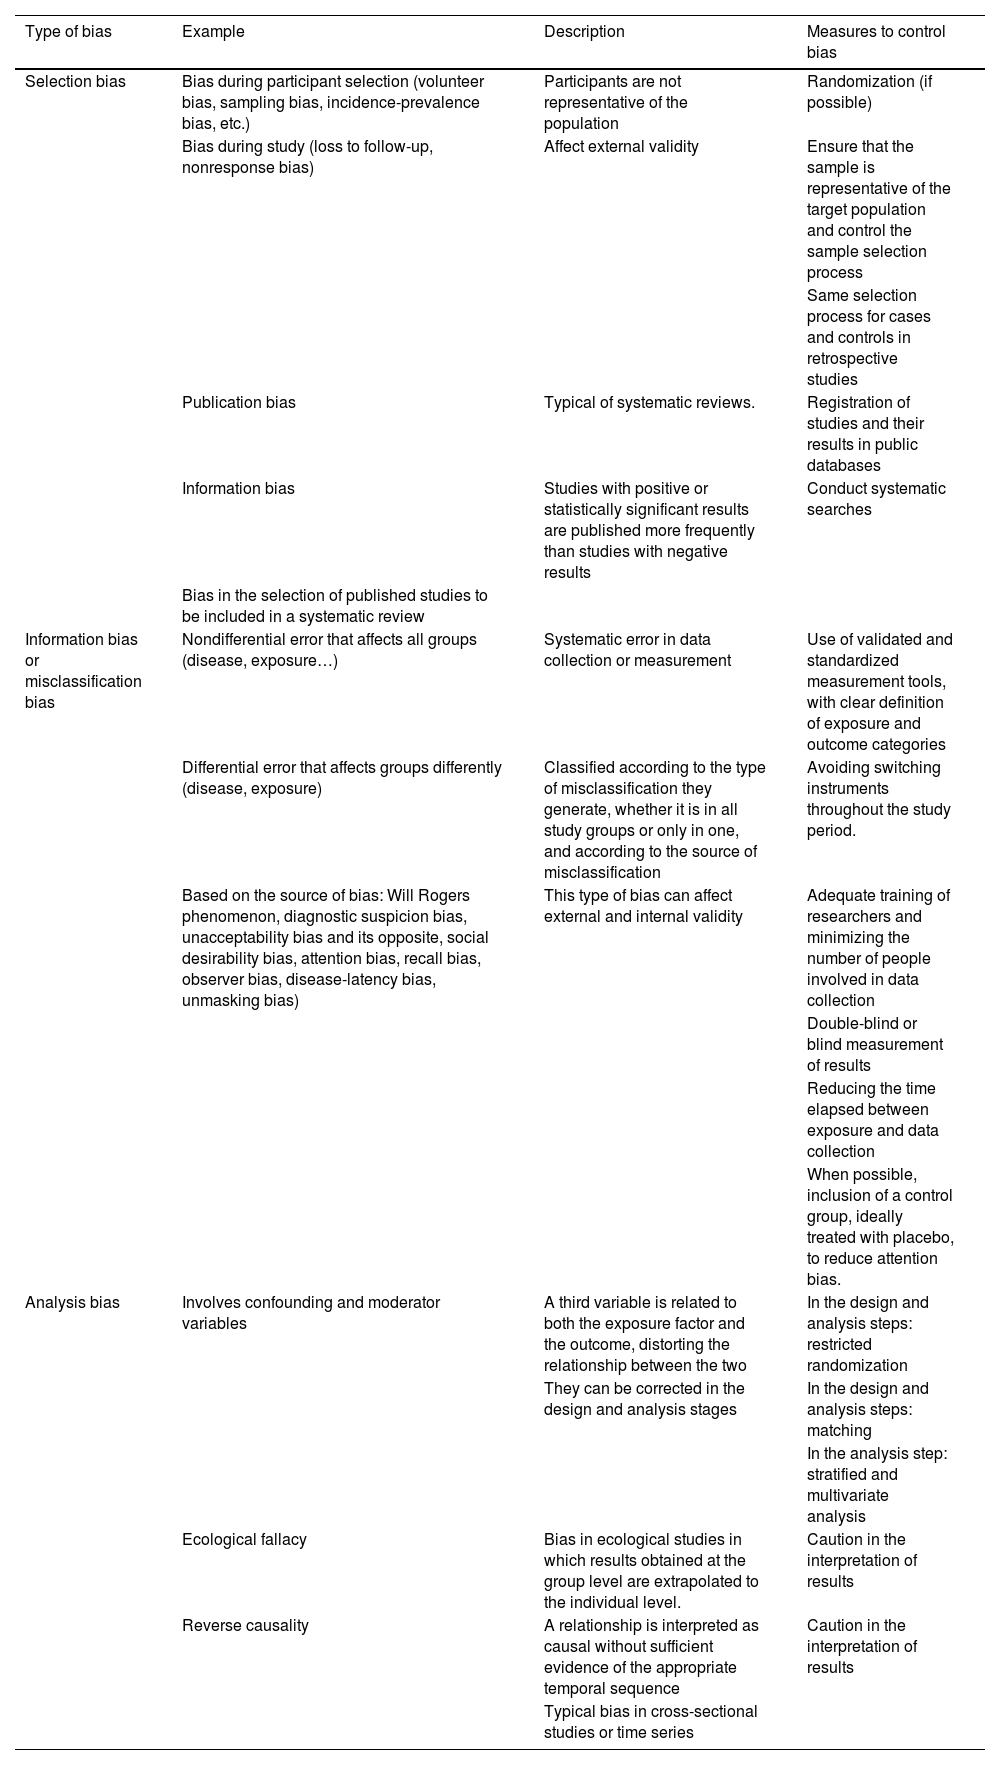
There are several biases that are common to all observational studies, presented in Table 2.
Potential sources of bias to consider in observational studies, clinical trials and systematic reviews.
| Type of bias | Example | Description | Measures to control bias |
|---|---|---|---|
| Selection bias | Bias during participant selection (volunteer bias, sampling bias, incidence-prevalence bias, etc.) | Participants are not representative of the population | Randomization (if possible) |
| Bias during study (loss to follow-up, nonresponse bias) | Affect external validity | Ensure that the sample is representative of the target population and control the sample selection process | |
| Same selection process for cases and controls in retrospective studies | |||
| Publication bias | Typical of systematic reviews. | Registration of studies and their results in public databases | |
| Information bias | Studies with positive or statistically significant results are published more frequently than studies with negative results | Conduct systematic searches | |
| Bias in the selection of published studies to be included in a systematic review | |||
| Information bias or misclassification bias | Nondifferential error that affects all groups (disease, exposure…) | Systematic error in data collection or measurement | Use of validated and standardized measurement tools, with clear definition of exposure and outcome categories |
| Differential error that affects groups differently (disease, exposure) | Classified according to the type of misclassification they generate, whether it is in all study groups or only in one, and according to the source of misclassification | Avoiding switching instruments throughout the study period. | |
| Based on the source of bias: Will Rogers phenomenon, diagnostic suspicion bias, unacceptability bias and its opposite, social desirability bias, attention bias, recall bias, observer bias, disease-latency bias, unmasking bias) | This type of bias can affect external and internal validity | Adequate training of researchers and minimizing the number of people involved in data collection | |
| Double-blind or blind measurement of results | |||
| Reducing the time elapsed between exposure and data collection | |||
| When possible, inclusion of a control group, ideally treated with placebo, to reduce attention bias. | |||
| Analysis bias | Involves confounding and moderator variables | A third variable is related to both the exposure factor and the outcome, distorting the relationship between the two | In the design and analysis steps: restricted randomization |
| They can be corrected in the design and analysis stages | In the design and analysis steps: matching | ||
| In the analysis step: stratified and multivariate analysis | |||
| Ecological fallacy | Bias in ecological studies in which results obtained at the group level are extrapolated to the individual level. | Caution in the interpretation of results | |
| Reverse causality | A relationship is interpreted as causal without sufficient evidence of the appropriate temporal sequence | Caution in the interpretation of results | |
| Typical bias in cross-sectional studies or time series |
Randomized controlled trials (RCTs) are the prototype of experimental design and their ultimate goal is to evaluate the effects of an intervention in order to establish causality, which cannot be established through observational studies. Fig. 1 summarizes the design of an RCT.

They are forward-directed and prospective.
Six key aspects need to be taken into account to guarantee the internal validity of a RCT9:
- -
Initial clinical question.10 All RCTs must seek to answer a structured clinical question that defines the population, intervention, comparison and outcome.
- -
Randomization. Participants must be assigned to one of the groups (intervention or control) so that all subjects have the same chance of being assigned to either group.
- -
Random allocation sequence. It must be concealed so that it cannot interfere with results due to conscious or unconscious behavior of researchers or participants.
- -
Masking. The compared interventions must be masked so that neither the participants nor the researchers know what each study subject is receiving (blinding). This reduces information bias and interference in the interpretation of results.
- -
Follow-up. This should be equal and completed by all groups, avoiding excessive losses.
- -
Analysis of results.11 Whenever possible, subjects should be analyzed according to the group to which they were initially assigned (intention-to-treat analysis) as opposed to the group in which they eventually participated (per-protocol analysis), as the benefits of randomization are lost otherwise.
In RCTs, the strict control exerted in the study design yields data of the highest quality, but it also reduces external validity by limiting the generalizability of the results to real-world settings.
Quasi-experimental studies are controlled trials in which random allocation is not possible. This includes the following circumstances: natural experiments (the intervention occurs naturally or circumstantially), studies with historical controls (the intervention group is compared with another group that was treated with a similar intervention in the past), post-intervention studies (the observation is made after the intervention measure has been carried out), and pre-post studies (certain variables are measured before and after a specific intervention). These studies are simpler and more economical, but they are susceptible to selection bias and confounding, which compromise their external validity and the applicability of their findings, as well as the placebo effect and the Hawthorne effect (improvement occurs simply due to the awareness of being observed).
There are different designs within the RCT category:
- -
Factorial trial.12 Evaluation of more than one intervention in a single trial (always with independent mechanisms of action and effects).
- -
Cross-over trial.13 Participants receive the same two or more treatments in a different order (with a “rest” period in between).
- -
Sequential trial.14 The sample size is not fixed in advance. Subjects are included until a significant difference is detected, establishing the follow-up period and conducting interim analyses.
- -
Pragmatic trial.15 Carried out under conditions similar to those of clinical practice. Used to assess the overall effect of an intervention in the real world.
- -
Non-inferiority study.16 The purpose is to demonstrate that a new treatment is not inferior to the standard of care.
In RCTs, potential biases that may confound the interpretation of the results need to be taken into account (Table 2).
Systematic review and meta-analysisSystematic reviews, by combining multiple studies, seek to obtain answers that cannot be provided by individual studies in order to draw firm conclusions about a specific health problem.17
The steps in performing a systematic review are18: framing a research question, searching for and selecting studies, evaluating the quality of the evidence and risk of bias of selected studies, extracting and analyzing the data and presenting the results. The last step can be qualitative or quantitative (meta-analysis).
In framing the research question, it is very important to structure the question adequately following the PICO framework (population or problem, intervention, comparison and outcome). The search strategy should ensure that all relevant and important publications are reviewed and should be described in detail. The selection of studies that will ultimately be included should also be detailed.
To assess the quality of the evidence, a risk of bias evaluation must be performed for each study using validated tools, and the tools used for the purpose reported. This analysis is very important because lower-quality studies yield weaker evidence.
A systematic approach must be applied to the retrieval of data from selected studies and described in the report, as it may have a significant impact on the final conclusions.
When the quality and consistency of the studies allow it, the results of a systematic review can be supplemented with a meta-analysis. The meta-analysis is a set of statistical procedures whose objective is to provide a quantitative summary of the results of a systematic review, obtaining an overall measure of the effect under consideration.
Combining the results of several individual studies yields a larger sample size, which increases the accuracy of the estimate and the power of the review, allowing the detection of differences that went unnoticed in individual studies and drawing of conclusions when the results of individual studies are contradictory, in addition to increasing the generalizability of the findings.
To carry out a meta-analysis, researchers must obtain all the available information. While obtaining exhaustive information is a key objective, it is important to remember that this is not always achieved (Table 2) due to either flaws in the search or selection of sources (information bias) or the selective publication of some findings while leaving other results unpublished (publication bias).19 Researchers also need to assess whether the primary studies are sufficiently homogeneous to be “mixed” in a statistical synthesis (analysis of heterogeneity), select the most appropriate mathematical method to combine the results20 and present and interpret the results of the synthesis correctly, frequently displayed graphically as forest plots (Fig. 2).
.")
The forest plot shows which variables are compared and helps identify the outcome effect measure. A diamond shape in the diagram illustrates, through its position and width, the overall result of the meta-analysis.21 The heterogeneity of the included studies can be assessed at a glance by noting the degree of dispersion or overlap of the boxes representing the primary studies, although ideally a quantitative assessment of heterogeneity with appropriate measures, such as the Cochran Q or the I2, is also performed. Another aspect to consider is where the overall effect diamond and its confidence interval are located in relation to the line of no effect. As long as they do not cross this line, the result is statistically significant, although this does not mean that it is clinically significant, an aspect that is determined based on the relevance of the variable itself.
All of the above refers to meta-analyses of clinical trials, which is the type most frequently encountered in the literature, although there are other types of meta-analysis, such as diagnostic test accuracy or network meta-analyses, which have some differential characteristics.
DiagnosticA diagnostic test (DT) is any procedure that can provide information to guide clinical decision-making. The capacity of a test to provide a correct diagnosis is determined by assessing its validity and reliability.1,22,23
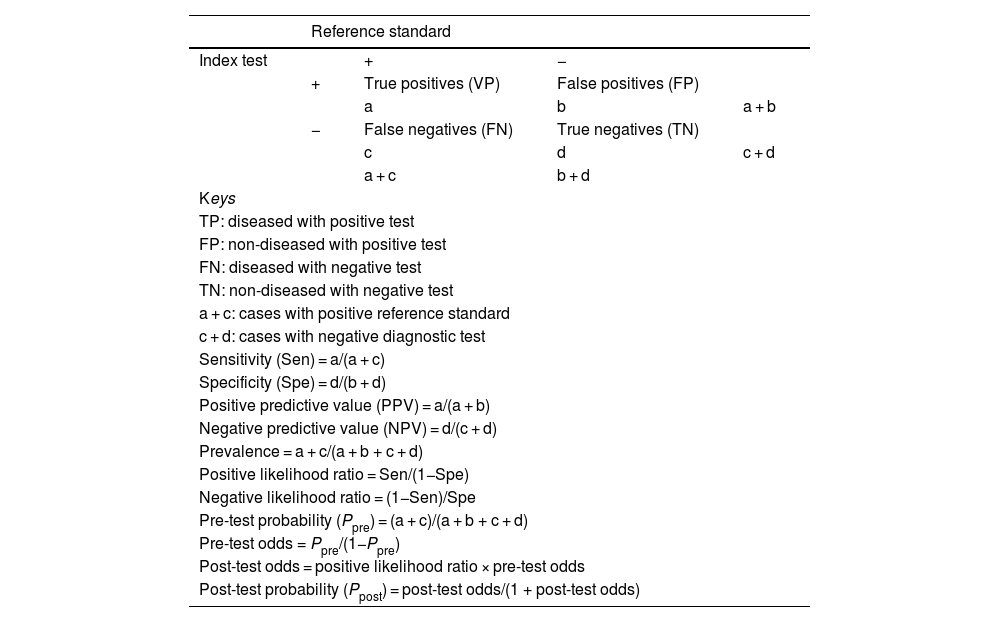
Validity refers to the extent to which a DT measures what it is intended to measure and corresponds to diagnostic accuracy. It is assessed by comparing the results obtained with the test to those obtained with a reference standard (RS), yielding the main indicators of validity (Table 3): sensitivity (Sen), specificity (Spe), likelihood ratios (LRs) or predictive values. In the case of DTs for which different cut-off points can be applied in interpreting the results, these are expressed in the form of a ROC curve (diagnostic performance curve) that reflects the Sen and Spe obtained with different cut-off points as well as the overall performance of the test. The validity of DTs is determined through studies conducted on population samples, so these estimates are subject to random variability (they should be reported with confidence intervals) and susceptible to bias if the methodological design is flawed (Table 4).24
Indicators of validity for diagnostic tests.
| Reference standard | ||||
|---|---|---|---|---|
| Index test | + | − | ||
| + | True positives (VP) | False positives (FP) | ||
| a | b | a + b | ||
| − | False negatives (FN) | True negatives (TN) | ||
| c | d | c + d | ||
| a + c | b + d | |||
| Keys | ||||
| TP: diseased with positive test | ||||
| FP: non-diseased with positive test | ||||
| FN: diseased with negative test | ||||
| TN: non-diseased with negative test | ||||
| a + c: cases with positive reference standard | ||||
| c + d: cases with negative diagnostic test | ||||
| Sensitivity (Sen) = a/(a + c) | ||||
| Specificity (Spe) = d/(b + d) | ||||
| Positive predictive value (PPV) = a/(a + b) | ||||
| Negative predictive value (NPV) = d/(c + d) | ||||
| Prevalence = a + c/(a + b + c + d) | ||||
| Positive likelihood ratio = Sen/(1−Spe) | ||||
| Negative likelihood ratio = (1−Sen)/Spe | ||||
| Pre-test probability (Ppre) = (a + c)/(a + b + c + d) | ||||
| Pre-test odds = Ppre/(1−Ppre) | ||||
| Post-test odds = positive likelihood ratio × pre-test odds | ||||
| Post-test probability (Ppost) = post-test odds/(1 + post-test odds) | ||||
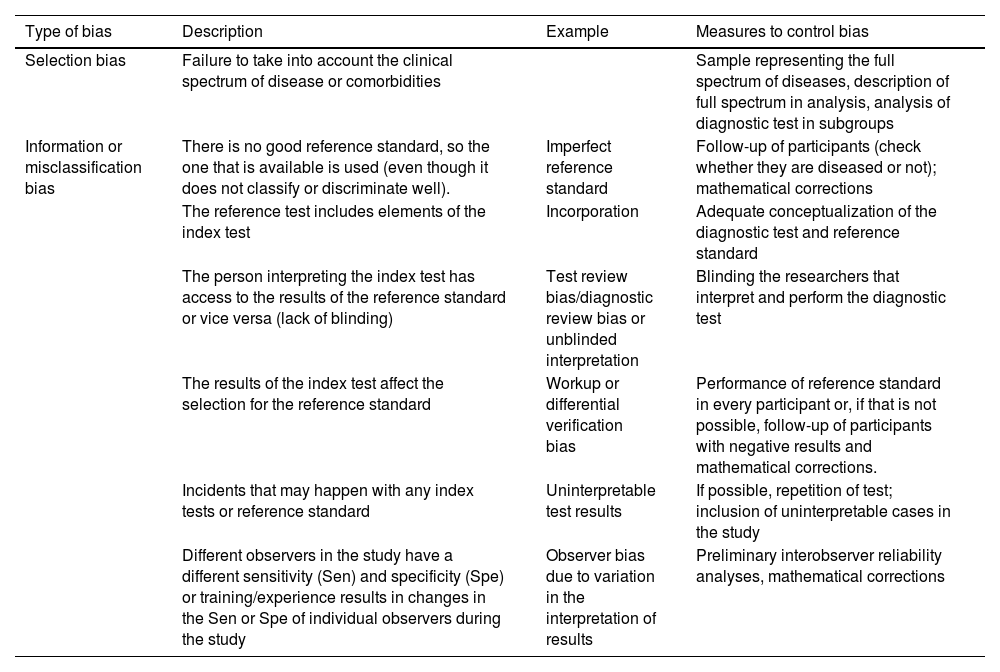
Potential sources of bias in diagnostic test accuracy studies.
| Type of bias | Description | Example | Measures to control bias |
|---|---|---|---|
| Selection bias | Failure to take into account the clinical spectrum of disease or comorbidities | Sample representing the full spectrum of diseases, description of full spectrum in analysis, analysis of diagnostic test in subgroups | |
| Information or misclassification bias | There is no good reference standard, so the one that is available is used (even though it does not classify or discriminate well). | Imperfect reference standard | Follow-up of participants (check whether they are diseased or not); mathematical corrections |
| The reference test includes elements of the index test | Incorporation | Adequate conceptualization of the diagnostic test and reference standard | |
| The person interpreting the index test has access to the results of the reference standard or vice versa (lack of blinding) | Test review bias/diagnostic review bias or unblinded interpretation | Blinding the researchers that interpret and perform the diagnostic test | |
| The results of the index test affect the selection for the reference standard | Workup or differential verification bias | Performance of reference standard in every participant or, if that is not possible, follow-up of participants with negative results and mathematical corrections. | |
| Incidents that may happen with any index tests or reference standard | Uninterpretable test results | If possible, repetition of test; inclusion of uninterpretable cases in the study | |
| Different observers in the study have a different sensitivity (Sen) and specificity (Spe) or training/experience results in changes in the Sen or Spe of individual observers during the study | Observer bias due to variation in the interpretation of results | Preliminary interobserver reliability analyses, mathematical corrections |
Reliability refers to the capacity of a DT to produce comparable results when used under identical conditions. The variability of the measurements is affected by multiple factors that should be known and controlled. Reliability can be assessed, depending on the nature of the variable measured by the DT, using the Kappa coefficient, the weighted Kappa coefficient or the intraclass correlation coefficient (for tests with qualitative results) and Bland-Altman analysis (for tests with quantitative results).
Diagnostic tests accuracy can be assessed with any type of epidemiological study design. There is considerable heterogeneity in the design of DT accuracy studies, which hinders the interpretation and application of their results. The aspects that need to be assessed when analyzing diagnostic accuracy studies are:
- -
Timing of data collection: depending on the time that the DT and RS are received, they can be simultaneous (both at the same time), prospective (DT first) and retrospective (in patients already diagnosed by means of the RS).
- -
Single or multiple sets of candidate eligibility criteria.
- -
Participant sampling method (consecutive, random, convenience/availability, etc).
- -
Blinding in performance/interpretation of DT.
- -
Number of compared reference standards.
- -
Limited verification design (yes/no).
Based on these aspects, DT accuracy studies could be categorized as follows25:
- -
Fully paired design: each participant receives all DTs. Offers the greatest statistical power.
- -
Partially paired design with random or nonrandom subset: some participants receive multiple DTs but others receive only one of the DTs. Higher risk of bias. An attractive option when a DT is expensive, invasive…
- -
Unpaired randomized design: researchers assign each participant to a DT or RS.
- -
Unpaired nonrandomized design: extremely high risk of bias.
The Standard for Reporting of Diagnostic Accuracy (STARD) statement26,27 contains a checklist of items that should be reported in any diagnostic accuracy study. There are also tools designed to assess the quality of diagnostic accuracy studies to be included in systematic reviews, such as the Quality Assessment of Diagnostic Accuracy Studies (QUADAS-2).28,29
Choosing an epidemiological study designHaving discussed the different possible designs for epidemiological studies, we now broach the subject of selecting the most suitable design for a specific research project. In addition to the research question and the objectives of the study, the choice will depend on several other factors, such as the possibility of controlling the intervention of interest, the need to compare different groups and the sampling criteria used to select participants.
When the objective is to assess the effect of an exposure on a specific outcome, the most appropriate approach is to introduce the exposure in a controlled manner. In this case, interventional study designs are most appropriate, among which the randomized controlled trial is the highest standard, as it can be used to establish the causal relationship between exposure and effect. However, in situations where it is not possible to randomize allocation or have a control group, uncontrolled trials or quasi-experimental studies are suitable options.
If researchers cannot control the intervention due to ethical or practical limitations, an observational design is the alternative, in which researchers simply collect data but do not modify the exposure of participants. Within the subset of observational designs, if comparison between groups is not required, the appropriate choice is a descriptive study. A characteristic example is the use of a cross-sectional design, in which a sample is analyzed at a given point in time and who has the advantages of being simple and inexpensive. However, these studies have the drawback that they cannot establish causality. There are other types of descriptive studies, such as case series and case reports, with a lower quality of evidence.
On the other hand, if groups are being compared, the appropriate design is an observational analytical study, which allows the assessment of associations between variables. In this case, the way in which participants are selected determines the type of study to be conducted. If participants are selected based on their exposure to a given factor, a cohort study is conducted, which allows assessment of outcomes over time and yields evidence of greater quality. However, if participants are selected based on the presence or absence of an outcome, such as a disease, a case-control study is performed, a design that is more efficient when the outcome is infrequent, although it is more susceptible to biases than the cohort study.
Another aspect to take into account is the unit of analysis. Research is usually conducted at the level of individual subjects, but, in some instances, there is an interest in analyzing population groups. In the latter case, ecological studies are an option if what is intended is a descriptive analysis, and community trials if the research is interventional in nature.
In conclusion, the selection of the methodological design should be based on the possibility of intervention, the need to compare groups and the sampling criteria (Fig. 3). Randomized controlled trials offer the highest quality of evidence, followed by cohort studies and case-control studies. On the other hand, descriptive studies, while useful for certain purposes, yield less robust evidence.
Funding
This research did not receive any external funding.
The authors have no conflicts of interest to declare.
Pilar Airzpurua Galdeano, M. Salomé Albi Rodríguez, María Aparicio Rodrigo, Nieves Balado Insunza, Albert Balaguer Santamaría, Laura Cabrera Morente, Fernando Carvajal Encina, Jaime Cuervo Valdés, Eduardo Cuestas Montañés, Garazi Fraile Astorga, Álvaro Gimeno Díaz de Atauri, Javier González de Dios, Paz González Rodríguez, Rafael Martín Masot, Carlos Ochoa Sangrador, Eduardo Ortega Páez, Elena Pérez González, M. José Rivero Martín, y Juan Ruiz-Canela Cáceres.
