


Postnatal growth restriction is considered a universal problem in extremely premature infants (EPI), and causes great concern due to the possible relationship between nutrition, sub-optimal postnatal growth, and neurodevelopment delay.
ObjectivesTo describe the weight gain in EPI and to determine the changes in the length and head circumference (HC) at hospital discharge in survivors.
Patients and methodsThe study included 4520 Caucasian EPI from single pregnancies and without severe malformations, born in the centres participating in the Spanish SEN1500 network (2002–2011). The weight was recorded at birth, 28 days, 36 weeks post-menstrual age (PMA), and at discharge. The length and HC were measured at birth and at discharge.
ResultsThe rate of weight gain (exponential method) was 8.0g/kg/day (birth to 28 days); 14.3g/kg/day (28 days to 36 weeks); and 11.7g/kg/day (36 weeks to discharge). At discharge, postnatal growth restriction was greater for length (z-score between −1.78 and −2.42, depending on GA), followed by weight (−1.67 to −1.79), and HC (−0.69 to −0.81).
ConclusionsWeight gain in the first weeks after birth is slow in EPI, and they exhibit an almost universal postnatal growth restriction that involves mainly length and weight. In addition to weight, a close control of longitudinal growth and HC are essential for nutritional assessment and detection of patients at risk for poor growth and neurodevelopment after hospital discharge.
La restricción posnatal del crecimiento es considerada un problema universal en recién nacidos extremadamente prematuros (RNEP), generando gran preocupación debido a la posible relación entre nutrición, crecimiento posnatal subóptimo y alteraciones del neurodesarrollo.
ObjetivosDescribir la evolución de la ganancia posnatal de peso en RNEP y conocer los cambios en la longitud y el perímetro craneal (PC) al alta hospitalaria en los supervivientes.
Pacientes y métodosSe estudió a 4.520 RNEP de raza blanca, de gestaciones únicas y sin malformaciones, nacidos en los centros participantes en la red española SEN1500 (2002-2011). El peso se registró al nacimiento, 28 días, 36 semanas de edad posmenstrual y al alta hospitalaria. La longitud y el PC se estudiaron al nacimiento y al alta.
ResultadosLa velocidad de ganancia ponderal fue de 8,0g/kg/día (nacimiento-28 días); 14,3g/kg/día (28 días-36 semanas), y 11,7g/kg/día (36 semanas-alta hospitalaria). Al alta, la restricción posnatal del crecimiento fue mayor para la longitud (z-score entre −1,78 y −2,42, en función de la edad gestacional), seguida del peso (−1,67 a −1,79) y, finalmente, el PC (−0,69 a −0,81).
ConclusionesLos RNEP presentan una velocidad de ganancia ponderal lenta en las primeras semanas tras el nacimiento y una restricción posnatal del crecimiento que afecta en mayor grado a la longitud y al peso. Además del peso, un control estrecho del crecimiento longitudinal y del PC es fundamental para la valoración nutricional y la detección de pacientes de riesgo respecto al crecimiento y el neurodesarrollo tras el alta hospitalaria.
Postnatal growth restriction has been noted as a universal problem in very low birth weight (VLBW) preterm infants, independently of the level of care or intensity of the facility where the infant is born.1,2 Growth during childhood is customarily assessed through comparison to tables of percentiles for different anthropometric values obtained from the study of large samples of the population. In the case of preterm infants, growth curves have usually been developed using cross-sectional anthropometric birth data from newborns of different gestational ages (GAs).3 The Committee on Nutrition of the American Academy of Pediatrics proposed that the optimal care and nutrition of preterm infants after birth would be those allowing them to achieve a postnatal growth that approximates the intrauterine growth—in terms of anthropometric measurements and body composition—of a normal foetus of the same postmenstrual age.4 However, this outcome is rarely observed in everyday clinical practice, raising considerable concern among health professionals as regards the quality of the care and nutrition provided to these patients.5,6 This concern mostly involves the potential relationship between nutrition, suboptimal postnatal growth and motor and/or cognitive impairment in subsequent stages of life.7–10 Embleton et al. remarked on the inevitability of postnatal growth retardation in preterm infants due to the time it takes to achieve recommended dietary intakes, as well as the difficulty in recovering from the additional nutritional deficits accrued during this time, which are more pronounced in more immature and sicker infants.11
In Spain, Krauel Vidal et al.12 studied the weight, length and head circumference (HC) at birth and at discharge in a cohort of VLBW infants born at 32 or fewer weeks’ gestation in any of 55 Spanish neonatal units between 2002 and 2003. The main finding of this study was postnatal growth restriction, evinced by a decreased z-score in the 3 parameters under study. Growth restriction was most pronounced in length, followed by weight, which was below the 10th percentile at the time of discharge in 77% of the infants. Another study recently conducted in Spain that included 5470 infants delivered at 22–26 weeks’ gestation13 compared the outcomes of two different periods (2002–2006 vs 2007–2011). In addition to increases in survival and survival without major morbidity, the study found a significant increase in birth weight in the second period (758.9±160.7 vs 773.8±158.6g; P<.001), as well as in the weight of survivors at 28 days (991±209 vs 1029±211g; P<.001) and 36 weeks of postmenstrual age (PMA) (1890±365 vs 1967±377g; P<.001). These data suggest that there may have been improvement in antenatal care as well as in neonatal care, in general and in the nutritional practices following admission to neonatal units. However, the postnatal growth pattern of extremely preterm infants (EPIs) has not been analysed again in this more recent period of time. The objectives of our study were to: (1) describe postnatal weight gain outcomes relative to PMA in a contemporary cohort of Spanish newborns delivered at 28 or fewer weeks’ gestation during their initial hospital stay, and (2) to assess the changes in length and HC between birth and hospital discharge in survivors.
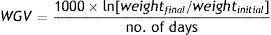
Patients and methodsWe studied a cohort of 4522 newborns, all Caucasian, product of singleton pregnancies and without malformations delivered at 28 or fewer weeks’ gestation between 2002 and 2011 in the participating hospitals of the Spanish SEN1500 database.14 Their weight, length and HC have already been analysed and were used to develop new intrauterine growth charts for Spanish EPIs.15 Our study analysed postnatal weight gain relative to PMA based on weight measurements taken at 4 significant time points: birth, 28 days of chronological day, 36 weeks’ PMA and discharge. To assess growth, we calculated the z-scores using as reference the mean values in children of both sexes for each GA in the tables of Olsen et al.,3 which are the tables that best approximate the Spanish population values between 23 and 28 weeks’ GA and have values up to 41 weeks. We calculated the z-score as: (patient weight, length or HC−mean weight, length or HC in reference curve for the same GA)/standard deviation of the reference for the same GA. We examined weight gain in three periods: from birth to 28 days, from 28 days to 36 weeks’ PMA and from 36 weeks’ PMA to discharge from hospital. To calculate the weight gain velocity (WGV, in g/kg/day) we used the exponential method, which has proven more accurate in estimating actual WGV than 2-point methods and linear regression models normalised for either birth weight or average weight,16 and, unlike them, is not affected by low birth weight or hospital length of stay.17 Using this model, the WGV between two time points is estimated based on the following equation:
Data analysis. We have expressed quantitative variables as mean and standard deviation, and calculated their differences between GA groups by means of analysis of variance (ANOVA). When assessed changes in weight over time with mixed-effects models for longitudinal data,18 and we used the R programming language for statistical calculations and to generate graphs.19 For this part of the study, due to the lesser number of observations in patients born at less than 24 weeks’ gestation, we grouped the most immature patients (born at 22–24 weeks) in a “24 or fewer weeks” category. We fitted separate models for the following categories: ≤24 weeks (n=629); 25 weeks (n=674); 26 weeks (n=958); 27 weeks (n=1046); and 28 weeks (n=1213). All models were developed according to the following formula:
where Weighti,j refers to the weight of the ith child in the jth assessment, weeki,j is the postmenstrual week, the αk term represents the fixed effects of the model, the random variable bi stands for the random effect of the ith child, ei,j for the internal variability and finally nodek for the nodes selected to build the spline. Here, z+ stands for the positive part of z. The model was estimated under the assumptions that the random effects bi were independent and followed a N(0,σb2) distribution, and the random variables ei,j were independent from each other, independent from bi and followed an N(0,σe2) distribution.Results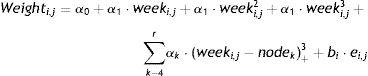
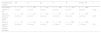
Of the 4522 patients in the initial cohort, 2 were excluded due to invalid postnatal data. Table 1 shows the total number of patients included in the study and the total number of weight measurements used in the calculations and to develop the graphs. Of the 4520 newborns, 2490 (55.1%) were male and 2030 (44.9%) female. Fig. 1 shows the distribution of birth weights by sex and GA. Girls weighed 5.6% less than boys on average (P<.001). However, for the longitudinal analysis of growth we used the combined values for both sexes for each GA (Fig. 2). This figure shows a similar pattern of postnatal growth for every GA, with a slow initial phase from birth to 28 days of life (WGV=8.0g/kg/day), a subsequent quickening between 28 days and 36 weeks of PMA (WGV=14.3g/kg/day) and once again a slowing up until to hospital discharge (WGV=11.7g/kg/day). In the first 28 days, the WGV was significantly slower in the most immature newborns, but these differences disappeared with chronological age (Table 2). Fig. 3 shows the mean weight gain curves for each GA group from birth to discharge from hospital, compared to the adapted Olsen et al. tables.3 We can discern a initial curve that slows down with a progressive “loss” of weight percentile, which decreases from the 50th percentile at birth to the 3rd to 10th percentile in the first weeks of life. This deceleration lasted longer in the most immature newborns, but from week 30 to 32 of PMA, the curves tended to gather around the 3rd to 10th percentiles until hospital discharge. Table 3 shows the mean weight for each GA group along with the corresponding z-score at each of the analysed time points. At birth, our patients had z-scores near zero, reflecting values similar to those in the reference curves. Later on, at 28 days post birth, the z-scores decreased for all GA groups by approximately 1.25 points, which reflects a postnatal growth retardation that became more pronounced by 36 weeks of PMA (z of approximately −1.6) and was sustained until discharge (z of approximately −1.7).
Number of patients and number of weight measurements used in the analysis and development of longitudinal growth curves by completed weeks of gestation.
| Weeks of gestation | 22 | 23 | 24 | 25 | 26 | 27 | 28 | Total |
|---|---|---|---|---|---|---|---|---|
| Patients | 21 | 145 | 463 | 674 | 958 | 1046 | 1213 | 4520 |
| Measurements | 44 | 336 | 1277 | 2104 | 3135 | 3571 | 4213 | 14680 |
.")
.")
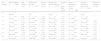
Weight gain velocity (in g/kg/day) by gestational age, in 3 intervals. Calculations were performed using the exponential method.
| Gestational age (weeks) | ≤24 | 25 | 26 | 27 | 28 | Total 22–28 | P |
|---|---|---|---|---|---|---|---|
| From birth to 28 days of life | n=220 | n=399 | n=655 | n=799 | n=1015 | n=3088 | |
| 7.2 (4.6) | 7.2 (5.2) | 7.6 (4.5) | 7.8 (4.4) | 8.9 (4.3) | 8.0 (4.6) | <.001 | |
| From 28 days to 36 weeks of PMA | n=176 | n=343 | n=544 | n=657 | n=756 | n=2476 | |
| 13.9 (3.1) | 14.0 (3.5) | 14.6 (3.4) | 14.4 (3.8) | 14.4 (4.2) | 14.3 (3.8) | .080 | |
| From 36 weeks of PMA to hospital discharge | n=177 | n=326 | n=492 | n=587 | n=668 | n=2250 | |
| 12.5 (6.4) | 12.0 (5.9) | 11.5 (6.2) | 11.7 (6.8) | 11.5 (7.2) | 11.7 (6.6) | .367 |
All values are expressed as mean (standard deviation).
.")
Mean weight gain curves for each GA group from birth to hospital discharge, against the standard curves adapted from Olsen et al.3 (weighted mean weight of both sexes for each GA).
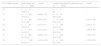
Changes in weight from birth to hospital discharge in extremely preterm infants.
| GA (weeks) | Birth weight (g) (N=4520) | Birth weight z-scorea | Weight at 28 days (g) (N=3102) | Weight at 28 days z-scorea | Weight at 36 weeks’ PMA (g) (N=2554) | Weight at 36 weeks’ PMA z-scorea | PMA at discharge in survivors (weeks) (N=2984) | Weight at discharge in survivors (g) (N=2982) | Weight at discharge z-scorea |
|---|---|---|---|---|---|---|---|---|---|
| 22 | n=21 526 (67) | – | n=1 730 | – | n=1 2870 | – | n=1 38 | n=1 3300 | – |
| 23 | n=145 612 (91) | 0.08 (1.18) | n=25 831 (144) | −0.81 (0.85) | n=21 1891 (521) | −1.70 (1.03) | n=19 42.1 (4.6) | n=19 3172 (816) | – |
| 24 | n=463 679 (98) | 0.11 (1.05) | n=194 854 (140) | −1.21 (0.69) | n=159 1863 (140) | −1.76 (0.62) | n=164 41.2 (4.0) | n=164 2795 (673) | −1.67 (1.34) |
| 25 | n=674 769 (125) | 0.09 (1.06) | n=401 969 (194) | −1.23 (0.87) | n=357 1927 (392) | −1.63 (0.78) | n=372 40.0 (3.9) | n=372 2671 (593) | −1.79 (1.23) |
| 26 | n=958 867 (156) | 0.07 (1.08) | n=660 1087 (206) | −1.27 (0.81) | n=561 1972 (366) | −1.54 (0.73) | n=629 38.9 (3.4) | n=630 2567 (535) | −1.73 (1.08) |
| 27 | n=1046 964 (189) | −0.02 (1.12) | n=803 1222 (245) | −1.36 (0.90) | n=682 1968 (381) | −1.55 (0.75) | n=788 38.4 (4.2) | n=786 2463 (482) | −1.73 (0.95) |
| 28 | n=1213 1075 (229) | −0.12 (1.13) | n=1018 1388 (279) | −1.29 (0.92) | n=773 1983 (388) | −1.52 (0.77) | n=1011 37.9 (4.1) | n=1010 2420 (457) | −1.71 (0.92) |
All values are expressed as mean (standard deviation).
The z-scores were calculated based on the average of the pooled values of both sexes in the tables of Olsen et al.3
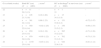
When it came to length and HC, we could not graph growth curves due to the lack of intermediate measurements. Tables 4 and 5 show the length and HC values at birth and at discharge with their corresponding z-scores. For both variables, the z-scores of our patients at birth were near zero, that is, they were at the 50th percentile in the reference tables. However, at the time of discharge the z-scores for HC had decreased by approximately 0.7, roughly approximating the 25th percentile, and by about 2 for length (≤3rd percentile).
Length at birth and at discharge in extremely premature infants.
| GA at birth (weeks) | Birth length (cm) (N=4049) | z-scorea | Length at dischargeb in survivors (cm) (N=2658) | z-scorea |
|---|---|---|---|---|
| 22 | n=13 29.0 (2.7) | – | n=1 48 | – |
| 23 | n=106 30.3 (2.1) | 0.004 (1.25) | n=16 46.5 (2.6) | – |
| 24 | n=380 31.5 (1.9) | 0.16 (1.10) | n=149 46.4 (3.3) | −2.23 (1.39) |
| 25 | n=581 32.9 (2.1) | 0.17 (1.01) | n=336 45.4 (3.2) | −2.42 (1.31) |
| 26 | n=853 34.1 (2.3) | 0.13 (1.06) | n=558 45.6 (3.4) | −2.05 (1.39) |
| 27 | n=968 35.3 (2.6) | 0.005 (1.10) | n=696 45.2 (2.6) | −1.99 (1.02) |
| 28 | n=1148 36.4 (3.0) | −0.16 (1.20) | n=902 45.2 (3.0) | −1.78 (0.98) |
All values are expressed as mean (standard deviation).
Head circumference at birth and at discharge in extremely preterm infants.
| GA at birth (weeks) | Birth HC (cm) (N=4065) | z-scorea | HC at dischargeb in survivors (cm) (N=2680) | z-scorea |
|---|---|---|---|---|
| 22 | n=11 20.2 (1.3) | – | n=1 33 | – |
| 23 | n=105 21.3 (1.8) | 0.19 (1.60) | n=15 34.1 (1.8) | – |
| 24 | n=381 22.1 (1.4) | 0.09 (1.23) | n=151 33.8 (2.2) | −0.72 (1.47) |
| 25 | n=580 22.9 (1.4) | −0.02 (1.20) | n=336 33.5 (2.3) | −0.69 (1.55) |
| 26 | n=859 23.9 (1.5) | 0.10 (1.19) | n=565 33.2 (2.0) | −0.71 (1.28) |
| 27 | n=970 24.8 (1.6) | −0.05 (1.22) | n=702 33.1 (2.1) | −0.73 (1.33) |
| 28 | n=1159 25.8 (1.8) | −0.03 (1.21) | n=910 32.8 (1.9) | −0.81 (1.12) |
All values are expressed as mean (standard deviation).
Our study, which analysed a large contemporary cohort of EPIs representative of every geographical area in Spain, showed that despite recent advances in perinatal care and the theoretical improvements introduced in the nutrition of very preterm infants, growth in the early weeks of extrauterine life is slower than intrauterine growth. Although the chosen time points for weight measurement were arbitrary, the WGV followed a sinusoidal pattern, which could result partly from clinical and partly from methodological aspects. We observed a slow weight gain in the first weeks of life, which could correspond to an increased metabolic rate during the period of adaptation to extrauterine life and the most critical stages of acute illness in these patients, as well as the real or perceived difficulties in providing adequate nutritional support.20 Furthermore, during this phase, the most immature newborns, who were probably also more critically ill, grew considerably slower than newborns with greater GAs. Later on, we observed an acceleration phase, with a WGV from 28 days post birth to 36 weeks of PMA that approximated foetal growth for equivalent GAs. During this phase, the differences between GA groups disappeared. A possible explanation is that the data collected during this period corresponds to survivors, and therefore to less critically ill patients, as those who died did so at a median of 5 days (interquartile range, 2–14.25). However, starting from 36 weeks, the data correspond to patients that remained hospitalised, in whom complications and underlying disease were probably more frequent, which could account for the renewed slowing of weight gain found in our study. At any rate, our data includes all the patients that were available at each time, and therefore their longitudinal growth pattern may reflect multiple circumstances in addition to nutritional support, such as genetic factors, environmental factors, disease severity, complications, etc. In fact, it is estimated that 50% of the variance in early postnatal growth is due to non-nutritional factors.21,22 A recent study showed that healthy preterm infants adjust their extrauterine growth trajectories to −0.8 z-scores below their intrauterine percentile after their initial physiologic adaptation, which could be considered a natural transition from intrauterine to extrauterine growth trajectories.23
An “adequate” weight curve is usually considered indicative of a healthy infant. However, in the case of preterm infants, we do not know with certainty which are the best reference standards, nor which growth pattern leads to the best possible outcomes in the long term. Preterm birth itself may be the final outcome of a complicated gestation, which means that preterm newborns could have weights below those of foetuses of the same GA that remain in utero.24 Furthermore, the extrauterine environment constitutes a drastic change for newborns that requires the activation of multiple adaptive mechanisms, with all the changes in metabolic rate and energy expenditure that this entails, and is compounded by the illness associated with prematurity, which may complicate the initiation and maintenance of enteral and parenteral nutrition.25 On the other hand, we ought to note that weight gain itself is not necessarily indicative of adequate nutrition, as it does not guarantee adequate changes in body composition. Everyday clinical practice and most studies do not differentiate between gains in lean mass and fat mass. Modern air-displacement plethysmography systems facilitate the assessment of body composition and weight gain quality,26,27 which combined with anthropometric measurements and the clinical follow-up of patients could help increase our knowledge or estimation of optimal growth patterns.28 Accelerated growth could lead to the development of metabolic and cardiovascular complications, while excessively slow growth has been associated with poorer neurodevelopmental outcomes.7–10,29 In fact, to date, none of the growth patterns has proven superior to others as regards medium- to long-term health outcomes. Some authors recommend against assigning patients target percentiles based on their birth weight, and instead proposed that they be assigned based on weight at 2–3 weeks post birth, that is, once weight gain has steadied.30
The association between growth and motor and cognitive development in patients is still subject to debate. It is generally accepted that EPIs are at high risk of both postnatal growth retardation and adverse neurodevelopmental outcomes.31,32 However, the causal relationship between these two phenomena and their potential mechanisms remain largely unknown. A recent study showed that a weight gain in the lowest quartile between 7 and 28 days of life is not associated with neurodevelopmental impairment,33 suggesting the possibility that underlying brain damage may itself be the cause of reduced growth in some cases. Kan et al. also found no association between intrauterine growth restriction and neurodevelopmental outcomes at age 8 years.34 Furthermore, this study found that weight at birth and subsequent ages had no significant impact on neurodevelopmental outcomes, while smaller HCs at ages 2 and 8 years were associated with impairment. The authors concluded that current nutritional practices do not have a negative impact on the neurodevelopmental outcomes of children born very preterm, even if their body growth during childhood is smaller compared to their full-term peers. Lastly, and along the same lines, studies on nutrient supplementation after hospital discharge have also failed to find solid evidence of its benefits on HC growth or neurodevelopmental outcomes.35
An interesting finding in our study was that postnatal growth restriction was more marked in length compared to weight or HC. This pattern of changes in anthropometric parameters has also been observed by other authors,36,37 who have demonstrated that it persists past discharge from hospital. This pattern differs from the classical pattern associated with malnutrition, in which weight is more affected than height and HC. This finding is important, as linear growth reflects the increase in lean mass and protein accretion, which in turn are indicative of the growth of organs, including the brain, whose growth is associated with the increase of neural processing speed in preterm infants.38 Although the optimal linear growth pattern is also not fully known, recent evidence has shown that reduced linear growth is associated with poorer long-term cognitive outcomes.37,39,40
One of the limitations of our study is that fluid therapy and nutritional interventions were not documented systematically, so we were not able to definitely establish their association with postnatal growth. However, one of its strengths is the large number of patients and of participating units, which makes our findings representative of the anthropometric variations at birth in a large contemporary cohort of extremely preterm infants that, in turn, could be a reflection of current clinical practices. Another limitation is that we do not have long-term follow-up data for this cohort of patients, so we could not determine whether there is an association, at least from an epidemiological standpoint, between growth pattern and neurodevelopmental outcomes.
In conclusion, EPIs exhibit a slow WGV in the first weeks post birth that may be partly explained as a phenomenon of adaptation to extrauterine life. It may be preferable to set the growth targets for these patients during their hospital stay not at the birth percentiles, but at the percentiles that the patient is at when this initial adaptation is complete. In any case, the assessment of growth based solely on weight gain does not seem appropriate. Close monitoring of linear and HC growth is essential for nutritional assessment and probably more important than weight gain in the detection of patients at risk of poor growth or neurodevelopmental outcomes after discharge from hospital.
Conflicts of interestThe authors have no conflicts of interest to declare
We thank all the researchers and coordinators in the SEN1500, the president and vice president, and the members of the working group.
Complejo Hospitalario de Albacete (Andrés Martínez Gutiérrez); Hospital Universitario de Basurto (Alberto Pérez Legorburu); Hospital del Bierzo (María Teresa Prada); Hospital de Cabueñes (Rafael García Mozo); Hospital Carlos Haya (Tomás Sánchez Tamayo); Hospital General de Castellón (Ramón Aguilera Olmos); Hospital Central de Asturias (Belén Fernández Colomer); Hospital Clínic de Barcelona (Josep Figuera Aloy); Hospital Clínico San Carlos (Araceli Corredera Sánchez); Hospital de Cruces (Amaya Rodríguez Serna); Hospital Universitario de Donostia (M. Ángel Cortajarena Altuna); Hospital de Elche (Josep Mut Buigues); Hospital General de Cataluña (Laura Castells Vilella); Hospital General de Granollers (Israel Anquela Sanz); Hospital Germans Trias i Pujol (W. Coroleu); Hospital de Getafe (Lucía Cabanillas Vilaplana); Hospital Infanta Margarita (José María Barcía Ruiz); Hospital de Jerez (Dolores Esquivel Mora); Hospital Juan Ramón Jiménez (José Ángel Morilla Sánchez); Hospital Juan XXIII (Mar Albújar); Hospital de León (Emilio Álvaro Iglesias); Hospital Miguel Servet (Segundo Rite Gracia); Corporació Parc Taulí (Juan Badia); Hospital San Juan de Déu (Martín Iriondo Sanz); Hospital San Pedro de Logroño (Inés Esteban Díez); Hospital San Pedro de Alcántara (Mª Jesús López Cuesta); Hospital de la Santa Creu i Sant Pau (Gemma Ginovart Galiana); Hospital Severo Ochoa (María José Santos Muñoz); Hospital Txagorritxu (María Mercedes Martínez Ayucar); Hospital Universitario Arnau de Vilanova (Eduard Solé Mir); Hospital Valme (Antonio Gutiérrez Benjumea); Hospital Virgen de la Concha (Víctor Marugán Isabel); Hospital UniversitarioVirgen de la Macarena (Mercedes Granero Asencio); Hospital Virgen de la Salud (Alicia de Ureta Huertas); Hospital UniversitarioVirgen de las Nieves (M. Fernanda Moreno Galdó); Hospital Xeral de Vigo (María Suárez Albo); Hospital Universitario de Valencia (Javier Estañ Capell); Hospital Universitario de Zaragoza (Purificación Ventura Faci); Hospital Universitario de Santiago (M. Luz Couce Pico); Hospital General de Burgos (Cristina de Frutos Martínez); Hospital General Universitario de Alicante (Miriam Salvador Iglesias); Hospital Universitario de Fuenlabrada (Laura Domingo Comeche); Hospital Universitario Gregorio Marañón (Amparo Rodríguez Herreras); Hospital Universitario La Paz (M. Dolores Elorza); Hospital Materno Infantil de Canarias (Lourdes Urquía Martí); Hospital Universitario de Canarias (Pedro A. Fuster Jorge); Hospital Universitario de San Cecilio (Eduardo Narbona); Hospital Universitari i Politècnic La Fe (Isabel Izquierdo Macián); Hospital Universitario Reina Sofía (Juana María Guzmán Cabañas); Hospital Universitario Río Hortera (M. Mar Montejo Vicente); Hospital Universitario de Salamanca (Pilar García González); Hospital Universitario Virgen del Rocío (Carmen Macías Díaz); Hospital Universitario Dexeus (Roser Porta); Scias-Hospital Barcelona (Silvia Martínez-Nadal). Hospital Josep Trueta (Alberto Trujillo); Complejo Hospitalario Universitario de Pontevedra (Javier Vilas González); Hospital Universitario de Ciudad Real (Miguel Ángel Cabezas); Hospital Puerta del Mar (Antonio Segado Arenas); Hospital Doce de Octubre (Carmen R. Pallás Alonso).
Appendix A details the names of the hospitals and researchers of the SEN1500 neonatal network.
Please cite this article as: García-Muñoz Rodrigo F, Figueras Aloy J, Saavedra Santana P, García-Alix A. Crecimiento posnatal hasta el alta hospitalaria en recién nacidos extremadamente prematuros españoles. An Pediatr (Barc). 2017;87:301–310.
Previous presentation: this study was presented in part at the XXV Congreso de Neonatología y Medicina Perinatal of the Sociedad Española de Neonatología, May 2015, Seville, Spain.

Anales de Pediatría (English Edition) follows the Recommendations for the Conduct, Reporting, Editing and Publication of Scholarly Work in Medical Journals