


Neonatal hypoglycemia offers multiple controversies. The study aims to assess the main factors involved in the development of early hypoglycemia in term and late preterm infants, and the implication of different environmental circumstances.
MethodsA prospective cohort study in infants born between 34 0/7 weeks and 36 6/7 weeks of gestation. Three capillary blood glucose determinations were performed during the eight first hours after birth. Sample size: 207, 59 neonates developed hypoglycemia.
ResultsPrenatal risk factors include gestational diabetes with poor glycemic control, twin pregnancy and gestational age. The presence of meconium amniotic fluid and planned cesarean delivery are associated with a higher probability of hypoglycemia. After birth, skin to skin contact, breastfeeding, soft lightening, and normothermia are described as protective factors. The predictive model that combines the type of lightening, body temperature and the excess of bases level, correctly classifies 98% of the severe hypoglycemia cases, with a high Nagelkerke R2 value (0.645) and specificity of 99.5%.
ConclusionsPostnatal environmental factors seem to be directly related to early hypoglycemia development, so it is essential to support the maternal-child union and breastfeeding. Our results allow better identification of neonates who are not subsidiary to performing blood glucose determinations because they have little risk of developing it.
La hipoglucemia neonatal ofrece múltiples controversias. El objetivo del estudio es valorar los principales factores y circunstancias ambientales implicados en el desarrollo de hipoglucemia neonatal precoz.
MétodosEstudio analítico prospectivo de una cohorte de recién nacidos entre 34 + 1 y 40 + 6 semanas de edad gestacional. Se realizó determinación de glucemia capilar a las 2, 4 y 8 horas de vida. Tamaño muestral: 207, 59 neonatos desarrollaron hipoglucemia.
ResultadosPrenatalmente, los factores con mayor influencia fueron la diabetes gestacional con mal control glucémico, gemelaridad y edad gestacional. La presencia de líquido amniótico meconial y el nacimiento por cesárea programada se asociaron a mayor probabilidad de hipoglucemia. Postnatalmente, el contacto precoz piel con piel, la succión al pecho, la iluminación tenue y la normotermia fueron factores protectores. El modelo predictivo que combinó tipo de iluminación, temperatura corporal y cifra de exceso de bases clasificó correctamente al 98% de los casos de hipoglucemia grave, con un R2 de Nagelkerke de 0,645 y especificidad del 99,5%.
ConclusionesLos factores postnatales ambientales parecen estar relacionados de forma directa en el desarrollo de hipoglucemia precoz, por lo que el apoyo a la unión maternofilial y a la lactancia materna es fundamental. Nuestros resultados permiten una mejor identificación de los neonatos que no son subsidiarios de realizar controles de glucemia por tener poco riesgo de desarrollarla.
Hypoglycaemia is one of the most frequent metabolic abnormalities in neonates,1 and there is substantial disagreement as regards its definition, clinical picture, relevance of its asymptomatic presentations and potential impact on neurodevelopment.2 At present, there are multiple protocols for its management that differ in the spectrum of patients considered at risk and the blood glucose range for which treatment is indicated.3,4
Glucose is the main source of energy for the body and is almost the sole source of energy for the central nervous system. Blood glucose levels in the neonate vary based on multiple factors, such as the type of delivery, gestational age (GA) and weight of the infant.5 Neonates can use sources of energy other than glucose in the first hours post birth (hpb), but prematurity and other factors may impair this physiological counterregulatory response. When this happens, the immaturity of the neonatal brain makes it more vulnerable to the adverse effects associated with hypoglycaemia.6,7
The aim of our study was to assess the main factors associated with early neonatal hypoglycaemia.
Material and methodsWe conducted a longitudinal analytical study through the follow-up of a cohort of 207 neonates, of who 59 developed hypoglycaemia within 8 hpb. Ten neonates were excluded upon the request of the family. We included neonates born between 34+1 and 41+6 weeks of gestation and whose mothers had not received intravenous [IV] glucose solution during delivery. We measured blood glucose levels in neonates with the Stat Strip Xpress glucose meter at 2, 4 and 8 hpb. We defined hypoglycaemia (overall) as a blood glucose level less than 45 mg/dL, moderate-to-severe hypoglycaemia (MSHG) as a level less than 36 mg/dL and severe hypoglycaemia (SHG) as a level of less than 18 mg/dL. Subsequently, we compared the variables of interest in patients that developed hypoglycaemia and patients that did not. Hypoglycaemia was not treated unless the blood glucose levels were below 25 mg/dL or the patient developed symptoms (making efforts to promote sucking at the breast, administration of expressed breast milk [BM] or formula or intravenous glucose).
We collected data on the following variables:
- •
Maternal: age, educational attainment, exposure to toxic substances/drugs, pregestational disease, weight and height.
- •
Gestational: weight gain, gestational disease, twin pregnancy, vaginal/rectal culture.
- •
Birth-related: characteristics of amniotic fluid, rupture of membranes, type of delivery and use of anaesthesia.
- •
Perinatal: GA, sex, weight, need of resuscitation, Apgar scores, early mother-child contact (skin-to-skin), sucking at breast (at birth and at 2, 4 and 8 hpb), feeding modality.
- •
Laboratory results: umbilical artery levels of glucose, lactate and base excess (BE).
- •
Postnatal: separation from parents, individual room, environmental noise (assessed with a decibel meter: mild, <60 dB; moderate, 60−80 dB, intense, >80 dB), environmental light levels (1. darkness, 2. dim light: presence of a source of light far from the infant and 3. bright light: presence of 2 sources of light or a single source that expose the infant to direct light), sucking at breast (at the time of testing or in the 30 min prior), position of infant relative to the mother at the time of blood glucose measurement. Early neonatal disease (respiratory distress, sepsis, etc).
We calculated the sample size using the software Epidat 31 (estimating potential losses to follow-up of 10%, for a minimum power of 80% and a 95% level of confidence) and performed the statistical analysis with the software SPSS version 250. In the descriptive analysis, we summarised qualitative variables as absolute frequency and percentage distributions. We summarised quantitative variables as median and interquartile range (IQR). We conducted a bivariate analysis with hypothesis testing. In the multivariate analysis, we started by fitting simple logistic regression models in which hypoglycaemia was the dependent variable and the variables previously found to be significant in the bivariate analysis were the independent variables. Subsequently, we fitted a logistic regression model to predict hypoglycaemia (with automated variable selection or manual selection of variables with statistically significant differences between groups). We controlled for potential confounders and other sources of bias. We established a statistical significance level of 95% (P < .05).
The study adhered to ethical principles in clinical research8,9 and was approved by the Regional Ethics Committee. We obtained the written informed consent of the legal guardians of all participants.
ResultsFig. 1 presents blood glucose level trends in the sample under study.
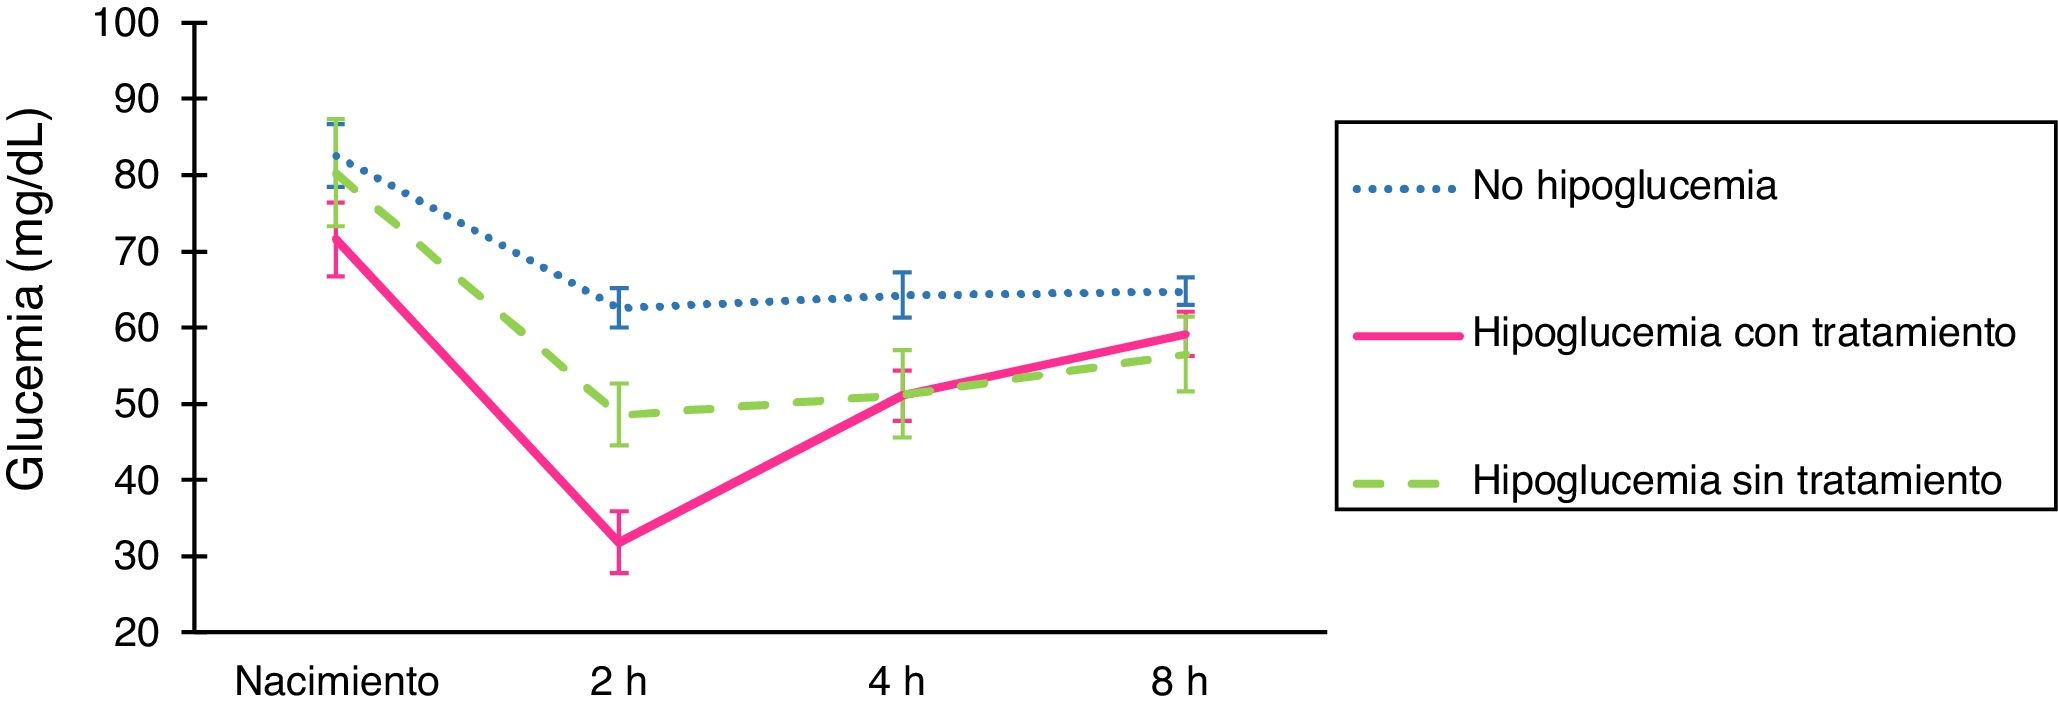
Comparison of the changes in blood glucose levels based on whether or not the patients developed hypoglycaemia. At birth, glucose was measured in a sample of arterial blood (umbilical artery), and subsequent measures were performed in samples of capillary blood. Glucose levels are expressed in mg/dL. The error bars mark the maximum and minimum of the standard error. Treatment, consistent in sucking at the breast and/or supplementation with formula and/or intravenous glucose, was indicated in symptomatic patients or patients that developed levels under 25 mg/dL in the first 2 h post birth.
We proceed to present the results for the variables for which we found statistically significant differences.
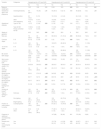
Analysis of factors associated with hypoglycaemia (glucose <45 mg/dL) (Table 1)
Association between prenatal variables with statistically significant differences and postnatal variables analysed in the groups under study (neonates with hypoglycaemia vs without hypoglycaemia) at 2, 4 and 8 h of life.
| Variable | Categories | Hypoglycaemia at 2 h post birth | Hypoglycaemia at 4 h post birth | Hypoglycaemia at 8 h post birth | ||||||
|---|---|---|---|---|---|---|---|---|---|---|
| No | Yes | P | No | Yes | P | No | Yes | P | ||
| Maternal weight gain | 10/5 | 10/8 | .593 | 9.3/6 | 12/5 | .005 | 10/5 | 14/4 | .001 | |
| Gestational age or risk pregnancy | Overweight/obesity | 35 (23.1) | 18 (30) | <.01 | 40 (26.4) | 6 (21.4) | .555 | 45 (26.8) | 0 (0) | <.01 |
| Hypothyroidism | 20 (13.2) | 6 (10) | 19 (12.6) | 4 (14.2) | 24 (14.3) | 0 (0) | ||||
| Other | 12 (7.9) | 4 (6.7) | 13 (8.6) | 3 (10.7) | 13 (7.7) | 1 (10) | ||||
| Twin pregnancy | 0 (0) | 7 (11.6) | 5 (3.3) | 2 (7.1) | 5 (3) | 2 (20) | ||||
| Gestational diabetes | Type A1 GD | 1 (0.7) | 2 (3.6) | .029 | 3 (1.8) | 0 (0) | .318 | 2 (1.1) | 1 (9.1) | .310 |
| Type A2 GD | 10 (6.6) | 2 (3.6) | 11 (6.5) | 1 (0.6) | 12 (6.4) | 0 (0) | ||||
| Poorly controlled A2 GD | 1 (0.7) | 3 (5.4) | 4 (2.4) | 0 (0) | 4 (2.1) | 0 (0) | ||||
| Weeks of gestation | 40/2 | 39/3 | .006 | 39/2 | 39/3 | .6 | 39/2 | 38/5 | .307 | |
| Male sex | 79 (52.3) | 35 (62.5) | .191 | 96 (53.9) | 21 (72.4) | .034 | 99 (53.2) | 7 (6.6) | .501 | |
| 5-minute Apgar | 5−8 | 8 (5.3) | 2 (3.6) | .607 | 5 (3) | 3 (7.8) | .008 | 7 (3.8) | 0 (0) | |
| 9−10 | 143 (94.7) | 54 (96.4) | 163 (97) | 26 (92.3) | 179 (96.2) | 11 (100) | ||||
| 10-minute Apgar | 5−8 | 1 (0.7) | 0 (0) | .542 | 0 (0) | 1 (3.4) | .010 | 1 (0.5) | 0 (0) | |
| 9−10 | 150 (99.3) | 56 (100) | 168 (100) | 28 (96.6) | 185 (99.5) | 11 (100) | ||||
| BE at birth | −4.7/4.1 | −4.3/4.2 | .116 | −4.4/3.4 | −6.2/3.8 | .016 | −4.6/3.8 | −5.5/7.2 | .657 | |
| Birth weight | 3254 (512) | 3118 (618) | .076 | 3220/563 | 3138/498 | .374 | 3220/730 | 2940/980 | .037 | |
| Skin-to-skin contact at birth | 118 (7.1) | 31 (55.4) | .022 | 105 (63) | 15 (52) | .272 | 114 (61.3) | 6 (54.5) | .754 | |
| Temperature at birth (°C) | 36.5/0.4 | 36.4/0.5 | .028 | 36.5/0.5 | 36.5/0.5 | .647 | 36.5/0.4 | 36.4/0.6 | .984 | |
| Acute neonatal disease | 16 (10.6) | 15 (26.8) | .04 | 23 (13.7) | 7 (24.1) | .162 | 26 (14) | 3 (27.3) | .209 | |
| Blood glucose 2 h (mg/dL) | 60/16 | 37.5/10 | <.001 | 54.5/22 | 49/32 | .019 | 53.5/23 | 43/23 | .019 | |
| Blood glucose 4 h (mg/dL) | 60/17 | 54/16 | .002 | 60.5/16 | 40/9 | <.01 | 58/16 | 41/20 | <.001 | |
| Blood glucose 8 h (mg/dL) | 62/13 | 56/15 | .004 | 62/15 | 55/22 | .002 | 62/15 | 40/8 | .002 | |
| Formula feeding from birth | 5 (3.3) | 9 (16.1) | .003 | 9 (5.4) | 5 (17.2) | .037 | 12 (6.4) | 2 (18.2) | .178 | |
| Sucking at breasta | 103 (68.2) | 24 (42.9) | .001 | 105 (62.5) | 11 (37.9) | .013 | 129 (69.7) | 3 (27.3) | .006 | |
| Type of lighting in roomb | Darkness | 2 (1.3) | 0 (0) | .022 | 9 (5.4) | 1 (3.4) | .813 | 17 (9.2) | 2 (18.2) | .490 |
| Dim lighting | 140 (92.7) | 47 (83.9) | 130 (77.8) | 22 (75.9) | 145 (78.4) | 7 (63.6) | ||||
| Bright lighting | 9 (6) | 9 (16.1) | 28 (16.8) | 6 (20.7) | 23 (12.4) | 2 (18.2) | ||||
| Position of infant relative to mother | Cosleeping/held | 106 (70.2) | 30 (53.6) | .025 | 87 (52.1) | 13 (44.9) | .029 | 101 (54.3) | 6 (54.5) | .760 |
| In crib | 0 (0) | 0 (0) | 77 (46.1) | 15 (51.7) | 82 (44.1) | 5 (45.5) | ||||
| Other | 45 (29.8) | 26 (46.4) | 3 (1.8) | 1 (3.4) | 3 (1.6) | 0 (0) | ||||
| Presence of additional accompanying person | 147 (88) | 26 (90) | .801 | 173 (93) | 9 (82) | .174 | ||||
| Shared room | Yes | 13 (7.8) | 4 (13.8) | .289 | 18 (9.7) | 1 (9.1) | .949 | |||
| Loud environmental noisec | Yes | 20 (12) | 5 (17.2) | .433 | 28 (15) | 0 (0) | .165 | |||
BE, base excess; GD, gestational diabetes; h, hour.
Quantitative data summarised as median/interquartile range (values separated by a slash). Qualitative data summarised as absolute frequency followed by the percentage relative to the total of patients in the group in parentheses. We defined hypoglycaemia as a blood glucose level <45 mg/dL. Blood glucose levels were measured in umbilical artery blood samples at birth and in capillary blood samples thereafter.
In the univariate analysis, we found a higher frequency of twin pregnancy (P < .01) and gestational diabetes (GD) (mainly type A2 with poor control) in the hypoglycaemia group (P = .029). The probability of hypoglycaemia decreased by 24% with each additional week of GA (OR, 0.765; 95% CI, 0.64 to 0.91; P = .003). The type of delivery associated with the highest incidence of hypoglycaemia was the elective caesarean delivery, with a 3.2-fold increase in the probability of hypoglycaemia (OR, 3.2; 95% CI, 1.5–7.07; P = .003) (Table 1).
Lower Apgar scores at 5 and 10 min post birth were associated with the development of hypoglycaemia (P ≤ .010). Infants with lower weights were also more likely to develop hypoglycaemia (P = .037). Early skin-to-skin contact and normal body temperature had a protective effect (P = .022 and P = .028, respectively). The probability of hypoglycaemia was 2.1 times greater when skin-to-skin contact did not take place (OR, 2.109; 95% CI, 1.115–3.988; P = .021). Sucking at the breast was the factor associated with the lowest percentage of hypoglycaemia at the 3 time points (P < .02). Patients that did not breastfeed within 4 h were 2.6 times more likely to develop hypoglycaemia (OR, 2.560; 95% CI, 1.408–4.645; P = .002). Also, the probability of hypoglycaemia was 4.4 times greater in infants fed formula (OR, 4.394; 95% CI, 1.326–14.563; P = .009) compared to infants breastfed on demand.
The risk of early hypoglycaemia increased by a factor of 3.1 in infants with neonatal disease (OR 3.075; 95% CI, 1.361–6.947; P = .005).
Darkness or dim lighting were associated with a lower percentage of hypoglycaemia (P = .022). We did not find differences based on sharing a room or the presence of an additional person accompanying the infant and mother.
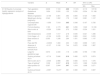
In the multivariate study, the model that included twin pregnancy, normal vaginal delivery and breastfeeding at 4 hpb classified 71.4% of the cases correctly (Table 2).
Logistic regression analysis of variables that significantly associated with hypoglycaemia (detection of capillary blood glucose level < 45 mg/dL at 2, 4 or 8 h post birth).
| Variable | β | Wald | P | OR | 95% CI (OR) | ||
|---|---|---|---|---|---|---|---|
| Min | Max | ||||||
| [17.0] Results of univariate logistic regression analysis of hypoglycaemia | Twin gestation | 2.838 | 7.103 | .008 | 17.074 | 2.119 | 137.59 |
| Gestational diabetes | 1.654 | 2.020 | .155 | 5.230 | 0.534 | 51.188 | |
| Weeks of gestation | −0.156 | 3.461 | .063 | 0.855 | 0.725 | 1.008 | |
| Weight gain during pregnancy | 0.042 | 1.802 | .179 | 1.042 | 0.981 | 1.107 | |
| Uncomplicated vaginal birth | −1.056 | 7.919 | .005 | 0.348 | 0.167 | 0.726 | |
| Formula feeding | 1.180 | 4.173 | .041 | 3.256 | 1.049 | 10.106 | |
| Skin-to-skin at birth | −0.524 | 3.208 | .073 | 0.592 | 0.334 | 1.051 | |
| Infant temperature | −0.439 | 1.517 | .218 | 0.645 | 0.321 | 1.296 | |
| 5-min Apgar < 9 | −0.124 | 0.035 | .851 | 0.883 | 0.241 | 3.233 | |
| Base excess at birth | 0.050 | 1.248 | .264 | 1.051 | 0.963 | 1.147 | |
| Peso del RN | −0.0003 | 1.060 | .303 | 1.000 | 0.999 | 1.001 | |
| Absence of meconium in amniotic fluid | −0.137 | 0.106 | .744 | 0.872 | 0.383 | 1.987 | |
| Large for gestational age | 0.874 | 2.430 | .119 | 2.396 | 0.799 | 7.189 | |
| Sucking at breast at 2 h | −0.714 | 5.846 | .016 | 0.490 | 0.275 | 0.874 | |
| Skin-to-skin at 2 h | −0.545 | 2.988 | .084 | 0.580 | 0.313 | 1.076 | |
| Type of lightinga | 1.339 | 6.557 | .010 | 3.815 | 1.369 | 10.633 | |
| Infant position at 2 hb | 0.597 | 3.944 | .047 | 1.816 | 1.008 | 3.271 | |
| Sucking at breast at 4 h. | −0.967 | 10.277 | .001 | 0.380 | 0.211 | 0.687 | |
| Variables | β | Wald | P | OR | 95% CI (OR) | Model characteristics | ||
|---|---|---|---|---|---|---|---|---|
| Min | Max | |||||||
| Logistic regression model of hypoglycaemia obtained with automated variable selection | Twin gestation | 2.688 | 6.234 | .013 | 14.698 | 1.782 | 121.22 | R2 = 0.185.Sen: 31.1%.Spe: 96.6%. |
| Uncomplicated vaginal birth | −0.987 | 6.237 | .013 | 0.373 | 0.172 | 0.809 | ||
| Sucking at breast at 4 h | −0.926 | 8.295 | .004 | 0.396 | 0.211 | 0.744 | ||
| Constant | 0.731 | 3.469 | .063 | |||||
CI, confidence interval; Max, maximum; Min, minimum; Sen, sensitivity; Spe, specificity. R2: Nagelkerke, adjusted version of the Cox and Snell R2.
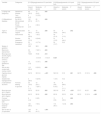
We found a higher frequency of MSHG in twins (P = .025), infants of mothers with type A2 GD with poor glycaemic control and infants born a younger GAs (P = .039). Late preterm infants were 3.7 times more likely to develop MSHG (OR, 3.688; 95% CI, 1.295–10.505; P = .015) (Table 3).
Comparison of variables in the group that developed moderate-to-severe hypoglycaemia versus the group that did not. We only present the variables in which we found statistically significant differences.
| Variable | Categories | [0.3-5]Hypoglycaemia at 2 h post birth | [0.6-8]Hypoglycaemia at 4 h post birth | [0.9-11]Hypoglycaemia at 8 h post birth | ||||||
|---|---|---|---|---|---|---|---|---|---|---|
| Absent or mild | Moderate-severe | P | Absent or mild | Moderate-severe | P | Absent or mild | Moderate-severe | P | ||
| [1.0]High-risk pregnancy | Gestational disease | 96 (52.4) | 13 (54.2) | .025 | ||||||
| Twin gestation | 4 (2.2) | 3 (12.5) | ||||||||
| [1.0]Gestational diabetes | No GD/A1 GD/controlled A2 GD | 181 (97.3) | 22 (91.7) | .029 | ||||||
| Poorly controlled A2 GD | 5 (2.7) | 2 (8.3) | ||||||||
| Type of delivery | Uncomplicated vaginal | 91 (49.7) | 10 (43.5) | .028 | 93 (49.5) | 4 (44.4) | .032 | |||
| Instrumental | 42 (22.9) | 1 (4.3) | 40 (21.3) | 1 (11.2) | ||||||
| Elective caesarean | 28 (15.3) | 8 (34.8) | 31 (16.5) | 4 (44.4) | ||||||
| Emergency caesarean | 22 (12.1) | 4 (17.4) | 24 (12.7) | 0 (0) | ||||||
| Weeks of gestation | 39/2 | 38/3 | .039 | |||||||
| Meconium-stained fluid | 22 (12) | 7 (29.1) | .023 | |||||||
| Blood glucose at birth (mg/dL) | 79/29 | 70/30 | .014 | |||||||
| BE at birth (mmol/L) | −4.5/3.6 | −7.5/2.9 | 0.021 | |||||||
| Large for gestational age | 10 (5.5) | 4 (16.7) | .040 | |||||||
| Skin-to-skin contact with mother at birth | 116 (63.4) | 8 (33.3) | .005 | |||||||
| Capillary blood glucose (mg/dL) | 56/18 | 30.5/14 | <.001 | 58.5/16 | 31/6 | .001 | 62/15 | 31.5/14 | .029 | |
| Symptomatic hypoglycaemia | 2 (28.6) | 5 (20.8) | 1 (0.5) | 0 (0) | ||||||
| [1.0]Treatment at 2/4/8 h | Formula feeding | 23 (12.6) | 13 (54.1) | 18 (9.6) | 6 (66.6) | |||||
| IV glucose | 2 (1.1) | 7 (29.1) | 8 (4.2) | 1 (11.1) | ||||||
| Blood glucose at 4 h (mg/dL) | 59/16 | 52/19 | .003 | 58.5/16 | 31/6 | <.001 | 57/17 | 40.5/1 | .029 | |
| Blood glucose at 8 h (mg/dL) | 62/15 | 56/18 | .043 | 62/16 | 52/16 | .014 | 62/15 | 31.5/14 | <.001 | |
| Formula feeding from birth | 8 (4.4) | 6 (25) | 11 (5.8) | 3 (33.3) | .002 | |||||
| Sucking at breast at 2/4/8 ha | 120 (94.5) | 7 (5.5) | 115 (99.1) | 1 (0.9) | .003 | |||||
| Skin-to-skin at 2 h post birth | 139 (76) | 10 (41.7) | <.001 | |||||||
BE, base excess; GD, gestational diabetes; IV, intravenous.
Quantitative data summarised as median/interquartile range (values separated by a slash). Qualitative data summarised as absolute frequency followed by the percentage relative to the total of patients in the group in parentheses. We defined hypoglycaemia as a blood glucose level <45 mg/dL (moderate-to-severe hypoglycaemia, <36 mg/dL; severe hypoglycaemia, <18 mg/dL). Blood glucose levels measured in umbilical artery blood samples at birth and in capillary blood samples thereafter.
The type of delivery associated most frequently with MSHG was the elective caesarean section, followed by emergency caesarean section and uncomplicated vaginal birth (P = .032). We found an association between meconium-stained fluid and MSHG (P = .023). A higher proportion of infants small for gestational age (SGA) developed MSHG (11.1% of SGA infants vs 0.5% of adequate for gestational age infants), although the difference was not statistically significant.
After birth, the practice of skin-to-skin contact was associated with a lower incidence of MSHG (P < .001). The probability of developing MSHG increased 5-fold in infants that were not put in contact with the mother’s skin soon after birth (OR, 5.006; 95% CI, 2.038–12.296; P < .001). Infants that had not been held or coslept by hour 2 post birth were 4.7 times more likely to develop MSHG (OR, 4.711; 95% CI, 1.882–11.792; P < .001). Infants that had not fed at the breast by 2 h post birth were 5.2 times more likely to develop MSHG (OR, 5.211; 95% CI, 2.027–13.401; P < .001).
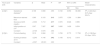
In the multivariate analysis, we found a higher probability of MSHG in (Table 4): children of mothers with poorly controlled type A2 GD (8.2-fold increase in probability of MSHG), lower GA (every week of GA subtracted increased the probability by a factor of 1.3), infants delivered by elective caesarean section (2.8-fold increase in probability), infants born with meconium-stained fluid, infants subjected to bright lighting and infants that were not in close contact with the mother (4.6-fold increase). In infants that fed at the breast within 2 hpb, the probability of MSHG decreased by as much as 21% compared to infants that did not.
Univariate logistic regression analysis of moderate-to-severe hypoglycaemia.
| Hours post birth | Variables | β | Wald | P | OR | 95% CI (OR) | ||
|---|---|---|---|---|---|---|---|---|
| Min | Max | |||||||
| [17.0]Moderate-severe hypoglycaemia | [12.0]2 h | Twin gestation | 1.279 | 3.088 | .079 | 3.592 | 0.863 | 14.952 |
| Gestational diabetesa | 2.107 | 4.226 | .040 | 8.227 | 1.103 | 61.360 | ||
| Weeks of gestation | −0.268 | 5.461 | .019 | 0.765 | 0.611 | 0.958 | ||
| Tipo de partob | −1.018 | 4.513 | .034 | 0.361 | 0.141 | 0.924 | ||
| Skin-to-skin at birth | −1.242 | 7.310 | .007 | 0.289 | 0.117 | 0.711 | ||
| Cord blood pH | 0.148 | 0.095 | .758 | 1.159 | 0.453 | 2.967 | ||
| Amniotic fluid (meconium stained) | 1.103 | 4.803 | .028 | 3.013 | 1.124 | 8.082 | ||
| Infant temperature | −0.119 | 0.051 | .822 | 0.888 | 0.317 | 2.491 | ||
| Cord blood glucose (mg/dL) | −0.031 | 6.706 | .010 | 0.970 | 0.947 | 0.993 | ||
| Large for gestational age | 1.241 | 3.797 | .051 | 3.460 | 0.993 | 12.059 | ||
| Sucking at breast at 2 h post birth | −1.532 | 10.386 | .001 | 0.216 | 0.085 | 0.549 | ||
| Type of lightingc | 1.236 | 4.553 | .033 | 3.441 | 1.106 | 10.708 | ||
| Infant position at 2 h post birthd | 1.538 | 11.077 | .001 | 4.655 | 1.882 | 11.513 | ||
| [4.0]4 h | Infant temperature | −0.221 | 0.065 | .798 | 0.802 | 0.148 | 4.359 | |
| Excess base in cord blood | −0.173 | 3.287 | .070 | 0.841 | 0.698 | 1.014 | ||
| Formula feeding | 2.085 | 7.288 | .007 | 8.045 | 1.771 | 36.559 | ||
| Sucking at breast at 4 h. | −2.534 | 5.596 | .018 | 0.079 | 0.010 | 0.648 | ||
| Skin-to-skin at 2 h. | −0.765 | 1.227 | .268 | 0.465 | 0.120 | 1.801 | ||
CI, confidence interval; Max, maximum; Min, minimum.
The variables that we found to be independently associated with MSHG at 2 hpb were: meconium-stained fluid, cord blood glucose level at birth and location/position of the infant at 2 h. The predictive model for MSHG explained 22.4% of the variance in this variable and classified 88.7% of cases correctly. At 4 hpb, the variables associated independently with MSHG were: formula feeding from birth not given for nutritional support (8-fold increase in probability of hypoglycaemia) and feeding at the breast (decrease of 7% in probability of MSHG compared to infants that did not). This model had a Nagelkerke R2 of 0.188 and classified 95.4% of cases correctly (Table 5).
Logistic regression model of moderate-to-severe hypoglycaemia at 2 and 4 h post birth.
| Hours post birth | Variables | β | Wald | P | OR | 95% CI (OR) | Model characteristics | |
|---|---|---|---|---|---|---|---|---|
| Min | Max | |||||||
| [4.0]2 h | Gestational diabetesa | 2.168 | 3.668 | .055 | 8.740 | 0.950 | 80.366 | R2 = 0.224.Sen: 8.3%.Spe: 99.4%. |
| Meconium-stained fluid | 1.380 | 6.103 | .013 | 3.975 | 1.330 | 11.884 | ||
| Glucose at birth (mg/dL) | −0.030 | 5.712 | .017 | 0.970 | 0.946 | 0.995 | ||
| Infant position at 2 hb | 1.307 | 7.267 | .007 | 3.695 | 1.429 | 9.554 | ||
| Constant | −0.735 | 0.570 | .450 | |||||
| [2.0]4 h | Formula feeding | 1.310 | 2.684 | .101 | 3.706 | 0.773 | 17.758 | R2 = 0.188.Sen: 0%.Spe: 100%. |
| Sucking at breast at 4 h | −2.240 | 4.146 | .042 | 0.106 | 0.012 | 0.919 | ||
| Constant | −2.527 | 29.931 | .000 | |||||
CI, confidence interval; Max, maximum; Min, minimum; Sen, sensitivity; Spe, specificity. R2: Nagelkerke, adjusted version of the Cox and Snell R2.
The 10-minute Apgar score and body temperature were inversely correlated to blood glucose levels (P = .003 and P = .039). We ought to highlight the decreased frequency of skin-to-skin contact (P = .010) and of feeding at the breast in the first hours of life (P = .008 and P = .011) compared to the group that did not develop SHG. The group that developed SHG had higher BE values (P = .003) and a higher proportion of infants with SHG experienced symptoms associated with hypoglycaemia (P < .001) (Table 4).
We found a higher probability of SHG in: children of mothers with poorly controlled type A2 GD (OR, 16.58; 95% CI, 1.402–196.08; P = .026), infants delivered by elective caesarean section (OR for all other types of delivery, 0.047; 95% CI, 0.004 to 0.435; P = .007), infants subjected to bright light (OR, 53.7; 95% CI, 5.619–513.50; P = .001) and infants with lower body temperatures (each 1-degree decrease was associated with a 5.74-fold increase in the probability of SHG) (OR, 0.174; 95% CI, 0.033–0.927; P = .040) (Table 6).
Variables significantly associated with severe hypoglycaemia at 2 h post birth.
| Variable | No severe hypoglycaemia | Severe hypoglycaemia | P |
|---|---|---|---|
| Maternal height (cm) | 163.07/9 | 157.2/10 | .043 |
| 10-minute Apgar | 199 (98.5) | 4 (80) | .003 |
| Base excess in umbilical cord blood (mmol/L) | −4.6/4 | −3.7/4.8 | .009 |
| Skin-to-skin contact with mother at birth | 124 (60) | 0 (0) | .010 |
| Temperature at birth (°C) | 36.5/0.4 | 36/0.3 | .039 |
| Capillary blood glucose at 2 h post birth (mg/dL) | 53.5/21 | 13/4 | <.001 |
| Symptoms of hypoglycaemia at 2 h post birth | 4 (2) | 3 (60) | <.001 |
| Skin-to-skin contact with mother at 2 h post birth | 149 (73.8) | 0 (0) | .002 |
| Sucking at breast at 2 h post birth | 127 (62.9) | 0 (0) | .008 |
| Sucking at breast at 4 h post birth | 117 (57.9) | 0 (0) | .011 |
| Loud environmental noise at 4 h post birtha | 21 (10.4) | 4 (80) | .001 |
Quantitative data summarised as median/interquartile range. Qualitative data summarised as absolute frequency followed by the percentage in parentheses.
The multivariate analysis identified dim lighting and normal body temperature as protectors against hypoglycaemia. Bright lighting was associated with a 3000-fold increase in the probability of SHG (OR for dim light, 0.0003; 95% CI, 0.00 to 0.307). In infants, each decrease in temperature by 1 degree was associated with a 1000-fold increase in the probability of SHG (OR, 0.001, IC95%: 0.00 to 0.287). Each unit increase in the BE in umbilical cord blood was associated with a 1.5-fold increase in the probability of SHG (OR, 1.508; 95% CI, 1.005–2.261). The predictive model accounted for 64.5% of the variance in SHG, classifying 98% of cases correctly (Table 7).
Logistic regression model for severe hypoglycaemia at 2 h post birth.
| Variable | β | Wald | P | OR | 95% CI (OR) | ||
|---|---|---|---|---|---|---|---|
| Min | Max | ||||||
| Results of univariate logistic regression analysis of severe hypoglycaemia at 2 h post birth | Gestational diabetesa | 2.808 | 4.966 | .026 | 16.583 | 1.402 | 196.08 |
| Type of deliveryb | −3.056 | 7.257 | .007 | 0.047 | 0.005 | 0.435 | |
| Type of lightingc | 3.984 | 11.961 | .001 | 53.714 | 5.619 | 513.50 | |
| Cord blood pH | −0.054 | 0.009 | .923 | 0.948 | 0.320 | 2.806 | |
| Birth temperature (°C) | −1.747 | 4.200 | .040 | 0.174 | 0.033 | 0.927 | |
| Excess base at birth (mmol/L) | 0.196 | 2.274 | .132 | 1.217 | 0.943 | 1.571 | |
| Variable | β | Wald | P | OR | 95% CI (OR) | Model characteristics | ||
|---|---|---|---|---|---|---|---|---|
| Min | Max | |||||||
| Logistic regression model for severe hypoglycaemia at 2 h including postnatal clinical and laboratory variables | Dim lighting | −8.106 | 5.262 | .022 | 0.0003 | 0.000 | 0.307 | R2 = 0.645.Sen: 40%.Spe: 99.5%. |
| Birth temperature (°C) | −6.810 | 5.757 | .016 | 0.001 | 0.000 | 0.287 | ||
| Excess base at birth (mmol/L) | 0.411 | 3.942 | .047 | 1.508 | 1.005 | 2.261 | ||
CI, confidence interval; Max, maximum; Min, minimum; Sen, sensitivity; Spe, specificity. R2: Nagelkerke, adjusted version of the Cox and Snell R2. A regression model was not built for 4 and 8 h post birth because there were not enough cases for the analysis.
The literature describes the physiological pattern of blood glucose levels in healthy neonates,10–12 with a rapid decline to trough levels at 1–2 h post birth and a gradual increase thereafter until stabilizing at 12–24 hpb.5 Recently, the position that early moderate hypoglycaemia in healthy neonates does not require intervention has become widely accepted.13,14
Gestational diabetes is a historically known risk factor for neonatal hypoglycaemia. The associated risk is even greater if infants happen to have macrosomia or are delivered before term.15 In our study, we found a higher probability of hypoglycaemia in children of mothers with poorly controlled type A2 GD compared to infants of mothers without this condition.
Preterm infants are a known risk group for hypoglycaemia. In our study, we found that the probability of hypoglycaemia increased by a factor of 1.3 with every 1-week decrease in GA (P = .003). In the case of SHG, there is no evidence of differences between late preterm 34 weeks of GA, at least to prevent SHG, if not moderately low glucose levels.
Patients with a history of intrauterine grown restriction are at increased risk of neonatal morbidity, even more so if born preterm.16,17 In our study, we found an association between lower birth weight and hypoglycaemia at 8 h (P = .037). A possible explanation that low birth weight was not identified as an independent risk factor may be the exclusion of infants born preterm before 34 weeks, so that the sample only includes the least vulnerable subset in this risk group.
Twin gestation was associated with a 13.7-fold increase in the probability of hypoglycaemia compared to singleton gestation. An association between twin pregnancy and increased neonatal morbidity and mortality, including early hypoglycaemia, has been described in the literature, but other factors generally associated with it, mainly preterm birth but also low birth weight and monochorionic pregnancy may contribute to this association.18 In our study, we found that twin gestation was associated directly and independently with the rest of the variables.
Caesarean delivery has been studied as a potential risk factor for hypoglycaemia, with contradictory results.17,19–21 In our study, elective caesarean section was the type of delivery associated with the highest risk of hypoglycaemia (2.9-fold increase in probability; P = .004) and SHG (21-fold increase in probability; P = .007), and was directly and independently associated with other factors under study. The main pathophysiological mechanism involved in this association may be the absence of stress hormone elevation associated with natural labour (adrenaline and cortisol), which stimulate the glucose counterregulatory response, and the lack of contact between mother and infant after birth.
In our study, foetal distress during childbirth was assessed by means of the Apgar score, blood pH, BE and lactate level at birth. We found differences in the 5- and 10-minute Apgar scores in infants with mild-to-moderate hypoglycaemia and in the 10-minure Apgar score in infants with severe hypoglycaemia (P = .003). The base excess has been studied in the past as potential marker of hypoglycaemia,22,23 but the results were not significant. In our study, we found an association between decreasing BE values and mild-to-moderate hypoglycaemia at 8 hpb (P = .037). We found higher BE values in patients with SHG (P = .009), which suggests that larger negative BE values (or a larger base deficit) translate to a larger concentration of ketone bodies that serve as an alternative substrate for energy production, which would justify the smaller negative values observed in patients with SHG. It is possible that in the case of mild-to-severe hypoglycaemia, due to the initial presence of lactate as the main alternative substrate for energy production, BE values serve rather as a marker of foetal stress than as an indicator of energy levels.
Early skin-to-skin contact has been described as a highly effective nonpharmacological measure not only for glucose homeostasis, but also for thermoregulation and lung adaptation, among other beneficial effects.24,25 In our study, it was associated with a decreased risk of hypoglycaemia, mild, moderate-to-severe (P = .010) or severe (P = .001), independently from other factors.
There is evidence that uncontrolled hypothermia is associated with an increase in neonatal mortality, with an 80% increase in mortality with each 1-degree decrease in temperature. The most effective and recommended preventive measure is immediate skin-to-skin contact after birth.24,26 The findings of our study were consistent with the previous literature, as we found that a low body temperature was directly and independently associated with other variables that carried an increased probability of SHG.
Dim lighting was found to be an independent risk factor in the analysis. The impact of environmental light levels on neonatal and paediatric well-being has been investigated thoroughly,27–29 but studies on the subject have mainly focused on preterm or severely ill patients that are more fragile and vulnerable to adverse environmental factors. Their results support strict control of environmental factors not only in the case of preterm infants, but also for healthy ones, as, while the risk of morbidity is lesser, reducing light pollution decreases stress and facilitates the development of adequate homeostatic responses.
In the past, formula feeding was contemplated as a potential protector against early neonatal hypoglycaemia,30 but it has since been demonstrated that breastfeeding promotes glucose homeostasis by stimulating the release of alternative substrates.5 In our study, formula feeding was associated with a 4.4-times greater risk of hypoglycaemia (P = .009). Breastfeeding offers multiple benefits for mother and infant.31–33 These positive effects are not attributed solely to breast milk but also to the contact between mother and child. Sucking at the breast is the factor associated with the lowest incidence of hypoglycaemia in the first 8 hpb (P < .02). This is a modifiable and easy to monitor postnatal risk factor, and therefore its consideration in the management of newborn infants in the first hours post birth is highly advisable.
Infants with conditions that affect aerobic metabolism, such as respiratory distress or sepsis, have an impaired capacity to adapt to extrauterine life.1,34 We found a 3-fold increase in the probability of hypoglycaemia in these patients (P = .004). A higher proportion of patients with SHG developed symptoms (P < .001), with was consistent with the previous literature.35
The prediction and control of risk factors for SHG are very important in clinical practice on account of their impact on treatment and outcomes, so we devoted particular effort to develop several predictive models that could be valid in our area and setting. These models combine prenatal and postnatal factors and had high Nagelkerke R2 values. All variables are easy to detect or measure, and the models are simple, explanatory and highly specific, facilitating the classification of infants unlikely to develop SHG, which can help avoid unnecessary blood glucose tests and save the corresponding costs.
The main limitations of our study involve potential biases that we did our best to minimise by providing training workshops on the correct assessment of environmental factors. We considered measuring glucose in venous blood after every capillary blood glucose measurement, but this procedure would have increased stress in the patients, so we decided against including it in the protocol (the glucose meter used in the study is highly accurate, even in the low-glucose range). We reserved venous blood glucose level monitoring for infants with levels under 25 mg/dL or who developed symptoms.
ConclusionWith this study, we were able to narrow down the prenatal factors that play an important role in the development of hypoglycaemia and evinced the importance of postnatal and environmental factors in the development of early neonatal hypoglycaemia in infants delivered from 33 weeks of GA.
FundingThis research did not receive any external funding.
Conflict of interestThe authors have no conflicts of interest to declare.
Data availabilityData will be made available on request.
Please cite this article as: Martín Ruiz N, García Íñiguez JP, Rite Gracia S, Samper Villagrasa MP, Estudio prospectivo de factores perinatales asociados a hipoglucemia precoz en el neonato prematuro tardío y a término. Anales de Pediatría. 2022;96:230–241.
