

Spain is the European leader in overweight (O-W), partly to the social and environmental changes of the last decades. The objective of the work was to study the modifiable risk factors that lead to O-W.
Material and methodsA self-designed questionnaire with factors related to childhood obesity was produced, and was administered to the parents of adolescents who were attending first year of high school in four centres in Health Area V in Murcia. Weight, height, abdominal circumference and Waist-Height Index (WHI) of the students were measured, and classified as overweight-obesity. A reduction technique was applied, generating factors that grouped the items according to subject, as well as a multivalent technique to assess the dependency relationship between the variables, and the SB-OI.
ResultsOf the 421 students included, 28% and 35% had excess weight and abdominal obesity, respectively. The factor analysis grouped the items into 4 factors: diet, physical activity, technologies, and environment, with a subsection about body perception. The structural equation model presented an R2 of 0.440. The highest relationship was obtained with the environment factor (t 2.89), and perception (t 14.61), followed by the use of technologies. A direct relationship was also revealed regarding diet and physical activity, although not significant.
ConclusionsFamily perception and the social-school environment have an important influence on the development of the O-W. Health education interventions involving parents and teachers are probably the smartest and most cost-effective strategies.
España se sitúa a la cabeza europea en exceso de peso (EP) debido en parte a los cambios sociales y ambientales de las últimas décadas. El objetivo del trabajo fue estudiar los factores de riesgo modificables que condicionan el EP.
Material y métodosSe autodiseñó una encuesta con los factores relacionados con la obesidad infantil y se administró a los padres de adolescentes que cursaban primero de secundaria en cuatro centros del Área V de Salud de Murcia. Se objetivó peso, talla, perímetro abdominal e Índice Cintura-Talla (ICT) de los alumnos y se clasificaron en sobrepeso-obesidad. Se aplicó técnica de reducción de dimensiones, generando factores que agruparon los ítems según materia y se realizó técnica multivalente para valorar la relación de dependencia entre las variables y el exceso de peso.
ResultadosFueron incluidos 421 alumnos, 28% y 35% con exceso de peso y obesidad abdominal, respectivamente El análisis factorial agrupó los ítems en 4 factores: alimentación, actividad física, tecnologías y entorno, existiendo un subapartado de percepción corporal. El modelo de ecuaciones estructurales presentó un R2 de 0.440. Se obtuvo la mayor relación con el factor entorno (t 2.89), y percepción (t 14.61), seguido del uso de tecnologías. Además reveló una relación directa respecto a la alimentación y la actividad física, aunque no significativa.
ConclusionesLa percepción familiar y el ambiente social-escolar influyen de forma importante en el desarrollo del EP. Las intervenciones de educación para la salud con inclusión de padres y profesores probablemente sean las estrategias más inteligentes y rentables.
The current increase in the frequency of overweight and obesity in the paediatric population poses significant health risks and is a public health challenge. Based on data from the World Health Organization (WHO), in 2013 there were approximately 42 million children under 5 years with excess weight (overweight or obesity) worldwide, 10 million more than in 1990, with developed countries accounting for most of this increase. In this context, Spain is the leading country in childhood overweight and obesity in the European Union, with prevalences of nearly 20% and 10%, respectively,1,2 making excess weight the most frequent noncommunicable disease and the most frequent nutritional or metabolic disorder in the paediatric population.1,3
The aetiology of obesity is multifactorial and polygenic, and since there is no curative treatment at present, prevention is key. Thus, we know that the development or persistence of excess weight involves the interaction of different metabolic, psychosocial or environmental risk factors. The latter have been the object of growing interest in recent years, as they all share a common characteristic: they are modifiable and offer a possible target for interventions aimed at controlling the obesity pandemic. There is no question that healthy lifestyle and dietary habits have changed with globalization. Diets based on highly processed foods, a lack of physical activity, sleep deprivation and advances in technology that have led to greater use of electronic devices have shaped a new reality.4,5 This may explain why social determinants and lifestyle habits play a crucial role. Furthermore, the complications of obesity as a chronic disease can have serious consequences for health,6,7 such as respiratory diseases, cardiovascular diseases, endocrine disorders or psychosocial disorders, among others, in addition to some of these conditions, such as atherosclerosis, developing at increasingly early ages.8
Given the magnitude of the problem, and with the aim of minimising the risk factors associated with obesity, different institutions are developing strategies to promote the acquisition of healthy habits from childhood.2,9,10 It is important to keep in mind that the most sensitive or higher-risk periods for development of excess weight are the first year of life and adolescence, when individuals acquire life-long habits11,12: according to the Food and Agriculture Organization (FAO), 4 out of 5 obese children will continue to be obese in adulthood. The main objectives of these targeted strategies are to reduce morbidity and mortality, increase quality of life and reduce associated health care costs, and they are achieving positive results, but the observed effectiveness has not met current needs,13 since in countries like Spain the increasing trend in prevalence does not seem to be abating.14,15
The approach to this health problem poses a challenge of such magnitude that studies are required to develop preventive strategies that can achieve a maximum of benefits with a minimum of resources. Thus, the aim of our study was to analyse the modifiable risk factors that have the most impact on childhood overweight and obesity to facilitate the development of more effective targeted and personalised interventions.
Material and methodsWe conducted a cross-sectional study with inclusion of students enrolled in year 1 of secondary education in Health Area V of the Region of Murcia during the 2017–2018 and 2018–2019 academic years. We requested the participation of the 7 schools in the boundaries of the health area, of which 4 agreed to participate (3 public schools and 1 publicly funded private school) and the rest refused participation on the grounds of lack of open time in the academic year. Considering the size of the population of the selected age in the health area, we calculated that we needed a minimum sample size of 350 children for a maximum error of 4.92% with a 95% level of confidence, selecting proportions of students from each school that matched the proportion for the school in the total population of the health area There were 2 phases in data collection, one in which we administered a questionnaire to the parents designed by the research team, and one in which we took the anthropometric measurements of the students. The study was accepted by the Clinical Research Ethics Committee of the Hospital Universitario Virgen de la Arrixaca in Murcia.
To develop the questionnaire, we reviewed the literature on the main risk factors for overweight and obesity: diet, physical activity, screen time, academic performance, interpersonal relationships, personal satisfaction and self-concept. Subsequently, the team discussed the most relevant items that had to be included in the instrument to cover the main aspects associated with childhood obesity that are not included in commonly used questionnaires. The final questionnaire included 51 items rated on a 0–10 Likert scale to allow future analysis and comparison. We sent a copy of the questionnaire to the home address of each family to be completed by the parents, along with an explanatory sheet that included information about the study, its voluntary nature, the anonymity of responses and confidentiality, as well as an informed consent form.
During the second phase, the health care team visited the schools and performed the anthropometric measurements of the adolescents in classrooms arranged for the purpose. The students underwent measurement barefoot and in light clothing. We measured the weight, height and waist circumference (WC) with a tape measure, scale and stadiometer that met industry standards. All measurements were taken twice by the same individual, and the mean of the 2 measurements used in the analysis. After collecting the data, we classified students as having normal weight or excess weight (EW), the latter group including children with overweight or obesity. The weight status classification was based on the body mass index (BMI) and WC z-score distribution for age and sex using growth charts obtained from the Spanish population as reference,16,17 and on the weight-to-height ratio (WHtR) applying established cut-off points.18 Given the lack of consensus on population standards and cut-off points to define EW, we used 3 different indicators to define the outcome variable in order to reduce error and minimise the limitations of each of the procedures.
We performed the statistical analysis with the software SPSS® 18.0 and SmartPLS 2.0. Prior to the multivariate analysis, we performed a factor analysis to determine whether there was any association between the initial P-values. To determine the suitability of the data we performed the Kaiser-Meyer-Olkin test for sampling adequacy and Bartlett’s sphericity test, considering factor loadings greater than 0.7 meaningful.19 After verifying that the assumptions for the method were met, we proceeded to reduce the dimensionality of the data, selecting the items with a factor load greater than 0.3, which left the most important items grouped in dimensions that we named based on the content. Lastly, to assess the causal relationships between the obtained dimensions and childhood EW, and in consideration to the non-Gaussian distribution of the data and the predictive intent of the analysis, we developed a structural equation model using the partial least squares (PLS) approach,20,21 through which we also determined the direction and strength of the association. For each item, we accepted loading values greater than 0.7, with significance defined as a t value greater than 1.96 (95% confidence) and a coefficient of determination (R2) greater than 0.1.22 Based on the current evidence, we formulated the following hypotheses:
- •
Hypothesis 1 (H1): there is a negative correlation between the level of physical activity and the development of EW.
- •
Hypothesis 2 (H2): there is a positive correlation between poor dietary habits and the development of EW.
- •
Hypothesis 3 (H3): there is a positive correlation between an unfavourable social and school environment and the development of EW.
- •
Hypothesis 3.2 (H3.2): there is a positive correlation between the inaccurate perception of parents of the weight of their children and the development of EW.
- •
Hypothesis 4 (H4): there is a positive correlation between the excessive use of new technologies and the development of EW.
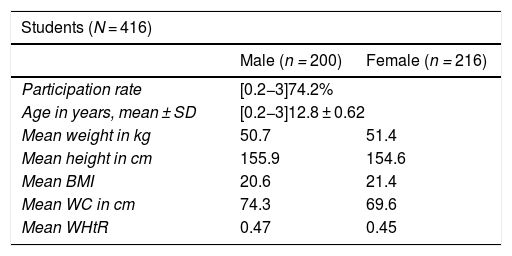
Of the initial selected sample of 567 adolescents, 421 (74.2%) agreed to participate, and 5 were excluded on account of chronic disease (Turner syndrome, uncontrolled hypothyroidism, trichorhinophalangeal syndrome, maturity-onset diabetes of the young and reduced mobility). Most questionnaires were completed by mothers (82%), 15% by fathers, 1% by both parents and 2% by other caregivers. The final sample included 416 adolescents with a mean age of 12.8 (standard deviation [SD], 0.62), 52% female. We found a prevalence of EW of 28.6% based on the BMI, 33.4% based on the WC and 35.1% based on the WHtR (Table 1). When it came to the parental perception of the weight status of their children, 32% did not identify EW in their children.
Sociodemographic characteristics of the sample.
| Students (N = 416) | ||
|---|---|---|
| Male (n = 200) | Female (n = 216) | |
| Participation rate | [0.2−3]74.2% | |
| Age in years, mean ± SD | [0.2−3]12.8 ± 0.62 | |
| Mean weight in kg | 50.7 | 51.4 |
| Mean height in cm | 155.9 | 154.6 |
| Mean BMI | 20.6 | 21.4 |
| Mean WC in cm | 74.3 | 69.6 |
| Mean WHtR | 0.47 | 0.45 |
| [0,1–3]Parents (N = 815) | ||
|---|---|---|
| Fathers (n = 400) | Mothers (n = 415) | |
| Response rate; % | 97.11 | 99.75 |
| Age in years, mean ± SD | 45.23 ± 4.98 | 42.63 ± 5.3 |
| Educational attainment | ||
| No education; n (%) | 20 (4.8) | 14 (3.4) |
| Primary education; n (%) | 169 (40.6) | 169 (40.6) |
| Secondary education; n (%) | 145 (4.9) | 137(32.9) |
| University; n (%) | 66 (15.9) | 95 (22.9) |
| Not documented; n (%) | 16 (3.8) | 1 (0.2) |
BMI, body mass index; SD, standard deviation; WC, waist circumference; WHtR, waist-to-height ratio.
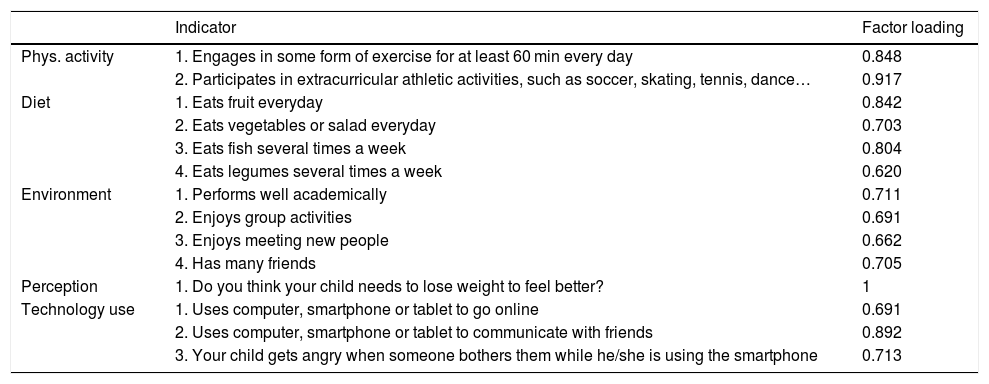
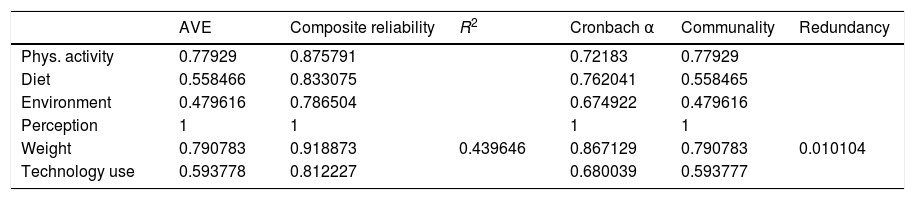
In the suitability analysis that preceded factor analysis, we obtained a KMO statistic of 0.752 for sampling adequacy. The rotated component matrix included 26 items structured in 4 dimensions that we labelled as follows: diet (DIET), physical activity (PA), information and communication technologies (ICTs) and environment (EN). Using structural equation modelling to identify the most relevant items, the model was reduced to 14 items maintaining the initial distribution by dimensions, only with a subgroup in the EN dimension that referred to the parental perception of weight status in their children (Table 2). The structural equation modelling analysis yielded an R2 of 0.440 with values above the recommended thresholds for validation; Fig. 1 presents the main results of the analysis. Table 3 presents the results of the validation of the models and scales, with values above the recommended threshold in most cases. When it came to AVE, it confirmed the convergence validity of latent variables with values very close to or above 0.50 in every case. Table 4 summarises the results of hypothesis testing and the direct effects of the variables. The t values and the P-values estimated by bootstrapping confirmed all the hypotheses except those related to physical activity and diet.
Distribution of items into dimensions after structural equation modelling.
| Indicator | Factor loading | |
|---|---|---|
| Phys. activity | 1. Engages in some form of exercise for at least 60 min every day | 0.848 |
| 2. Participates in extracurricular athletic activities, such as soccer, skating, tennis, dance… | 0.917 | |
| Diet | 1. Eats fruit everyday | 0.842 |
| 2. Eats vegetables or salad everyday | 0.703 | |
| 3. Eats fish several times a week | 0.804 | |
| 4. Eats legumes several times a week | 0.620 | |
| Environment | 1. Performs well academically | 0.711 |
| 2. Enjoys group activities | 0.691 | |
| 3. Enjoys meeting new people | 0.662 | |
| 4. Has many friends | 0.705 | |
| Perception | 1. Do you think your child needs to lose weight to feel better? | 1 |
| Technology use | 1. Uses computer, smartphone or tablet to go online | 0.691 |
| 2. Uses computer, smartphone or tablet to communicate with friends | 0.892 | |
| 3. Your child gets angry when someone bothers them while he/she is using the smartphone | 0.713 |

Validation of models and scales. Measures of reliability.
| AVE | Composite reliability | R2 | Cronbach α | Communality | Redundancy | |
|---|---|---|---|---|---|---|
| Phys. activity | 0.77929 | 0.875791 | 0.72183 | 0.77929 | ||
| Diet | 0.558466 | 0.833075 | 0.762041 | 0.558465 | ||
| Environment | 0.479616 | 0.786504 | 0.674922 | 0.479616 | ||
| Perception | 1 | 1 | 1 | 1 | ||
| Weight | 0.790783 | 0.918873 | 0.439646 | 0.867129 | 0.790783 | 0.010104 |
| Technology use | 0.593778 | 0.812227 | 0.680039 | 0.593777 |
AVE, average variance extracted.
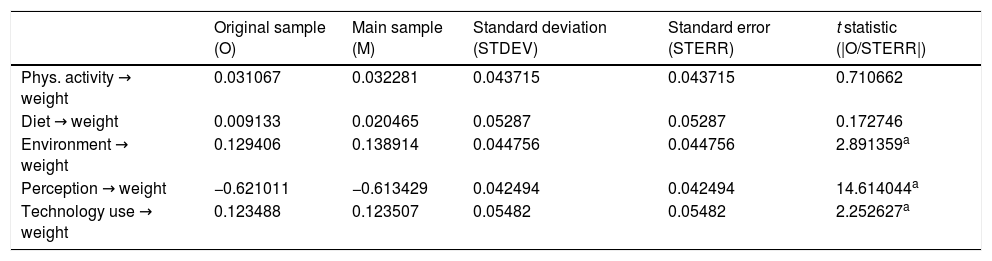
Hypothesis testing comparing different dimensions and overweight or obesity.
| Original sample (O) | Main sample (M) | Standard deviation (STDEV) | Standard error (STERR) | t statistic (|O/STERR|) | |
|---|---|---|---|---|---|
| Phys. activity → weight | 0.031067 | 0.032281 | 0.043715 | 0.043715 | 0.710662 |
| Diet → weight | 0.009133 | 0.020465 | 0.05287 | 0.05287 | 0.172746 |
| Environment → weight | 0.129406 | 0.138914 | 0.044756 | 0.044756 | 2.891359a |
| Perception → weight | −0.621011 | −0.613429 | 0.042494 | 0.042494 | 14.614044a |
| Technology use → weight | 0.123488 | 0.123507 | 0.05482 | 0.05482 | 2.252627a |
Tables 2 and 4 summarise the analysis and results of hypothesis testing. Starting with H1, we found a direct and positive magnitude of 0.031 for the effect of PA on childhood EW, although the result was not statistically significant, and therefore we accepted the null. The variables in the group that contributed most to this factor were engagement in extracurricular athletic activities and adherence to the 60 min of daily physical activity recommended by the WHO. For the factor constituted by items referring to diet (H2), we found a positive magnitude of 0.009 for the effect on childhood EW, with a t value of 0.172, so we accepted the null as well. The most influential variables in the DIET dimension were the consumption of fruit and the consumption of fish. As for H3 (EN), we found a direct and statistically significant relationship with the development of EW. We obtained a magnitude of 0.129 and a t value of 2.89, leading to rejection of the null. The items that had the most weight in the dimension were academic performance and having many friends. We created a subdimension (H3.2) that referred to the parental perception of the child’s body that exhibited a very strong association and was statistically significant, although in this case in a negative direction. It had a magnitude of −0.621 with a t value of 14.61 (P < .001), leading to rejection of the null. This evinced the considerable impact of the parental perception of the body of their children on the development of EW by the latter, in addition to their perception frequently being inaccurate. Lastly, the testing of H4 confirmed the association between excessive use of ICTs and childhood EW, which was direct and statistically significant. It had a magnitude of 0.12 with a t value of 2.25, leading to rejection of the null. The most influential factors were use of electronic devices to communicate with peers and the presence of conflicts in relation to smartphone use.
DiscussionThe aim of our study was to analyse the multifactorial aetiology of EW in adolescents. The association between childhood obesity and certain risk factors, such as sedentary lifestyles, hypercaloric diets, excessive use of screens, obesogenic school or household environments and the inaccurate perception of parents of their children’s weight, has been studied extensively.4,5,23,24 The use of this new questionnaire developed by our research group offered an improvement over the use of existing instruments, as it not only integrated the dimensions known to affect health, but also used a uniform rating scale that yielded comparable results, was easy to interpret and could be applied in other contexts, such as clinical practice. We used factorial analysis to group the variables under study into dimensions and structural equation modelling to determine which modifiable risk factors promote the development of EW and to which degree, which allows a more practical interpretation of results.
The prevalence of EW observed in our study was similar to the prevalence reported in the previous literature applying the same parameters, obtaining a prevalence of 28.6% based on the BMI, compared to 32% in a study in the Region of Murcia,25 a prevalence of 33.6% based on the WC only slightly greater than the prevalence of nearly 30% reported by Pérez-Rios et al.,26 and a prevalence of 31% based on the WHtR that was very close to the 31% observed by Calderón et al.27 Since the Orbegozo growth charts for the Spanish population tend to underestimate overweight, we included the WHtR and WC, which are also better indicators of the presence of abdominal fat and metabolic risk.27,28
Having analysed every hypothesis, we ought to highlight the following findings based on relevance and the strength of the association: the strongest determinant for the development of EW was the parental perception of the body weight of the children, as parents are not likely to take measures to combat EW if they are not aware of its presence. The literature evinces that parental perceptions of the weight status of their children are usually inaccurate, and studies conducted in Spain have found that between 50% and 60% of parents are not aware of the presence of EW in their children,2,4,29,30 which could explain the progressive increase in the prevalence of EW despite various interventions. Given the general tendency to underestimate overweight and obesity, intervention strategies should be adjusted, starting from the inclusion of families. The second most influential dimension identified in our study was the one composed of items regarding the social and school environment. There is evidence that the quality of relationships with peers, the ability to make friends, the experience of bullying or the ability to work in a team are associated with the development of EW, and that obese children have less self-esteem and score lower in quality of life scales.31 Adolescents spend one third of their time in school, which makes the latter one of the modifiable settings that may have the most impact. All of the above calls for the development of multidimensional strategies involving, among other groups, the teaching staff, since setting up a comfortable and pleasant environment for students could yield important health benefits. Information and communication technologies were the third associated factor, since a large portion of the hours devoted to learning, interpersonal communication and leisure today are spent in front of a screen, so the results on this dimension were not surprising, as most of this time is spent at the expense of physical activity.27,32 Although these technologies may offer important benefits such as motivation, interest or autonomy, we must not forget their drawbacks, like distraction or isolation, so it would be interesting to investigate whether this new vehicle for learning may result in an increase in EW. Lastly, physical activity and diet were directly but not significantly correlated to EW. The association between lack of exercise and EW in the paediatric population has been well defined in the past.32–35 Different aspects may explain why this causal relationship was not observed in our study, for example, that the study population was from a rural setting, where people tend to have more active lifestyles compared to urban areas, for instance by walking to school or playing outdoors. Another possible contributor is the Activa Familias programme that has been implemented since late 2016 to promote engagement in extracurricular athletic activities. As for diet, globalization and changes in the pace of everyday life in current society have had a substantial and negative impact on healthy nutrition. There is a progressive abandonment of traditional dietary patterns, with an increase in the excessive consumption of hypercaloric processed foods with low nutritional value.5,9,29 Our study did not confirm our hypothesis, which could also be explained by the rural setting, as in rural settings like the where we performed our study, children and adolescents exhibit greater adherence to the Mediterranean diet compared to their peers in urban settings,36 as has also been observed in other Mediterranean countries.37,38 To date, the modifiable factors studied most extensively have been diet and physical activity through behaviour modification interventions targeting children, but we must not forget the influence of other factors, such as the environment, the perception of weight status and the use of new technologies, that may be equally strong or even stronger determinants of excess weight.
There are limitations to our study, chief of which are its cross-sectional design and small sample selected from a single health area. Randomization was not possible, and we did not take into account parental or demographic variables that may have acted as confounders. In the future, we expect to carry out prospective studies in urban populations to investigate these factors.
In conclusion, we conducted a study with an innovative statistical approach that allowed us to establish causality as well as the magnitude of the association. On the other hand, we did not only consider the most thoroughly investigated modifiable factors, such as diet and physical activity, but also others that have not been studied as extensively. The factors that were correlated most strongly with the development of EW were the use of new technologies, the social and school environment and, mainly, the parental perception of the weight status of the children, which was inaccurate in many cases. Thus, it is reasonable to assert that the biggest opportunity for improvement rests on interventions aimed at educating parents on the detection of EW and making them aware the substantial health benefits of adequate weight control in their children and of creating the most favourable social and school environment possible.
Conflicts of interestThe authors have no conflicts of interest to declare.
Please cite this article as: Jiménez Candel MI, Carpena Lucas PJ, Ceballos-Santamaría G, Mondéjar Jiménez J, Monreal Tomás AB, Lozano Pastor VE. Causalidad entre factores de riesgo modificables y sobrepeso en adolescentes de 12–14 años. An Pediatr (Barc). 2020. https://doi.org/10.1016/j.anpedi.2020.08.004
