


The biomedical research process must follow certain quality criteria in its design and development to ensure that the results are credible and reliable. Once completed, the time comes to write an article for publication. The article must present in sufficient detail, and in a clear and transparent manner, all the information on the research work that has been carried out. In this way, readers, after a critical reading of the published content, will be able to judge the validity and relevance of the study and, if they so wish, make use of the findings.
In order to improve the description of the research process for publication, a series of guidelines have been developed which, in a simple and structured way, guide authors in the preparation of a manuscript. They are presented in the form of a list, flowchart, or structured text, and are an invaluable aid when writing an article.
This article presents the reporting guidelines for the most common designs along with the corresponding checklists.
El proceso de investigación biomédica debe seguir unos criterios de calidad en su diseño y elaboración, que garanticen que los resultados son creíbles y fiables. Una vez finalizado, llega el momento de escribir un artículo para su publicación. Este debe presentar con suficiente detalle, y de forma clara y transparente, toda la información del trabajo de investigación realizado. De esta forma, los lectores, tras una lectura crítica de lo publicado, podrán juzgar la validez y la relevancia del estudio, y si lo consideran, utilizar los hallazgos.
Con el objetivo de mejorar la descripción del proceso de investigación para su publicación, se han desarrollado una serie de guías que, de forma sencilla y estructurada, orientan a los autores a la hora de elaborar un manuscrito. Se presentan en forma de lista, diagrama de flujo, o texto estructurado, y son una ayuda inestimable a la hora de escribir un artículo.
Este artículo presenta las guías de elaboración de manuscritos de los diseños más habituales, con sus listas de verificación.
In recent decades, there has been an exponential increase in the number of biomedical publications and, at the same time, concern has grown about the quality of their reporting. In the 1990s, a series of initiatives started to be developed with the aim of improving the quality of the content of scientific publications, at first focused on randomised controlled trials. These initiatives took shape in a series of guidelines that offered structured recommendations on the information that should be included in a paper depending on the study design.
The English term used to refer to them, reporting guidelines, has been translated to Spanish in different ways: “listas-guía”, ‘lista de directrices”, “directrices para la comunicación”, “directrices de presentación de informes”… This has given rise to some confusion as to what they are and what their purpose is, which is to improve reporting in published studies. They are also frequently referred to with the broad term of “checklists”, confusing them with other types of guidelines or tools whose purpose is to assess bias and the applicability of previously published reports. There are multiple tools for these purposes. One example would be the tools used by the authors of systematic reviews to assess the risk of bias of the primary studies included the review (Quadas-2,1 RoB-2,2 Newscastle-Otawa scale3…). There are also the tools intended for the readership, such as the user’s guides to the medical literature of the JAMA (Journal of the American Medical Association),4 the guidelines of the BMJ (British Medical Journal), based on the recommendations of the Evidence-Based Medicine Working Group, or the CASPe (Critical Appraisal Skills Programme Español) tools.5 The GRADE (Grading of Recommendations, Assessment, Development, and Evaluations) approach goes a step further for, in addition to the assessment of the quality of the evidence, grading the strength of recommendations in the development of clinical practice guidelines, systematic reviews or assessment of health care technologies.6
When it comes to reporting guidelines, which in the Spanish version of this article we called “guías para la elaboración de manuscritos” (based on their definition),7 their main goal is to guide authors in providing the best possible description of the methods used in each of the phases of research accurately and transparently. They are meant for manuscript authors, to be applied during the drafting of the paper, and also for journal editors and reviewers. It would be fair to say that the intent of these tools is to promote excellence in scientific reporting, regardless of the quality of the study. There can be studies that have an optimal design, implementation and analysis of results, but which are poorly reported because the published content is missing key information regarding the methods and results. This can create problems at a later stage in the assessment of study bias or applicability and in the inclusion of the study in a systematic review, all of which could have been easily prevented with a more detailed description.
The first reporting guideline, which is also the best known today, was the CONSORT Statement8 (CONsolidated Standards Of Reporting Trials, focusing on randomised trials). It was followed by others such as STARD9 (Standards for Reporting Diagnostic accuracy), PRISMA10 (Preferred Reporting Items for Systematic reviews and Meta-Analyses), STROBE11 (Strengthening the Reporting of OBservational studies in Epidemiology)… and extensions of these guidelines focusing on specific aspects within the type of study addressed by the guideline.
The proliferation of this type of guidelines spurred yet another initiative, EQUATOR (Enhancing the QUAlity and Transparency Of health Research, https://www.equator-network.org/).12 Active since 2006, its mission is to collect all valid reporting guidelines for any care setting, promote their application and assess the scientific literature on the subject (Table 1). It is the first attempt to coordinate efforts to address inadequate publication practices at a global scale. It encompasses researchers, medical journal editors and reviewers, guideline developers, research funding groups and other collaborators interested in improving the quality of scientific research and publications. In addition, the “Toolkit” section of the website13 offers practical help and resources to support professionals in different activities.
Reporting guidelines for main study types.
| Randomised trials | CONSORT | Extensions |
| Observational studies | STROBE | Extensions |
| Systematic reviews | PRISMA | Extensions |
| Study protocols | SPIRIT | PRISMA-P |
| Diagnostic/prognostic studies | STARD | TRIPOD |
| Case reports | CARE | Extensions |
| Clinical practice guidelines | AGREE | RIGHT |
| Nonrandomized controlled trials | TREND | |
| Qualitative research | SRQR | COREQ |
| Animal pre-clinical studies | ARRIVE | |
| Quality improvement studies | SQUIRE | Extensions |
| Economic evaluations | CHEERS |
Adapted from: https://www.equator-network.org/.
In this article, we present the guidelines that we consider most relevant based on the type of study and the frequency of their use for authors who seek to publish articles, peer reviewers and readers of scientific publications overall.
What should be included in a randomised trial report?Well-designed and implemented randomised controlled trials (RCTs) are the gold standard for producing primary evidence to guide clinical decision-making regarding health care interventions.
Alarmed at the overwhelming evidence that the quality of RCT reporting tended to be far from optimal, a group of researchers and editors developed the Consolidated Standards of Reporting Trials (CONSORT) statement to improve the quality of reporting of RCTs for publication. The first version of the statement was published in 1996. Two revisions have been published since, the CONSORT 2001 and the CONSORT 2010 versions, with additional publication of several extensions. In 2022, very interesting extensions were published that delved in more detail on the reporting of intervention outcomes (The CONSORT-Outcomes 2022 Statement)14 and the adverse events (CONSORT Harms 2022 Statement).15
The CONSORT 2010 Statement, checklist, participant flow diagram and the indispensable explanation paper (CONSORT 2010 Explanation and Elaboration) are available at the EQUATOR8 website.16 The checklist comprises 25 items (some with subitems) that, due to their significant relevance, should always be included in any article reporting on a RCT. They are structured into 6 sections: Title and abstract, Introduction, Methods, Results, Discussion and Other information. The CONSORT Outcomes 2022 extension adds 17 more subitems to the CONSORT 2010 checklist, for greater detail in the Results (item 6a), Sample size (item 7a), Statistical methods (item 12a) and Ancillary analyses (item 18) sections.
Table 2 presents the CONSORT 2010 checklist, the Spanish translation of which is available in the Spanish version of this article.
CONSORT 2010 checklist.
| Section/Topic | Item no. | Checklist item |
|---|---|---|
| Title and abstract | 1a | Identification as a randomised trial in the title |
| 1b | Structured summary of trial design, methods, results, and conclusions (for specific guidance see CONSORT for abstracts) | |
| Introduction | ||
| Background and objectives | 2a | Scientific background and explanation of rationale |
| 2b | Specific objectives or hypotheses | |
| Methods | ||
| Trial design | 3a | Description of trial design (such as parallel, factorial) including allocation ratio |
| 3b | Important changes to methods after trial commencement (such as eligibility criteria), with reasons | |
| Participants | 4a | Eligibility criteria for participants |
| 4b | Settings and locations where the data were collected | |
| Interventions | 5 | The interventions for each group with sufficient details to allow replication, including how and when they were actually administered |
| Results | 6a | Completely defined pre-specified primary and secondary outcome measures, including how and when they were assessed |
| 6b | Any changes to trial outcomes after the trial commenced, with reasons | |
| Sample size | 7a | How sample size was determined |
| 7b | When applicable, explanation of any interim analyses and stopping guidelines | |
| Randomisation | ||
| Sequence generation | 8a | Method used to generate the random allocation sequence |
| 8b | Type of randomisation; details of any restriction (such as blocking and block size) | |
| Allocation concealment mechanism | 9 | Mechanism used to implement the random allocation sequence (such as sequentially numbered containers), describing any steps taken to conceal the sequence until interventions were assigned |
| Implementation | 10 | Who generated the random allocation sequence, who enrolled participants, and who assigned participants to interventions |
| Blinding | 11a | If done, who was blinded after assignment to interventions (for example, participants, care providers, those assessing outcomes) and how |
| 11b | If relevant, description of the similarity of interventions | |
| Statistical methods | 12a | Statistical methods used to compare groups for primary and secondary outcomes |
| 12b | Methods for additional analyses, such as subgroup analyses and adjusted analyses | |
| Results | ||
| Participant flow (a diagram is strongly recommended) | 13a | For each group, the numbers of participants who were randomly assigned, received intended treatment, and were analysed for the primary outcome |
| 13b | For each group, losses and exclusions after randomisation, together with reasons | |
| Recruitment | 14a | Dates defining the periods of recruitment and follow-up |
| 14b | Why the trial ended or was stopped | |
| Baseline data | 15 | A table showing baseline demographic and clinical characteristics for each group |
| Numbers analysed | 16 | For each group, number of participants (denominator) included in each analysis and whether the analysis was by original assigned groups |
| Outcomes and estimation | 17a | For each primary and secondary outcome, results for each group, and the estimated effect size and its precision (such as 95% confidence interval) |
| 17b | For binary outcomes, presentation of both absolute and relative effect sizes is recommended | |
| Ancillary analyses | 18 | Results of any other analyses performed, including subgroup analyses and adjusted analyses, distinguishing pre-specified from exploratory |
| Harms | 19 | All important harms or unintended effects in each group (for specific guidance see CONSORT for harms) |
| Discussion | ||
| Limitations | 20 | Trial limitations, addressing sources of potential bias, imprecision, and, if relevant, multiplicity of analyses |
| Generalisability | 21 | Generalisability (external validity, applicability) of the trial findings |
| Interpretation | 22 | Interpretation consistent with results, balancing benefits and harms, and considering other relevant evidence |
| Other information | ||
| Registration | 23 | Registration number and name of trial registry |
| Protocol | 24 | Where the full trial protocol can be accessed, if available |
| Funding | 25 | Sources of funding and other support (such as supply of drugs), role of funders |
Source/citation in spanish version: Cobos-Carbó A, Augustovski F. Declaración CONSORT 2010: actualización de la lista de comprobación para informar ensayos clínicos aleatorizados de grupos paralelos. Med Clin (Barc). 2011;137:213-5.
Although a randomised controlled trial is the best possible method to demonstrate the efficacy of an intervention, it is not always feasible. We often encounter articles in the scientific literature reporting results obtained in nonrandomised clinical trials. These studies are conducted when carrying out a RCT would not be ethical, when the objective of the study is to analyse effectiveness in real-world clinical practice or the cost-effectiveness of a health care intervention or when the causal chain of the effect of the intervention is highly complex. Under these circumstances, it is appropriate to conduct nonrandomised trials, whose value has yet to be fully recognised. To be sure, RCTs offer the significant advantage of controlling biases or systematic errors that were not taken into account in the study design due to lack of previous awareness, but the lack of randomisation in nonrandomised trials can be compensated with Bayesian methods, used to quantify the degree to which the findings could be explained by potential selection biases.17
Many of the decisions made in our daily clinical practice or in public health policy are based on evidence from nonrandomised trials. Therefore, transparency, thoroughness and clarity are essential in reporting these studies. The Transparent Reporting of Evaluation with Non Randomized Designs (TREND) was developed to provide guidance on the subject.18,19
The first version of TREND was published in 2004 in the American Journal of Public Health17 on the initiative of the Center for Disease Control and Prevention (CDC)20 and several journal editors and representatives. The purpose was to provide recommendations for authors, reviewers and editors on the information that should be included in the reporting of nonrandomised studies. The TREND checklist comprises 22 items structured into 5 sections: Title, Introduction, Methods, Results and Discussion. Table 3 presents the most recent update of the checklist.
TREND checklist.
| Paper Section/Topic | Item no. | Descriptor |
|---|---|---|
| Title and Abstract | ||
| Title and Abstract | 1 | Information on how unit were allocated to interventions |
| Structured abstract recommended | ||
| Information on target population or study sample | ||
| Introduction | ||
| Background | 2 | Scientific background and explanation of rationale |
| Theories used in designing behavioural interventions | ||
| Methods | ||
| Participants | 3 | Eligibility criteria for participants, including criteria at different levels in recruitment/sampling plan (eg, cities, clinics, subjects) |
| Method of recruitment (eg, referral, self-selection), including the sampling method if a systematic sampling plan was implemented | ||
| Recruitment setting | ||
| Settings and locations where the data were collected | ||
| Interventions | 4 | Details of the interventions intended for each study condition and how and when they were actually administered, specifically including: |
| • Content: what was given? | ||
| • Delivery method: how was the content given? | ||
| • Unit of delivery: how were the subjects grouped during delivery? | ||
| • Deliverer: who delivered the intervention? | ||
| • Setting: where was the intervention delivered? | ||
| • Exposure quantity and duration: how many sessions or episodes or events were intended to be delivered? How long were they intended to last? | ||
| • Time span: how long was it intended to take to deliver the intervention to each unit? | ||
| • Activities to increase compliance or adherence (eg, incentives) | ||
| Objectives | 5 | Specific objectives and hypotheses |
| Outcomes | 6 | Clearly defined primary and secondary outcome measures |
| Methods used to collect data and any methods used to enhance the quality of measurements | ||
| Information on validated instruments such as psychometric and biometric properties | ||
| Sample size | 7 | How sample size was determined and, when applicable, explanation of any interim analyses and stopping rules |
| Assignment method | 8 | Unit of assignment (the unit being assigned to study condition, eg, individual, group, community) |
| Method used to assign units to study conditions, including details of any restriction (eg, blocking, stratification, minimization) | ||
| Inclusion of aspects employed to help minimize potential bias induced due to non-randomization (eg, matching) | ||
| Blinding (masking) | 9 | Whether or not participants, those administering the interventions, and those assessing the outcomes were blinded to study condition assignment; if so, statement regarding how the blinding was accomplished and how it was assessed. |
| Unit of analysis | 10 | Description of the smallest unit that is being analysed to assess intervention effects (eg, individual, group, or community) |
| If the unit of analysis differs from the unit of assignment, the analytical method used to account for this (eg, adjusting the standard error estimates by the design effect or using multilevel analysis) | ||
| Statistical methods | 11 | Statistical methods used to compare study groups for primary methods outcome(s), including complex methods of correlated data |
| Statistical methods used for additional analyses, such as a subgroup analyses and adjusted analysis | ||
| Methods for imputing missing data, if used | ||
| Statistical software or programs used | ||
| Results | ||
| Participant flow | 12 | Flow of participants through each stage of the study: enrolment, assignment, allocation, and intervention exposure, follow-up, analysis (a diagram is strongly recommended) |
| • Enrolment: the numbers of participants screened for eligibility, found to be eligible or not eligible, declined to be enrolled, and enrolled in the study | ||
| • Assignment: the numbers of participants assigned to a study condition | ||
| • Allocation and intervention exposure: the number of participants assigned to each study condition and the number of participants who received each intervention | ||
| • Follow-up: the number of participants who completed the follow-up or did not complete the follow-up (i.e., lost to follow-up), by study condition | ||
| • Analysis: the number of participants included in or excluded from the main analysis, by study condition | ||
| Description of protocol deviations from study as planned, along with reasons | ||
| Recruitment | 13 | Dates defining the periods of recruitment and follow-up |
| Baseline data | 14 | Baseline demographic and clinical characteristics of participants in each study condition |
| Baseline characteristics for each study condition relevant to specific disease prevention research | ||
| Baseline comparisons of those lost to follow-up and those retained, overall and by study condition | ||
| Comparison between study population at baseline and target population of interest | ||
| Baseline equivalence | 15 | Data on study group equivalence at baseline and statistical methods used to control for baseline differences |
| Numbers analysed | 16 | Number of participants (denominator) included in each analysis for each study condition, particularly when the denominators change for different outcomes; statement of the results in absolute numbers when feasible |
| Indication of whether the analysis strategy was “intention to treat” or, if not, description of how non-compliers were treated in the analyses | ||
| Outcomes and estimation | 17 | For each primary and secondary outcome, a summary of results for each estimation study condition, and the estimated effect size and a confidence interval to indicate the precision |
| Inclusion of null and negative findings | ||
| Inclusion of results from testing pre-specified causal pathways through which the intervention was intended to operate, if any | ||
| Ancillary analyses | 18 | Summary of other analyses performed, including subgroup or restricted analyses, indicating which are pre-specified or exploratory |
| Adverse events | 19 | Summary of all important adverse events or unintended effects in each study condition (including summary measures, effect size estimates, and confidence intervals) |
| Discussion | ||
| Interpretation | 20 | Interpretation of the results, taking into account study hypotheses, sources of potential bias, imprecision of measures, multiplicative analyses, and other limitations or weaknesses of the study |
| Discussion of results taking into account the mechanism by which the intervention was intended to work (causal pathways) or alternative mechanisms or explanations | ||
| Discussion of the success of and barriers to implementing the intervention, fidelity of implementation | ||
| Discussion of research, programmatic, or policy implications | ||
| Generalizability | 21 | Generalizability (external validity) of the trial findings, taking into account the study population, the characteristics of the intervention, length of follow-up, incentives, compliance rates, specific sites/settings involved in the study, and other contextual issues |
| Overall evidence | 22 | General interpretation of the results in the context of current evidence and current theory |
Source: TREND Statement checklist (pdf). Available at: https://www.cdc.gov/trendstatement/pdf/trendstatement_trend_checklist.pdf.
TREND is considered a complement to CONSORT (the guideline for randomised clinical trial reporting), and the two checklists have some overlapping elements and some distinct elements specific to each of them. The information presented in this section was updated by the CDC in September 2018 and by EQUATOR21 in November 2021.
What should be included in an observational study report?One of the proposed definitions for epidemiology is “study of distribution and determinants of health-related states among specified populations and the application of that study to the control of health problems”. The aim of epidemiological studies is to answer questions regarding the frequency and trends in a given disease, which preventive interventions are most effective or the benefits of modifying certain diagnostic or therapeutic approaches, among others.
To answer these questions, the field of epidemiology has developed a methodology of its own that is based on observation. Thus, the design of an epidemiological study depends on the question that researchers ask regarding the population and the topic under study (disease, risk or protective factors, health care interventions, etc).22 For instance, the most appropriate design to study the prognosis of a condition would be a longitudinal observational study, while in aetiological research it would be a cohort or a case-control study.
Observational studies, by design, are intrinsically likely to suffer from systematic errors and biases that affect their internal validity, which in turn (in addition to other factors) may affect the external validity or generalizability of their results. Furthermore, articles reporting on observational studies frequently fail to present sufficiently clear and detailed information on the conducted research, which hampers the assessment of the evidence.
The Strengthening the Reporting of Observational Studies in Epidemiology (STROBE) Statement was developed with the aim of improving the reporting of observational studies, issuing a series of recommendations on the information that should be provided in a complete and accurate report of an observational study. The STROBE Statement was published in 2007 and it is available at the EQUATOR website11 or its own site.23
It provides checklists for the main study designs of analytical epidemiology: cohort, case–control, and cross-sectional studies. A combined checklist has also been published that can be used to any of the three designs (Table 4),24 as well as an article explaining each item in detail, offering a rationale and published examples (STROBE: explanation and elaboration).25
STROBE checklist.
| Item no. | Recommendation | |
|---|---|---|
| Title and abstract | 1 | (a) Indicate the study’s design with a commonly used term in the title or the abstract |
| (b) Provide in the abstract an informative and balanced summary of what was done and what was found | ||
| Introduction | ||
| Background/rationale | 2 | Explain the scientific background and rationale for the investigation being reported |
| Objectives | 3 | State specific objectives, including any prespecified hypotheses |
| Methods | ||
| Study design | 4 | Present key elements of study design early in the paper |
| Setting | 5 | Describe the setting, locations, and relevant dates, including periods of recruitment, exposure, follow-up, and data collection |
| Participants | 6 | (a) Cohort study—Give the eligibility criteria, and the sources and methods of selection of participants. Describe methods of follow-up |
| Case-control study—Give the eligibility criteria, and the sources and methods of case ascertainment and control selection. Give the rationale for the choice of cases and controls | ||
| Cross-sectional study—Give the eligibility criteria, and the sources and methods of selection of participants | ||
| (b) Cohort study—For matched studies, give matching criteria and number of exposed and unexposed | ||
| Case-control study—For matched studies, give matching criteria and the number of controls per case | ||
| Variables | 7 | Clearly define all outcomes, exposures, predictors, potential confounders, and effect modifiers. Give diagnostic criteria, if applicable |
| Data sources/measurement | 8a | For each variable of interest, give sources of data and details of methods of assessment (measurement). Describe comparability of assessment methods if there is more than one group |
| Bias | 9 | Describe any efforts to address potential sources of bias |
| Study size | 10 | Explain how the study size was arrived at |
| Quantitative variables | 11 | Explain how quantitative variables were handled in the analyses. If applicable, describe which groupings were chosen and why |
| Statistical methods | 12 | (a) Describe all statistical methods, including those used to control for confounding |
| (b) Describe any methods used to examine subgroups and interactions | ||
| (c) Explain how missing data were addressed | ||
| (d) Cohort study—If applicable, explain how loss to follow-up was addressed | ||
| Case-control study—If applicable, explain how matching of cases and controls was addressed | ||
| Cross-sectional study—If applicable, describe analytical methods taking account of sampling strategy | ||
| (e) Describe any sensitivity analyses | ||
| Results | ||
| Participants | 13a | (a) Report numbers of individuals at each stage of study—eg numbers potentially eligible, examined for eligibility, confirmed eligible, included in the study, completing follow-up, and analysed |
| (b) Give reasons for non-participation at each stage | ||
| (c) Consider use of a flow diagram | ||
| Descriptive data | 14a | (a) Give characteristics of study participants (eg demographic, clinical, social) and information on exposures and potential confounders |
| (b) Indicate number of participants with missing data for each variable of interest | ||
| (c) Cohort study—Summarise follow-up time (eg, average and total amount) | ||
| Outcome data | 15a | Cohort study—Report numbers of outcome events or summary measures over time |
| Case-control study—Report numbers in each exposure category, or summary measures of exposure | ||
| Cross-sectional study—Report numbers of outcome events or summary measures | ||
| Main results | 16 | (a) Give unadjusted estimates and, if applicable, confounder-adjusted estimates and their precision (eg, 95% confidence interval). Make clear which confounders were adjusted for and why they were included |
| (b) Report category boundaries when continuous variables were categorized | ||
| (c) If relevant, consider translating estimates of relative risk into absolute risk for a meaningful time period | ||
| Other analyses | 17 | Report other analyses done—eg analyses of subgroups and interactions, and sensitivity analyses |
| Discussion | ||
| Key results | 18 | Summarise key results with reference to study objectives |
| Limitations | 19 | Discuss limitations of the study, taking into account sources of potential bias or imprecision. Discuss both direction and magnitude of any potential bias |
| Interpretation | 20 | Give a cautious overall interpretation of results considering objectives, limitations, multiplicity of analyses, results from similar studies, and other relevant evidence |
| Generalizability | 21 | Discuss the generalisability (external validity) of the study results |
| Other information | ||
| Funding | 22 | Give the source of funding and the role of the funders for the present study and, if applicable, for the original study on which the present article is based |
Source: Von Elm E, Altman DG, Egger M, Pocock S, Gotzsche PC, Vandenvroucke JP. Declaración de la iniciativa STROBE (Strengthening the Reporting of Observational studies in Epidemiology): directrices para la comunicación de estudios observacionales. Gac Sanit. 2008;22:144-50.
Each of the checklists comprises 22 items structured in 6 sections: Title and abstract, Introduction, Methods, Results, Discussion and Other information (Funding). In the combined checklist, 18 items are common to all designs and 4 are specific to each design.
What should be included in a diagnostic study report?Reports of diagnostic accuracy studies should present all the key information readers may need be able to appraise the importance and credibility of their conclusions, in addition to a complete and rigorous description of their results. Only when all the necessary information is provided in the publication is it possible to assess the potential biases of the study and its generalizability at a later time. Yet, multiple reviews have evinced that diagnostic accuracy study reports frequently fail to report essential and adequate information on the selection of participants or the study design or the full results. In addition, the conclusions regarding diagnostic accuracy may be overly optimistic.26
In 2003, the Standards for Reporting Diagnostic Accuracy (STARD) statement was published following the example of the CONSORT statement. This guideline was published in prominent general and specialised medical journals. It included a 25-item checklist, a flow diagram and an explanatory document clarifying the meaning and rationale of each of the items and a short summary of the available evidence they were based on.27 Its publication prompted several editorials recommending its acceptance by journal editors and review committees.
In 2015, the statement was updated to include new evidence on the sources of bias and variability and to facilitate its use.
Table 5 presents the 30 items of the STARD 2015 checklist, of which the translation to Spanish is available in the Spanish version of this article. The items are structured into the usual sections found in original articles: Introduction, Methods, Results and Discussion, in addition to one section at the start (Title and abstract) and another at the end (Other information).
STARD 2015 checklist.
| Section and topic | No. | Item |
|---|---|---|
| Title or abstract | ||
| 1 | Identification as a study of diagnostic accuracy using at least one measure of accuracy (such as sensitivity, specificity, predictive values, or AUC) | |
| Abstract | ||
| 2 | Structured summary of study design, methods, results, and conclusions (for specific guidance, see STARD for Abstracts) | |
| Introduction | ||
| 3 | Scientific and clinical background, including the intended use and clinical role of the index test | |
| 4 | Study objectives and hypotheses | |
| Methods | ||
| Study design | 5 | Whether data collection was planned before the index test and reference standard were performed (prospective study) or after (retrospective study) |
| Participants | 6 | Eligibility criteria |
| 7 | On what basis potentially eligible participants were identified (such as symptoms, results from previous tests, inclusion in registry) | |
| 8 | Where and when potentially eligible participants were identified (setting, location and dates) | |
| 9 | Whether participants formed a consecutive, random or convenience series | |
| Test methods | 10a | Index test, in sufficient detail to allow replication |
| 10b | Reference standard, in sufficient detail to allow replication | |
| 11 | Rationale for choosing the reference standard (if alternatives exist) | |
| 12a | Definition of and rationale for test positivity cut-offs or result categories of the index test, distinguishing pre-specified from exploratory | |
| 12b | Definition of and rationale for test positivity cut-offs or result categories of the reference standard, distinguishing pre-specified from exploratory | |
| 13a | Whether clinical information and reference standard results were available to the performers/readers of the index test | |
| 13b | Whether clinical information and index test results were available to the assessors of the reference standard | |
| Analysis | 14 | Methods for estimating or comparing measures of diagnostic accuracy |
| 15 | How indeterminate index test or reference standard results were handled | |
| 16 | How missing data on the index test and reference standard were handled | |
| 17 | Any analyses of variability in diagnostic accuracy, distinguishing pre-specified from exploratory | |
| 18 | Intended sample size and how it was determined | |
| Results | ||
| Participants | 19 | Flow of participants, using a diagram |
| 20 | Baseline demographic and clinical characteristics of participants | |
| 21a | Distribution of severity of disease in those with the target condition | |
| 21b | Distribution of alternative diagnoses in those without the target condition | |
| 22 | Time interval and any clinical interventions between index test and reference standard | |
| Test results | 23 | Cross tabulation of the index test results (or their distribution) by the results of the reference standard |
| 24 | Estimates of diagnostic accuracy and their precision (such as 95% confidence intervals) | |
| 25 | Any adverse events from performing the index test or the reference standard | |
| Discussion | ||
| 26 | Study limitations, including sources of potential bias, statistical uncertainty, and generalisability | |
| 27 | Implications for practice, including the intended use and clinical role of the index test | |
| Other information | ||
| 28 | Registration number and name of registry | |
| 29 | Where the full study protocol can be accessed | |
| 30 | Sources of funding and other support; role of funders | |
Source: STARD 2015 checklist. Available at: https://www.equator-network.org/wp-content/uploads/2015/03/STARD-2015-checklist.pdf.
Among the explanation and elaboration papers of the STARD 2015 statement, available at the EQUATOR website,12 the reader can find the original article by Cohen et al.28 with commented examples and a detailed explanation of each of the 30 items in the checklist. This information is provided to facilitate the writing of diagnostic accuracy reports and ensure they include all the relevant information. It is also meant to help journal reviewers and editors as well as readers to ensure that submitted and published articles are sufficiently detailed.
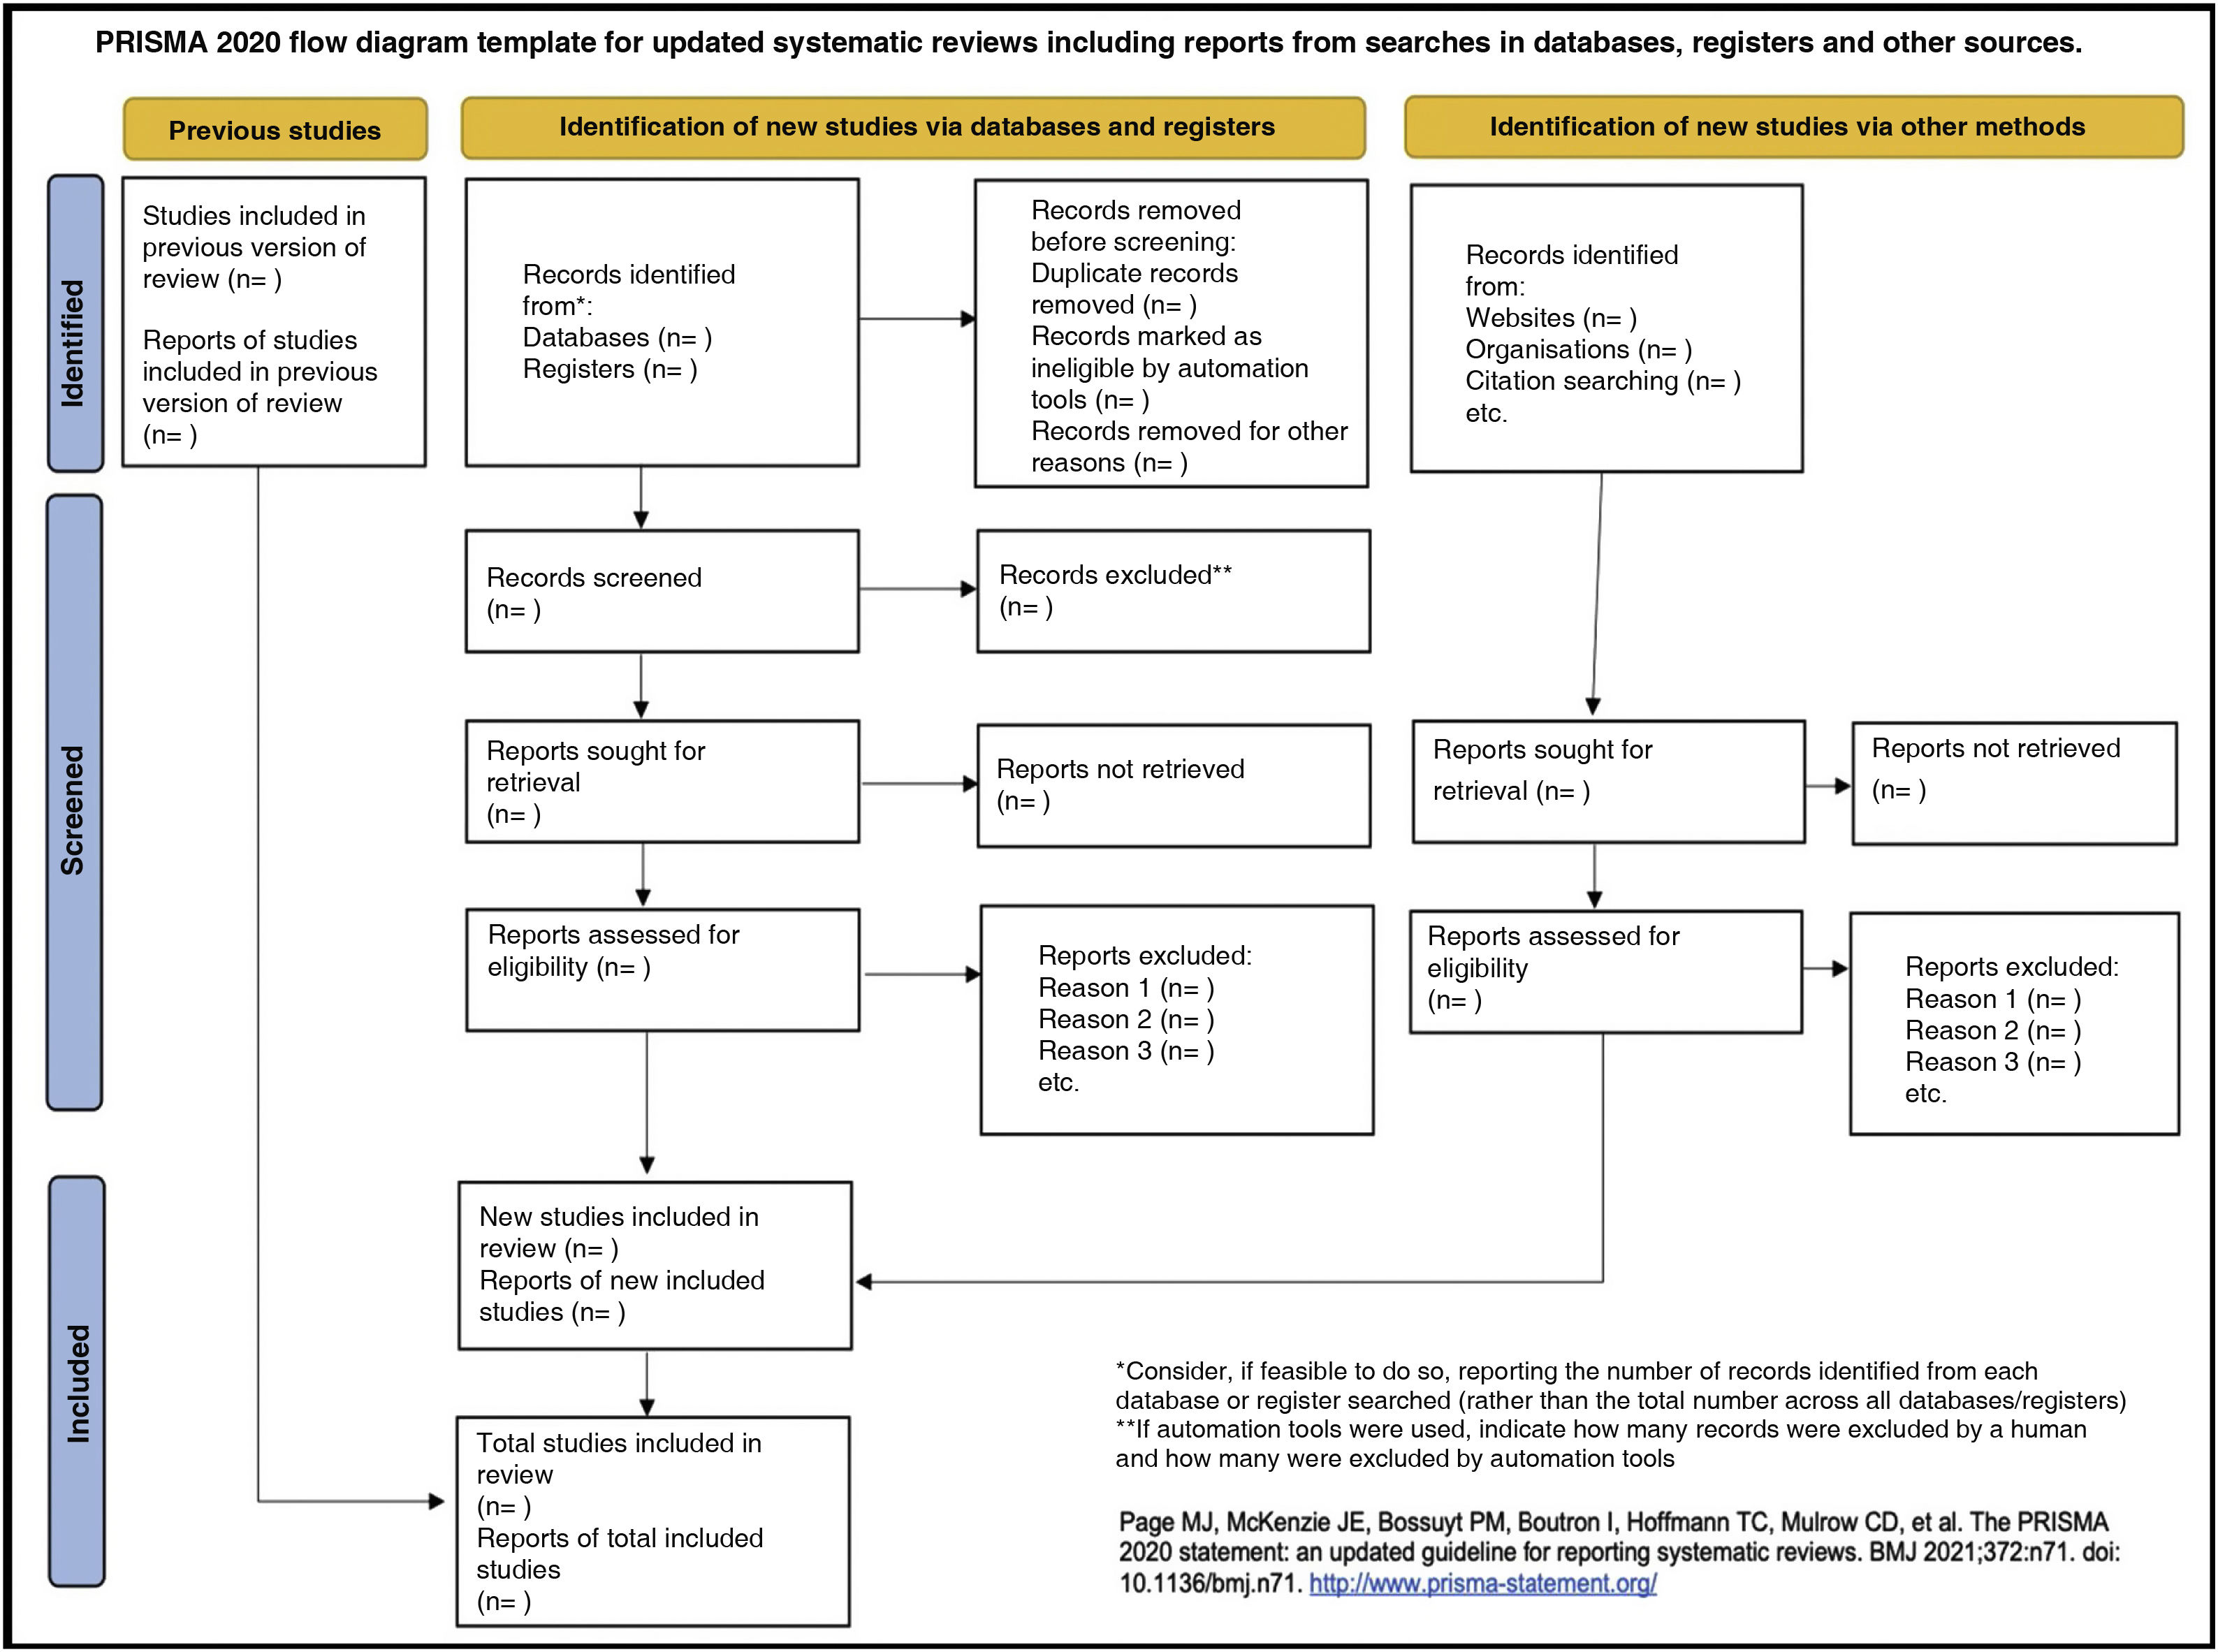
What should be included in a systematic review article?The systematic review (SR) and meta-analysis is a type of study that synthesises the available evidence on a specific topic. The methodology used in this type of studies follows a clear, standardised and reproducible protocol to ensure the quality, consistency and transparency of the review process.29 When reporting results, it is very important to describe the development process in full and in detail, including why it was done, how and what was found. The PRISMA 2020 Statement provides recommendations to ensure that this happens, reflecting the most recent advances in methods to identify, select, appraise, and synthesise studies eligible for inclusion in systematic reviews.
All the information on PRISMA 2020 can be found in its own website,30 including translations to Spanish of some of the documents. Both its website and the EQUATOR website31 offer access to the PRISMA 2020 Statement, the 27-item checklist, the flow diagram template and, for those interested in more in-depth information, a more thorough and detailed version of the checklist and the PRISMA 2020 explanation and elaboration paper.32
The 27 items of the verification checklists are structured into 7 sections: Title, Abstract, Introduction, Methods, Results, Discussion and Other information (including financial support).
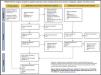
Table 6 presents the PRISMA 2020 checklist33 and Fig. 1, a template PRISMA flow diagram.
PRISMA 2020 checklist.
| Section and topic | Item no. | Checklist item |
|---|---|---|
| Title | ||
| Title | 1 | Identify the report as a systematic review. |
| Abstract | ||
| Structured abstract | 2 | See the PRISMA 2020 for Abstracts checklist. |
| Introduction | ||
| Rationale | 3 | Describe the rationale for the review in the context of existing knowledge. |
| Objectives | 4 | Provide an explicit statement of the objective(s) or question(s) the review addresses. |
| Methods | ||
| Eligibility criteria | 5 | Specify the inclusion and exclusion criteria for the review and how studies were grouped for the syntheses. |
| Information sources | 6 | Specify all databases, registers, websites, organisations, reference lists and other sources searched or consulted to identify studies. Specify the date when each source was last searched or consulted. |
| Search strategy | 7 | Present the full search strategies for all databases, registers and websites, including any filters and limits used. |
| Selection process | 8 | Specify the methods used to decide whether a study met the inclusion criteria of the review, including how many reviewers screened each record and each report retrieved, whether they worked independently, and if applicable, details of automation tools used in the process. |
| Data collection process | 9 | Specify the methods used to collect data from reports, including how many reviewers collected data from each report, whether they worked independently, any processes for obtaining or confirming data from study investigators, and if applicable, details of automation tools used in the process. |
| Data items | 10a | List and define all outcomes for which data were sought. Specify whether all results that were compatible with each outcome domain in each study were sought (eg for all measures, time points, analyses), and if not, the methods used to decide which results to collect. |
| 10b | List and define all other variables for which data were sought (eg participant and intervention characteristics, funding sources). Describe any assumptions made about any missing or unclear information. | |
| Study risk of bias assessment | 11 | Specify the methods used to assess risk of bias in the included studies, including details of the tool(s) used, how many reviewers assessed each study and whether they worked independently, and if applicable, details of automation tools used in the process. |
| Effect measures | 12 | Specify for each outcome the effect measure(s) (eg, risk ratio, mean difference) used in the synthesis or presentation of results. |
| Synthesis methods | 13a | Describe the processes used to decide which studies were eligible for each synthesis (eg, tabulating the study intervention characteristics and comparing against the planned groups for each synthesis (item #5)). |
| 13b | Describe any methods required to prepare the data for presentation or synthesis, such as handling of missing summary statistics, or data conversions. | |
| 13c | Describe any methods used to tabulate or visually display results of individual studies and syntheses. | |
| 13d | Describe any methods used to synthesize results and provide a rationale for the choice(s). If meta-analysis was performed, describe the model(s), method(s) to identify the presence and extent of statistical heterogeneity, and software package(s) used. | |
| 13e | Describe any methods used to explore possible causes of heterogeneity among study results (eg, subgroup analysis, meta-regression). | |
| 13f | Describe any sensitivity analyses conducted to assess robustness of the synthesized results. | |
| Reporting bias assessment | 14 | Describe any methods used to assess risk of bias due to missing results in a synthesis (arising from reporting biases). |
| Certainty assessment | 15 | Describe any methods used to assess certainty (or confidence) in the body of evidence for an outcome. |
| Results | ||
| Study selection | 16a | Describe the results of the search and selection process, from the number of records identified in the search to the number of studies included in the review, ideally using a flow diagram. |
| 16b | Cite studies that might appear to meet the inclusion criteria, but which were excluded, and explain why they were excluded. | |
| Study characteristics | 17 | Cite each included study and present its characteristics. |
| Risk of bias in studies | 18 | Present assessments of risk of bias for each included study. |
| Results of individual studies | 19 | For all outcomes, present, for each study: (a) summary statistics for each group (where appropriate) and (b) an effect estimate and its precision (eg, confidence/credible interval), ideally using structured tables or plots. |
| Results of syntheses | 20a | For each synthesis, briefly summarise the characteristics and risk of bias among contributing studies. |
| 20b | Present results of all statistical syntheses conducted. If meta-analysis was done, present for each the summary estimate and its precision (eg confidence/credible interval) and measures of statistical heterogeneity. If comparing groups, describe the direction of the effect. | |
| 20c | Present results of all investigations of possible causes of heterogeneity among study results. | |
| 20d | Present results of all sensitivity analyses conducted to assess the robustness of the synthesized results. | |
| Reporting biases | 21 | Present assessments of risk of bias due to missing results (arising from reporting biases) for each synthesis assessed. |
| Certainty of evidence | 22 | Present assessments of certainty (or confidence) in the body of evidence for each outcome assessed. |
| Discussion | ||
| Discussion | 23a | Provide a general interpretation of the results in the context of other evidence. |
| 23b | Discuss any limitations of the evidence included in the review. | |
| 23c | Discuss any limitations of the review processes used. | |
| 23d | Discuss implications of the results for practice, policy, and future research. | |
| Other information | ||
| Registration and protocol | 24a | Provide registration information for the review, including register name and registration number, or state that the review was not registered. |
| 24b | Indicate where the review protocol can be accessed, or state that a protocol was not prepared. | |
| 24c | Describe and explain any amendments to information provided at registration or in the protocol. | |
| Support | 25 | Describe sources of financial or non-financial support for the review, and the role of the funders or sponsors in the review. |
| Competing interests | 26 | Declare any competing interests of review authors. |
| Availability of data, code and other materials | 27 | Report which of the following are publicly available and where they can be found: template data collection forms; data extracted from included studies; data used for all analyses; analytic code; any other materials used in the review. |
Source: Page MJ, McKenzie JE, Bossuyt PM, Boutron I, Hoffmann TC, Mulrow CD, et al. Declaración PRISMA 2020: una guía actualizada para la publicación de revisiones sistemáticas. Rev Esp Cardiol. 2021;74:790-9.
The process of publishing a scientific paper culminates when it reaches the target readership. Readers, however, should not be mere uncritical recipients of the information at their disposal. If the article has been written following the recommendations of the applicable reporting guideline, the reader will have sufficient information for, upon reading it critically, appraise the potential for bias in the evidence and whether the results can be applied locally.
Multiple tools are available to support the critical appraisal of published reports. The Critical Appraisal Skills Programme (CASPe)5 offers workshops on critical appraisal skills and tools to aid critical appraisal in Spanish, available at the website https://redcaspe.org/materiales/. At this site, the reader can find checklists composed of relevant questions that can guide the reading of reports for most of the study designs addressed in this article. These questions have only 3 possible answers: “yes”, “no” and “can’t tell”. A “can’t tell” answer usually means that the necessary information to answer the question is not available in the report. In some instances, it is due to deficiencies in the study methodology, but in others the problem stems from deficient reporting. The widespread application of reporting guidelines would reduce uncertainty and facilitate the appraisal of research publications.
With this article, the Working Group of Evidence-Based Paediatrics encourages future authors to use reporting guidelines to report their findings in a complete and structured manner. This will facilitate the subsequent publishing process of the article in addition to its critical reading by the audience.
Conflicts of interestThe authors have no conflicts of interest to disclose.
