

Nutritional disorders in childhood may cause a decline in motor abilities and increased morbidity and mortality in adulthood.
ObjectiveTo assess the association between nutritional status and motor abilities.
Materials and methodsA cross-sectional study was performed that included 12,872 children aged between 6 and 18years who underwent a clinical evaluation and various physical tests.
ResultsAmong the children, 66% had a Tanner maturation stage 1 and 2, 6% were under-nourished, and 12.2% were at risk of overweight and obesity. The obese children had a decrease in aerobic power (in 2.72mlO2kg−1min−1; 95% CI: 1.89–3.56; P<.001), speed (0.14ms; 95% CI: 0.06–0.22; P<.001), explosive strength (0.10m; 95% CI: 0.06–0.13; P<.001), agility, strength endurance and balance. Under-nourished children showed a decrease in speed (0.13ms; 95% CI: 0.06–0.20; P<.001), explosive strength (0.04m; 95% CI: 0.01–0 07; P<.004), and strength endurance.
ConclusionsThere was an association between nutritional status and motor abilities in the children included in this study. Obese children showed the worst results in physical tests, and the under-nourished ones showed a decrease in speed, explosive strength and strength endurance.
Las alteraciones nutricionales en la niñez pueden producir un deterioro en las capacidades físicas y una mayor morbimortalidad en la vida adulta.
ObjetivoEvaluar la asociación entre el estado nutricional y las capacidades físicas
Materiales y métodosEstudio transversal que incluyó 12.872 niños, con edades entre 6 y 18 años, a quienes se les realizó una evaluación clínica y diferentes pruebas físicas.
ResultadosEntre los niños incluidos, el 66% tenían un estadio de maduración Tanner 1 y 2, el 6% presentó desnutrición y 12,2% estaban en riesgo de sobrepeso y obesidad. Los niños con obesidad presentaron una disminución en la potencia aeróbica (en 2,72mlO2kg−1min−1; IC 95%: 1,89-3,56; p<0,001), velocidad (0,14ms; IC 95%: 0,06-0,22; p<0,001), fuerza explosiva (0,10m; IC 95%: 0,06-0,13; p<0,001), agilidad, resistencia a la fuerza y equilibrio. Los niños con desnutrición presentaron disminución en la velocidad (0,13ms; IC 95%: 0,06-0,20; p<0,001), fuerza explosiva (0,04m; IC 95%: 0,01-0,07; p<0,004) y resistencia a la fuerza.
ConclusionesSe observó una asociación entre el estado nutricional y las capacidades físicas. Los niños con obesidad presentaron los peores resultados en las pruebas físicas, mientras que aquellos con desnutrición tuvieron una disminución en la velocidad, en la fuerza explosiva y en la resistencia a la fuerza.
Both nutritional deficiencies1 and the adoption of a modern lifestyle that mark a trend towards overweight and cardiovascular risk factors, with their inevitable consequences for morbidity and mortality,2 are common in developing countries.
Malnutrition is a frequent phenomenon and is the basic cause of undernutrition and obesity.3 There are 182.7 million children in the world with delayed growth secondary to severe nutritional deficiency4,5; this condition is related to higher mortality. The 2010 National Nutritional Situation Survey in Colombia (ENSIN) reported a figure of 10% in children and adolescents between the ages of 5 and 17.6
Although undernutrition remains a public health problem in developing countries,5 there has been an increase in the proportion of children with overweight and obesity in Latin America, due to the phenomenon of nutritional and lifestyle transition.7 Childhood obesity is a risk factor for type 2 diabetes mellitus and various chronic adult illnesses, such as cardiovascular disease, cancer and osteoarthritis.2,8
Some studies have reported a reduction in health-related physical ability and physical fitness in children with overweight and obesity.9 A decrease in peak oxygen uptake (VO2max) has been observed in obese individuals, related to a decline in functional ability and increased morbidity and mortality from cardiovascular causes.10 However, maintaining health-related physical fitness by participating in physical activity and exercise programmes lessens the risk of disease and injury.11
Various research studies have shown that schoolchildren have suffered a reduction in muscular strength, cardiorespiratory fitness and speed of movement in the last two decades.12,13 With the increase in overweight and obesity, as well as a decrease in physical fitness, the possibility arises of an association between nutritional status and health-related physical fitness in children. Some studies have reported a relationship between obesity and physical fitness in children in various population groups14,15; however, there are differences in social background, ethnicity and body composition that prevent us from extrapolating the results. Few research studies assessing this relationship have been carried out in Latin American populations.
Because undernutrition is still a public health problem in Colombia, which is undergoing a process of nutritional transition, it is important to assess the association between nutritional state, particularly undernutrition, and physical fitness, beyond the question of obesity. Information is currently limited, and no data are available from population samples of Latin American and Colombian children involved in physical activity programmes.
For this reason, the objective of this study was to assess whether there is an association between nutritional state and physical abilities in children between the ages of 6 and 18 enrolled in the Popular Sports Schools (EPDs) of the Sports and Recreation Institute (INDER) in Medellin (Colombia).
Materials and methodsA cross-sectional study was performed in 2008 that included 12,872 boys and girls aged between 6 and 18 participating regularly in physical activity, sport and recreation programmes, enrolled in the 48 EPDs of the INDER in Medellin (Colombia) and drawn from low and middle socioeconomic strata.
The children were assessed by physicians specialising in sports medicine, nutritionists, physiotherapists and physical training instructors, who had undergone training to standardise the technique.
The recommendations of the American College of Sports Medicine16,17 were taken into account when compiling the clinical history and performing the physical examination. The information was supplied by the parents and by the coordinator of the relevant EPD. Age was stratified into three groups, following the EPD classification: beginners (age 6–7.9), intermediate (age 8–9.9) and advanced (age 10–17.9).
The children were weighed using a Tanita® portable electronic scale, reference BF-679W, and their height was measured with a Seca® portable stadiometer, reference C-234. The technique recommended by the Canadian Society for Exercise Physiology was applied.18 Skinfold thickness measurements (subscapular and tricipital) were performed at the sites previously determined by the International Society for the Advancement of Kinanthropometry (ISAK) with a Slim-Guide® calibrated adipometer.18,19
Nutritional status was assessed on the basis of the indicators suggested by the World Health Organization (WHO). The United States Centers for Disease Control and Prevention (CDC) charts for 2000 were used as a reference standard for calculating the z-values and percentiles of the nutritional indicators.20 The procedure was carried out using the NutStat program contained in Epi Info 2000. The weight for age and sex and height for age and sex indicators were considered normal if they were within ±2 SD according to the z-score. According to the weight for age and sex indicator, underweight was defined as below −2 SD and overweight as above +2 SD. According to the height for age and sex indicator, delayed growth was defined as below −2 SD and tall as above +2 SD. The body mass index (BMI) for age and sex indicator was considered very low or thin if it fell below the 5th percentile, low between the 5th and below the 25th, normal between the 25th and below the 85th, at risk of overweight between the 85th and below the 95th and obese above the 95th percentile. To classify the body fat percentage the methodology proposed by Lohman was used.18,21 For boys a low body fat percentage was defined as less than 8%, optimal between 8% and <13%, moderately high between 13% and <16%, high between 16% and <20% and very high >20%. For girls a low body fat percentage was defined as less than 12%, optimal between 12% and <18%, moderately high between 18% and <21.6%, high between 21.6% and <26.4% and very high >26.4%.
To assess sexual maturation, graphics of the various stages of sexual maturation were used for self-assessment by each child. In order to avoid over- or under-assessment, tertiary sexual characteristics were assessed by a doctor.18 Posture and flexibility were assessed taking account of anatomical and physiological variations, according to age and sex.22
Aerobic power was measured with the Luc Leger test.23 Speed over 20m and agility were obtained using a standardised protocol, with a stopwatch and cones, to identify the distance to be covered in the shortest possible time.18,24 Agility was evaluated from a supine position and the time taken to cover a distance of 5m was determined.18,24
Explosive strength was quantified by measuring a standing long jump.18 Strength endurance was evaluated in children over the age of 10 on the basis of the number of press-ups and sit-ups the child completed in 30s.25 To assess balance the Romberg test was used; a standardised protocol was employed, and the child received instructions on how to adopt the appropriate position.24
In this study the principles of the Helsinki Declaration in its latest revision were taken into account.26
Statistical analysisThe Kolmogorov-Smirnov test was used to assess whether the data came from a population with normal distribution. For the description of the quantitative variables, mean and standard deviation were used. The proportion of individuals with nutritional disorders was calculated according to the various indicators and the association with age groups was evaluated by means of Pearson's χ2 test. An analysis of variance (ANOVA) was performed to compare physical abilities and stage of sexual maturation by sex and a weighted linear polynomial contrast was used to assess the trend.
To establish whether there were any differences in physical abilities between the nutritional status categories according to BMI for age and sex a multivariate analysis of covariance (ANCOVA) was used. Age was included as a covariate. In addition, the sex variable was taken into account as another factor and the Bonferroni correction for multiple comparisons was performed. In the whole sample physical abilities were compared, discriminated by sex, between the following BMI categories: normal and very low or thin; normal and obese. The marginal means and differences of means were estimated with their respective 95% confidence intervals. A statistical significance level of 5% was used for all the analyses and they were performed with the SPSS program, version 21.0.
ResultsFor the analysis 12,872 children were included, of whom 88.5% were enrolled at the EPD in the urban area and 65.2% were male. The average BMI was 18kg/m2±2.8 SD, the average body fat percentage was 18.3%±6.8 SD and the average age was 11.7±2.8 SD. According to the age range classification, 1167 (9%) belonged to the beginners group, 2597 (20.2%) to the intermediate group and 9108 (70.8%) to the advanced group.
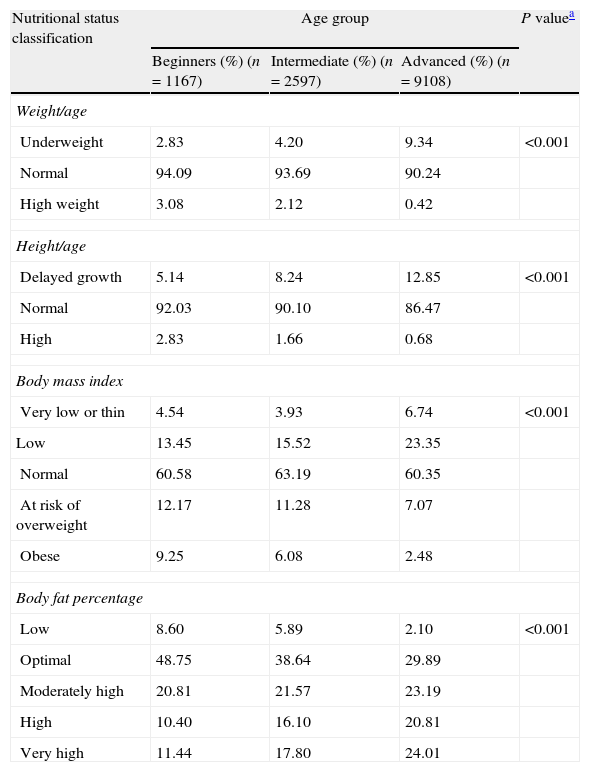
As regards the comparative stage of sexual maturation, 66% of the children were Tanner stage 1 or 2. In terms of nutritional status, 7.7% were underweight, 11.2% suffered from delayed growth, 6% had a BMI for age and sex rated as very low or thin, 12.2% were at risk of overweight and obesity and 40.5% had a body fat percentage rated as high or very high. An association was observed between the various nutritional state indicators and the age groups (Table 1).
Description of nutritional status by age group of children from the Popular Sports Schools of the Sports and Recreation Institute in Medellin (Colombia).
| Nutritional status classification | Age group | P valuea | ||
| Beginners (%) (n=1167) | Intermediate (%) (n=2597) | Advanced (%) (n=9108) | ||
| Weight/age | ||||
| Underweight | 2.83 | 4.20 | 9.34 | <0.001 |
| Normal | 94.09 | 93.69 | 90.24 | |
| High weight | 3.08 | 2.12 | 0.42 | |
| Height/age | ||||
| Delayed growth | 5.14 | 8.24 | 12.85 | <0.001 |
| Normal | 92.03 | 90.10 | 86.47 | |
| High | 2.83 | 1.66 | 0.68 | |
| Body mass index | ||||
| Very low or thin | 4.54 | 3.93 | 6.74 | <0.001 |
| Low | 13.45 | 15.52 | 23.35 | |
| Normal | 60.58 | 63.19 | 60.35 | |
| At risk of overweight | 12.17 | 11.28 | 7.07 | |
| Obese | 9.25 | 6.08 | 2.48 | |
| Body fat percentage | ||||
| Low | 8.60 | 5.89 | 2.10 | <0.001 |
| Optimal | 48.75 | 38.64 | 29.89 | |
| Moderately high | 20.81 | 21.57 | 23.19 | |
| High | 10.40 | 16.10 | 20.81 | |
| Very high | 11.44 | 17.80 | 24.01 | |
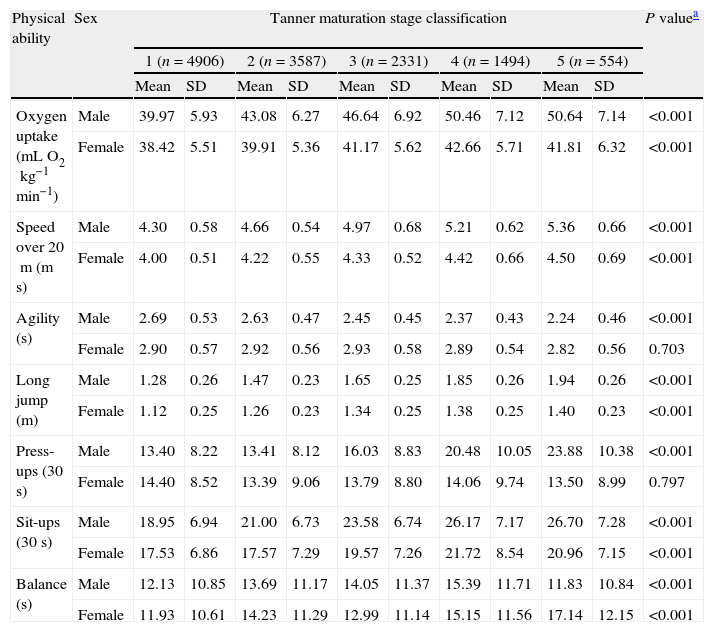
Most physical abilities showed an improvement as the sexual maturation stage increased, among both boys and girls (P for trend <0.001), with the exception of agility and press-ups in girls (P for trend 0.703 and 0.797, respectively) (Table 2).
Physical abilities by sexual maturation stage of children from the Popular Sports Schools of the Sports and Recreation Institute in Medellin (Colombia).
| Physical ability | Sex | Tanner maturation stage classification | P valuea | |||||||||
| 1 (n=4906) | 2 (n=3587) | 3 (n=2331) | 4 (n=1494) | 5 (n=554) | ||||||||
| Mean | SD | Mean | SD | Mean | SD | Mean | SD | Mean | SD | |||
| Oxygen uptake (mLO2kg−1min−1) | Male | 39.97 | 5.93 | 43.08 | 6.27 | 46.64 | 6.92 | 50.46 | 7.12 | 50.64 | 7.14 | <0.001 |
| Female | 38.42 | 5.51 | 39.91 | 5.36 | 41.17 | 5.62 | 42.66 | 5.71 | 41.81 | 6.32 | <0.001 | |
| Speed over 20m (ms) | Male | 4.30 | 0.58 | 4.66 | 0.54 | 4.97 | 0.68 | 5.21 | 0.62 | 5.36 | 0.66 | <0.001 |
| Female | 4.00 | 0.51 | 4.22 | 0.55 | 4.33 | 0.52 | 4.42 | 0.66 | 4.50 | 0.69 | <0.001 | |
| Agility (s) | Male | 2.69 | 0.53 | 2.63 | 0.47 | 2.45 | 0.45 | 2.37 | 0.43 | 2.24 | 0.46 | <0.001 |
| Female | 2.90 | 0.57 | 2.92 | 0.56 | 2.93 | 0.58 | 2.89 | 0.54 | 2.82 | 0.56 | 0.703 | |
| Long jump (m) | Male | 1.28 | 0.26 | 1.47 | 0.23 | 1.65 | 0.25 | 1.85 | 0.26 | 1.94 | 0.26 | <0.001 |
| Female | 1.12 | 0.25 | 1.26 | 0.23 | 1.34 | 0.25 | 1.38 | 0.25 | 1.40 | 0.23 | <0.001 | |
| Press-ups (30s) | Male | 13.40 | 8.22 | 13.41 | 8.12 | 16.03 | 8.83 | 20.48 | 10.05 | 23.88 | 10.38 | <0.001 |
| Female | 14.40 | 8.52 | 13.39 | 9.06 | 13.79 | 8.80 | 14.06 | 9.74 | 13.50 | 8.99 | 0.797 | |
| Sit-ups (30s) | Male | 18.95 | 6.94 | 21.00 | 6.73 | 23.58 | 6.74 | 26.17 | 7.17 | 26.70 | 7.28 | <0.001 |
| Female | 17.53 | 6.86 | 17.57 | 7.29 | 19.57 | 7.26 | 21.72 | 8.54 | 20.96 | 7.15 | <0.001 | |
| Balance (s) | Male | 12.13 | 10.85 | 13.69 | 11.17 | 14.05 | 11.37 | 15.39 | 11.71 | 11.83 | 10.84 | <0.001 |
| Female | 11.93 | 10.61 | 14.23 | 11.29 | 12.99 | 11.14 | 15.15 | 11.56 | 17.14 | 12.15 | <0.001 | |
Having performed the multivariate analysis, differences were observed between the normal and obese categories of BMI for age and sex in aerobic power (2.72mlO2kg−1min−1; 95% CI: 1.89–3.56; P<0.001), speed over 20m (0.14ms; 95% CI: 0.06–0.22; P<0.001), agility (−0.31s; 95% CI: −0.38 to −0.24; P<0.001), long jump (0.10m; 95% CI: 0.06–0.13; P<0.001), press-ups (2.55; 95% CI: 0.72–4.37; P<0.001), sit-ups (1.49; 95% CI: 0.07–2.92; P=0.033) and balance (2.58s; 95% CI: 1.02–4.14; P<0.001) in favour of the subgroup classified as normal (Fig. 1).
 of the whole sample (n=12,872) identifying the estimated marginal means for physical abilities according to nutritional status classification by body mass index adjusted for age and sex of children from the Popular Sports Schools of the Sports and Recreation Institute in Medellin (Colombia).")
Profile graphs derived from the analysis of covariance (ANCOVA) of the whole sample (n=12,872) identifying the estimated marginal means for physical abilities according to nutritional status classification by body mass index adjusted for age and sex of children from the Popular Sports Schools of the Sports and Recreation Institute in Medellin (Colombia).
When the subgroup classified as normal was compared with that described as very low or thin, there were differences in speed over 20m (0.13ms; 95% CI: 0.06–0.20; P<0.001), long jump (0.04m; 95% CI: 0.01–0.07; P<0.004) and sit-ups (1.32; 95% CI: 0.29–2.35; P=0.003), also in favour of the subgroup classified as normal (Fig. 1).
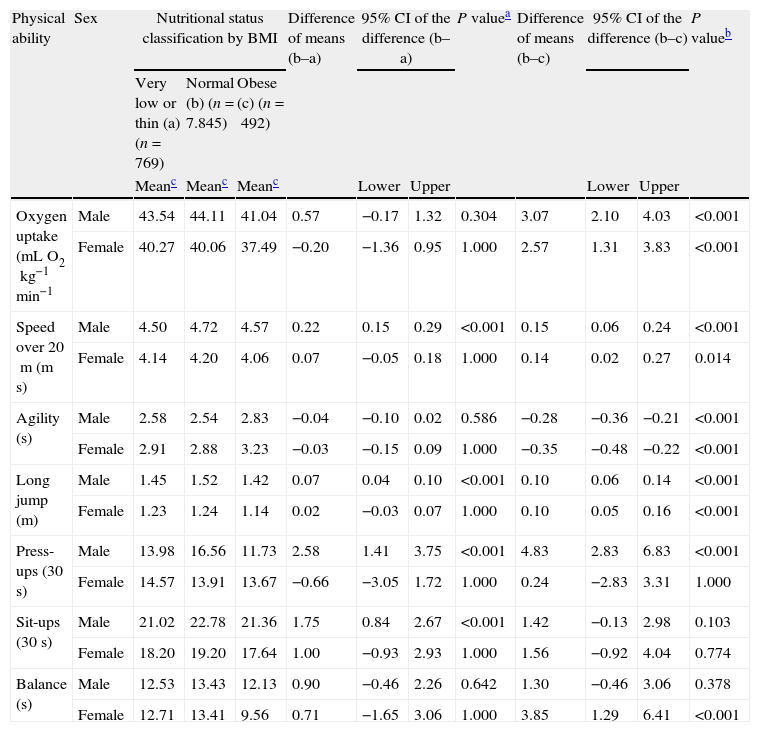
Differences were also observed between male and female subjects in the comparison of physical abilities according to nutritional state on the basis of BMI, discriminated by sex. The association between physical abilities and obesity was still present for both sexes in aerobic power, speed over 20m, agility and long jump, but only for boys in press-ups and only for girls in balance (Table 3). The association between physical abilities and very low or thin BMI category was still present only for boys in speed over 20m, long jump, press-ups and sit-ups (Table 3).
Comparison between nutritional status by body mass index classification and physical abilities adjusted for age of children from the Popular Sports Schools of the Sports and Recreation Institute in Medellin (Colombia).
| Physical ability | Sex | Nutritional status classification by BMI | Difference of means (b–a) | 95% CI of the difference (b–a) | P valuea | Difference of means (b–c) | 95% CI of the difference (b–c) | P valueb | ||||
| Very low or thin (a) (n=769) | Normal (b) (n=7.845) | Obese (c) (n=492) | ||||||||||
| Meanc | Meanc | Meanc | Lower | Upper | Lower | Upper | ||||||
| Oxygen uptake (mLO2kg−1min−1 | Male | 43.54 | 44.11 | 41.04 | 0.57 | −0.17 | 1.32 | 0.304 | 3.07 | 2.10 | 4.03 | <0.001 |
| Female | 40.27 | 40.06 | 37.49 | −0.20 | −1.36 | 0.95 | 1.000 | 2.57 | 1.31 | 3.83 | <0.001 | |
| Speed over 20m (ms) | Male | 4.50 | 4.72 | 4.57 | 0.22 | 0.15 | 0.29 | <0.001 | 0.15 | 0.06 | 0.24 | <0.001 |
| Female | 4.14 | 4.20 | 4.06 | 0.07 | −0.05 | 0.18 | 1.000 | 0.14 | 0.02 | 0.27 | 0.014 | |
| Agility (s) | Male | 2.58 | 2.54 | 2.83 | −0.04 | −0.10 | 0.02 | 0.586 | −0.28 | −0.36 | −0.21 | <0.001 |
| Female | 2.91 | 2.88 | 3.23 | −0.03 | −0.15 | 0.09 | 1.000 | −0.35 | −0.48 | −0.22 | <0.001 | |
| Long jump (m) | Male | 1.45 | 1.52 | 1.42 | 0.07 | 0.04 | 0.10 | <0.001 | 0.10 | 0.06 | 0.14 | <0.001 |
| Female | 1.23 | 1.24 | 1.14 | 0.02 | −0.03 | 0.07 | 1.000 | 0.10 | 0.05 | 0.16 | <0.001 | |
| Press-ups (30s) | Male | 13.98 | 16.56 | 11.73 | 2.58 | 1.41 | 3.75 | <0.001 | 4.83 | 2.83 | 6.83 | <0.001 |
| Female | 14.57 | 13.91 | 13.67 | −0.66 | −3.05 | 1.72 | 1.000 | 0.24 | −2.83 | 3.31 | 1.000 | |
| Sit-ups (30s) | Male | 21.02 | 22.78 | 21.36 | 1.75 | 0.84 | 2.67 | <0.001 | 1.42 | −0.13 | 2.98 | 0.103 |
| Female | 18.20 | 19.20 | 17.64 | 1.00 | −0.93 | 2.93 | 1.000 | 1.56 | −0.92 | 4.04 | 0.774 | |
| Balance (s) | Male | 12.53 | 13.43 | 12.13 | 0.90 | −0.46 | 2.26 | 0.642 | 1.30 | −0.46 | 3.06 | 0.378 |
| Female | 12.71 | 13.41 | 9.56 | 0.71 | −1.65 | 3.06 | 1.000 | 3.85 | 1.29 | 6.41 | <0.001 | |
BMI: body mass index. Categories of body mass index for age and sex: a (very low or thin); b (normal); c (obese).
The sample of boys and girls included in this study consisted mainly of physically active pre–pubescents and adolescents. The proportion of children with low weight for age and low height for age was high, compared with the results reported in demographic population-based studies in Latin America.5,6 By contrast, obesity was more common in younger children, but lower than the percentages reported in other studies, which are close to a third of the population.6,8,27
Physical abilities increased with age; the increment was greater in boys than in girls, and this finding is even clearer when we take into account the stage of maturation of sexual characteristics on the scale proposed by Tanner, which is in agreement with classic studies by Astrand28 and Malina29 and with more recent research, such as that of Armstrong.30,31
According to Astrand,28 children's physical abilities, both aerobic and strength-related, improve as they grow and mature; however, physical development also affects the progress of cardiorespiratory and musculoskeletal fitness, and these, in turn, are conditioned by nutritional status and sex.30 In one study, which included entities such as 12-year-old boys and girls, sex and Tanner maturation stage showed a strong association with peak VO2, even more than with body mass.31 The results obtained in this study, both in the aerobic power component and for strength, show an improvement in performance as the Tanner maturation stage increased, which was more marked in males than in females, similar to the findings of other authors.30–32
On assessing the relationship between physical abilities and nutritional status, we found a decrease in aerobic power (VO2max) in the obese category, according to the BMI for age and sex indicator. These findings are similar to those reported by authors in many countries, who have recorded lower VO2max and physical performance in children with high weight for age and sex and in those with obesity according to BMI.9,33,34
It is important to bear in mind that peak VO2, which is reduced in obese children, is related to a decline in functional ability and increased morbidity and mortality from cardiovascular causes.10 For this reason, a sedentary lifestyle, obesity and low fitness in childhood could be the start of multiple cardiovascular risk factors in adult life and of a worse prognosis.
On the physical abilities inherent in speed, strength and coordination, existing information is scarce and generally inconclusive.9,35 Contrary to such evidence, the results obtained in this study showed that obese children also had less speed, agility, explosive strength, strength endurance and balance. It was also found that children with a BMI classified as very low or thin performed less well in speed, explosive strength and strength endurance.
It must be emphasised that the general state of health of the children included in this study was good, according to the data in the medical assessment; moreover, they were active children, since they were enrolled in a sports training programme, did several exercise sessions per week and belonged, in most cases, to the advanced age group, comprising children of between 10 and 17.9 years of age. Severe nutritional deficiencies such as childhood undernutrition, in its acute and chronic forms, are therefore less likely to occur in a sports training programme compared with the general population.
Bearing this premise in mind, there was less chance of finding children with severe states of undernutrition that might have had a negative effect on the results of the physical tests. It could even be appropriate, in general, to describe them in some cases as healthy children with genetic and environmental conditions that predispose them to short stature and a thin build, when they are assessed and compared with reference standards derived from children ethnically endowed with taller stature and higher body mass.
Nevertheless, despite these considerations, we also found lower values in the results of the physical tests for children classified in the very low or thin group by comparison with the normal category of BMI according to age and sex; moreover, we observed changes in the association when discriminating by sex, possibly due to variability of the results obtained and genetic and hormonal differences.
In many studies, children of lower stature and weight for their age and sex show lesser aerobic ability and components of strength, especially if they belong to low socioeconomic strata.32 This relationship may be maintained even if there are other additional environmental factors. In two studies that included Bolivian children, the differences in physical abilities according to height for age still remained after comparisons were made taking socioeconomic level and high-altitude place of residence into account.36,37
Assessment of physical abilities is a simple and efficient way of studying the effect of obesity on a child's health. Poor physical performance may indicate the difference between a “fat” physique and an unhealthy lifestyle, which is manifested not only by excess weight but also by a decline in physical fitness.
On the basis of our findings and some reports in the literature,38–40 we could posit that a decline in physical abilities in children may be an early marker of cardiovascular and musculoskeletal compromise or a condition that changes over time simultaneously with other metabolic and inflammatory variables. These hypotheses open the way to future research, to enable us to compare physical abilities with a range of clinical and laboratory parameters in healthy, undernourished and obese children and to assess the predictive value of physical ability in childhood for cardiovascular morbidity and mortality in adult life.
ConclusionsIn the children included in this study there was an association between nutritional status and physical abilities. The children at risk of overweight and obesity showed the worst results in the physical tests and the children with undernutrition had a reduction in speed, explosive strength and strength endurance.
FinancingThis research was carried out with funds from the Sports and Recreation Institute (INDER) in Medellin under the Institutional Agreement with the University of Antioquia, No. C-0340 (2008).
Conflicts of interestThe authors have no conflicts of interest to declare.
We would like to express our sincere thanks to the management and the coordinators of the various groups at the Sports and Recreation Institute (INDER) in Medellin, and to all the children and their families who agreed to be assessed and made these findings possible.
We also wish to acknowledge the excellent work of all those who took part in collecting the information, and especially the teachers and fellow students on the postgraduate course in Medicine Applied to Physical Activity and Sport at the University of Antioquia.
Please cite this article as: García Cruz A, Figueroa Suárez J, Osorio Ciro J, Rodríguez Chavarro N, Gallo Villegas J. Asociación entre el estado nutricional y las capacidades físicas en niños de 6 a 18 años de Medellín (Colombia). An Pediatr (Barc). 2014;81:343–351.
