


It is well known that some symptoms in children with ventriculoperitoneal shunt are associated with a higher risk of developing shunt malfunction. However none of those symptoms are sensitive or specific enough to diagnose the shunt malfunction.
ObjectiveTo develop a diagnostic scale to identify children with an increased risk of shunt malfunction in the Emergency Department.
Material and methodsThis is a prospective study including children aged one to eighteen years old admitted to the Emergency Department between April 2010 and March 2013 with symptoms of ventriculoperitoneal shunt malfunction. Logistic regression Analysis was used to determine whether or not the variables were considered independent risk factors for shunt malfunction. The results led to the development of a diagnostic scale.
ResultsA scale was developed using 9 variables (erythema, swelling or discharge from the catheter trajectory, drowsiness, stiff neck, headache, afebrile, age >4 years, vomiting, recent neurological deficit, and time since last surgery ≤2 years) with a maximum score of 20 points. It was found that Scale scores ≥7 points were associated with an increased risk of shunt malfunction (OR 34.0, 95% CI 15.4–74.9; sensitivity 88.3%, specificity 81.1%, PPV 53.4%, NPV 96.7%).
DiscussionA diagnostic scale is designed for assessing the risk of shunt malfunction, selecting those patients with a higher risk. The use of this scale could help the management of these patients, reducing complementary tests, as well as the usual radiation suffered by these children.
Es conocido que la presencia de determinadas manifestaciones clínicas en los niños portadores de una válvula ventrículo-peritoneal (VDVP) se asocia a un mayor riesgo de disfunción valvular (DV), sin embargo, ninguna de estas es suficientemente sensible y específica por sí sola para diferenciar los pacientes que presentan una DV de los que no, y permitir así una actuación diagnóstica y terapéutica más adecuada.
ObjetivoElaborar una escala diagnóstica que permita seleccionar en el Servicio de Urgencias a los niños con riesgo de DV.
Material y métodosEstudio prospectivo. Se incluyó a los pacientes portadores de VDVP con edad comprendida entre 1 y 18 años que consultaron con sintomatología potencialmente asociada a DV en un Servicio de Urgencias durante 3 años (1 de abril del 2010-31 de marzo del 2013). Mediante regresión logística se determina qué variables se consideran factores de riesgo independientes de DV; con ellos se elabora una escala diagnóstica.
ResultadosSe obtiene una escala basada en 9 variables (eritema, tumefacción o secreción en el trayecto del catéter; somnolencia; rigidez de nuca; cefalea; ausencia de fiebre; edad mayor a 4 años; vómitos; focalidad neurológica reciente y tiempo desde la última intervención quirúrgica menor o igual a 2 años) con una puntuación máxima de 20 puntos. Puntuaciones de la escala de 7 o más puntos se asocian a un mayor riesgo de DV (OR 34,0; IC del 95%, 15,4-74,9; sensibilidad 88,3%; especificidad 81,1%; VPP 53,4%; VPN 96,7%).
DiscusiónLa escala diagnóstica para la valoración del riesgo de DV presentada permite seleccionar los pacientes con riesgo de DV. Su uso podría ayudar a mejorar la indicación de las pruebas complementarias que reciben los niños portadores de una VDVP y disminuir la irradiación a la que son sometidos estos pacientes.
Placement of a ventriculoperitoneal (VP) shunt is the most frequently used treatment for hydrocephalus in children. It is estimated that between 60% and 80% of patients with a VP shunt will experience shunt malfunction (SM) within 10 years of placement,1,2 with 40% of patients experiencing it in the first year,3–7 and the most frequent complication is obstruction of the drainage catheter.6,8,9 Although previously published studies have demonstrated that the presence of certain clinical manifestations, such as lethargy, irritability, shunt site swelling, increase in head circumference or the presence of focal neurological signs of recent onset have been associated to increased risk of SM,10–15 none of them in isolation suffices to differentiate patients with SM from patients without.
Patients with VP shunts attend the Emergency Department (ED) with clinical manifestations suggestive of SM fairly frequently. Their assessment is often challenging due to the nonspecific nature of the clinical manifestations and the presence of comorbidities, and often requires performing diagnostic tests to determine whether they are experiencing shunt complications, usually cranial computed tomography (CT) and a shunt series (SS).16,17 However, these examinations are not always conclusive and there are some patients in whom surgery reveals SM despite cranial CT or SS findings being normal or not changing compared to previous tests.18,19 On the other hand, the literature demonstrates that exposure to ionising radiation for diagnostic or therapeutic purposes can contribute to the development of malignancies,20–23 and paediatric patients are most vulnerable to this type of radiation.24–26 Thus, the literature on children with cerebrospinal fluid (CSF) shunts includes reports of cases of central nervous system tumours attributed to the number of cranial CT scans undergone by patients.27
To date, few studies have combined different signs and symptoms to establish the risk of SM. For this reason, the aim of our study was to develop a diagnostic scale that would allow the identification of children at risk of SM in the ED.
Patients and methodsWe conducted the study between April 1, 2010 and March 31, 2013 in a tertiary care women's and children's hospital with 264 paediatric beds for patients aged 0–18 years. It is the referral hospital for a service area of 1800000 inhabitants and receives an average of 280 visits a day.
We prospectively included all visits of patients aged 1–18 years with a VP shunt to the ED of our hospital during the period under study. We excluded visits of patients with a VP shunt that were in palliative care and were not eligible for surgery on account of their underlying disease, visits of children whose clinical manifestations were not potentially associated with SM, and repeat visits in the week following the initial visit, which were considered part of the same process. The symptoms that we considered potentially linked to SM were those described in the literature (ataxia, hemiparesis, headache, irritability, seizures, abdominal mass, lethargy, cranial nerve palsy, abdominal pain, nuchal rigidity, erythema at the shunt site, discharge at the shunt site, fever and vomiting).10–15
When a patient met the inclusion criteria, the paediatrician in charge of the patient's care filled out a data collection form designed for the purpose that included sections on the history of disease (disease that led to placement of VP shunt, number of previous instances of SM, time elapsed since the last shunt-related surgical procedure), symptoms presented at the time of the visit, tests performed in the ED, and discharge destination. A followup was performed a week after the visit by reviewing the hospital medical records and the primary care medical records in the shared network, leading to the classification of patients into one of two groups: SM group (children with operatively proven SM) and non-SM group (children in whom SM was ruled out). Confirmed SM was defined as SM proven by surgery. Ruled out SM was defined as the documentation of a diagnosis other than SM and/or the absence of neurosurgical procedures in the week following the ED visit.
The collected data were entered and processed in a Microsoft Access relational database designed for the purpose. We tabulated quantitative and categorical variables. The data were then analysed using the application SPSS 17.0. We have described quantitative variables using the mean or median, and categorical variables by means of percentages. We used tests to analyse the distribution of data (Kolmogorov–Smirnov) and to compare quantitative data (Student's t, Mann–Whitney U) and qualitative data (chi square, contingency table, Fisher's exact test); P-values less than .05 were considered statistically significant. We built a stepwise logistic regression model that included the variables corresponding to P-values of less than .3 in the univariate analysis. We categorised continuous variables applying the optimal cut-off value for the diagnosis of SM that we had found by means of a ROC curve. We developed the diagnostic scale by rounding off the beta coefficient of the variables selected by means of logistic regression. Subsequently, we analysed the scale by means of a ROC curve to determine the score in the scale that yielded the highest sensitivity and specificity for the identification of patients at highest risk of SM.
ResultsThree hundred and sixty three visits fulfilled the inclusion criteria (Fig. 1), corresponding to 145 patients, of whom 84 (57.9%) were male. The median age at the time of the visits was 7.3 years (IQR, 3.7–11.7 years) and the median time elapsed since the last surgical intervention was 32.2 months (IQR, 14.7–74.4 months). In 187 of the visits, the patient had a prior history of SM (median, 1; range, 1–13).
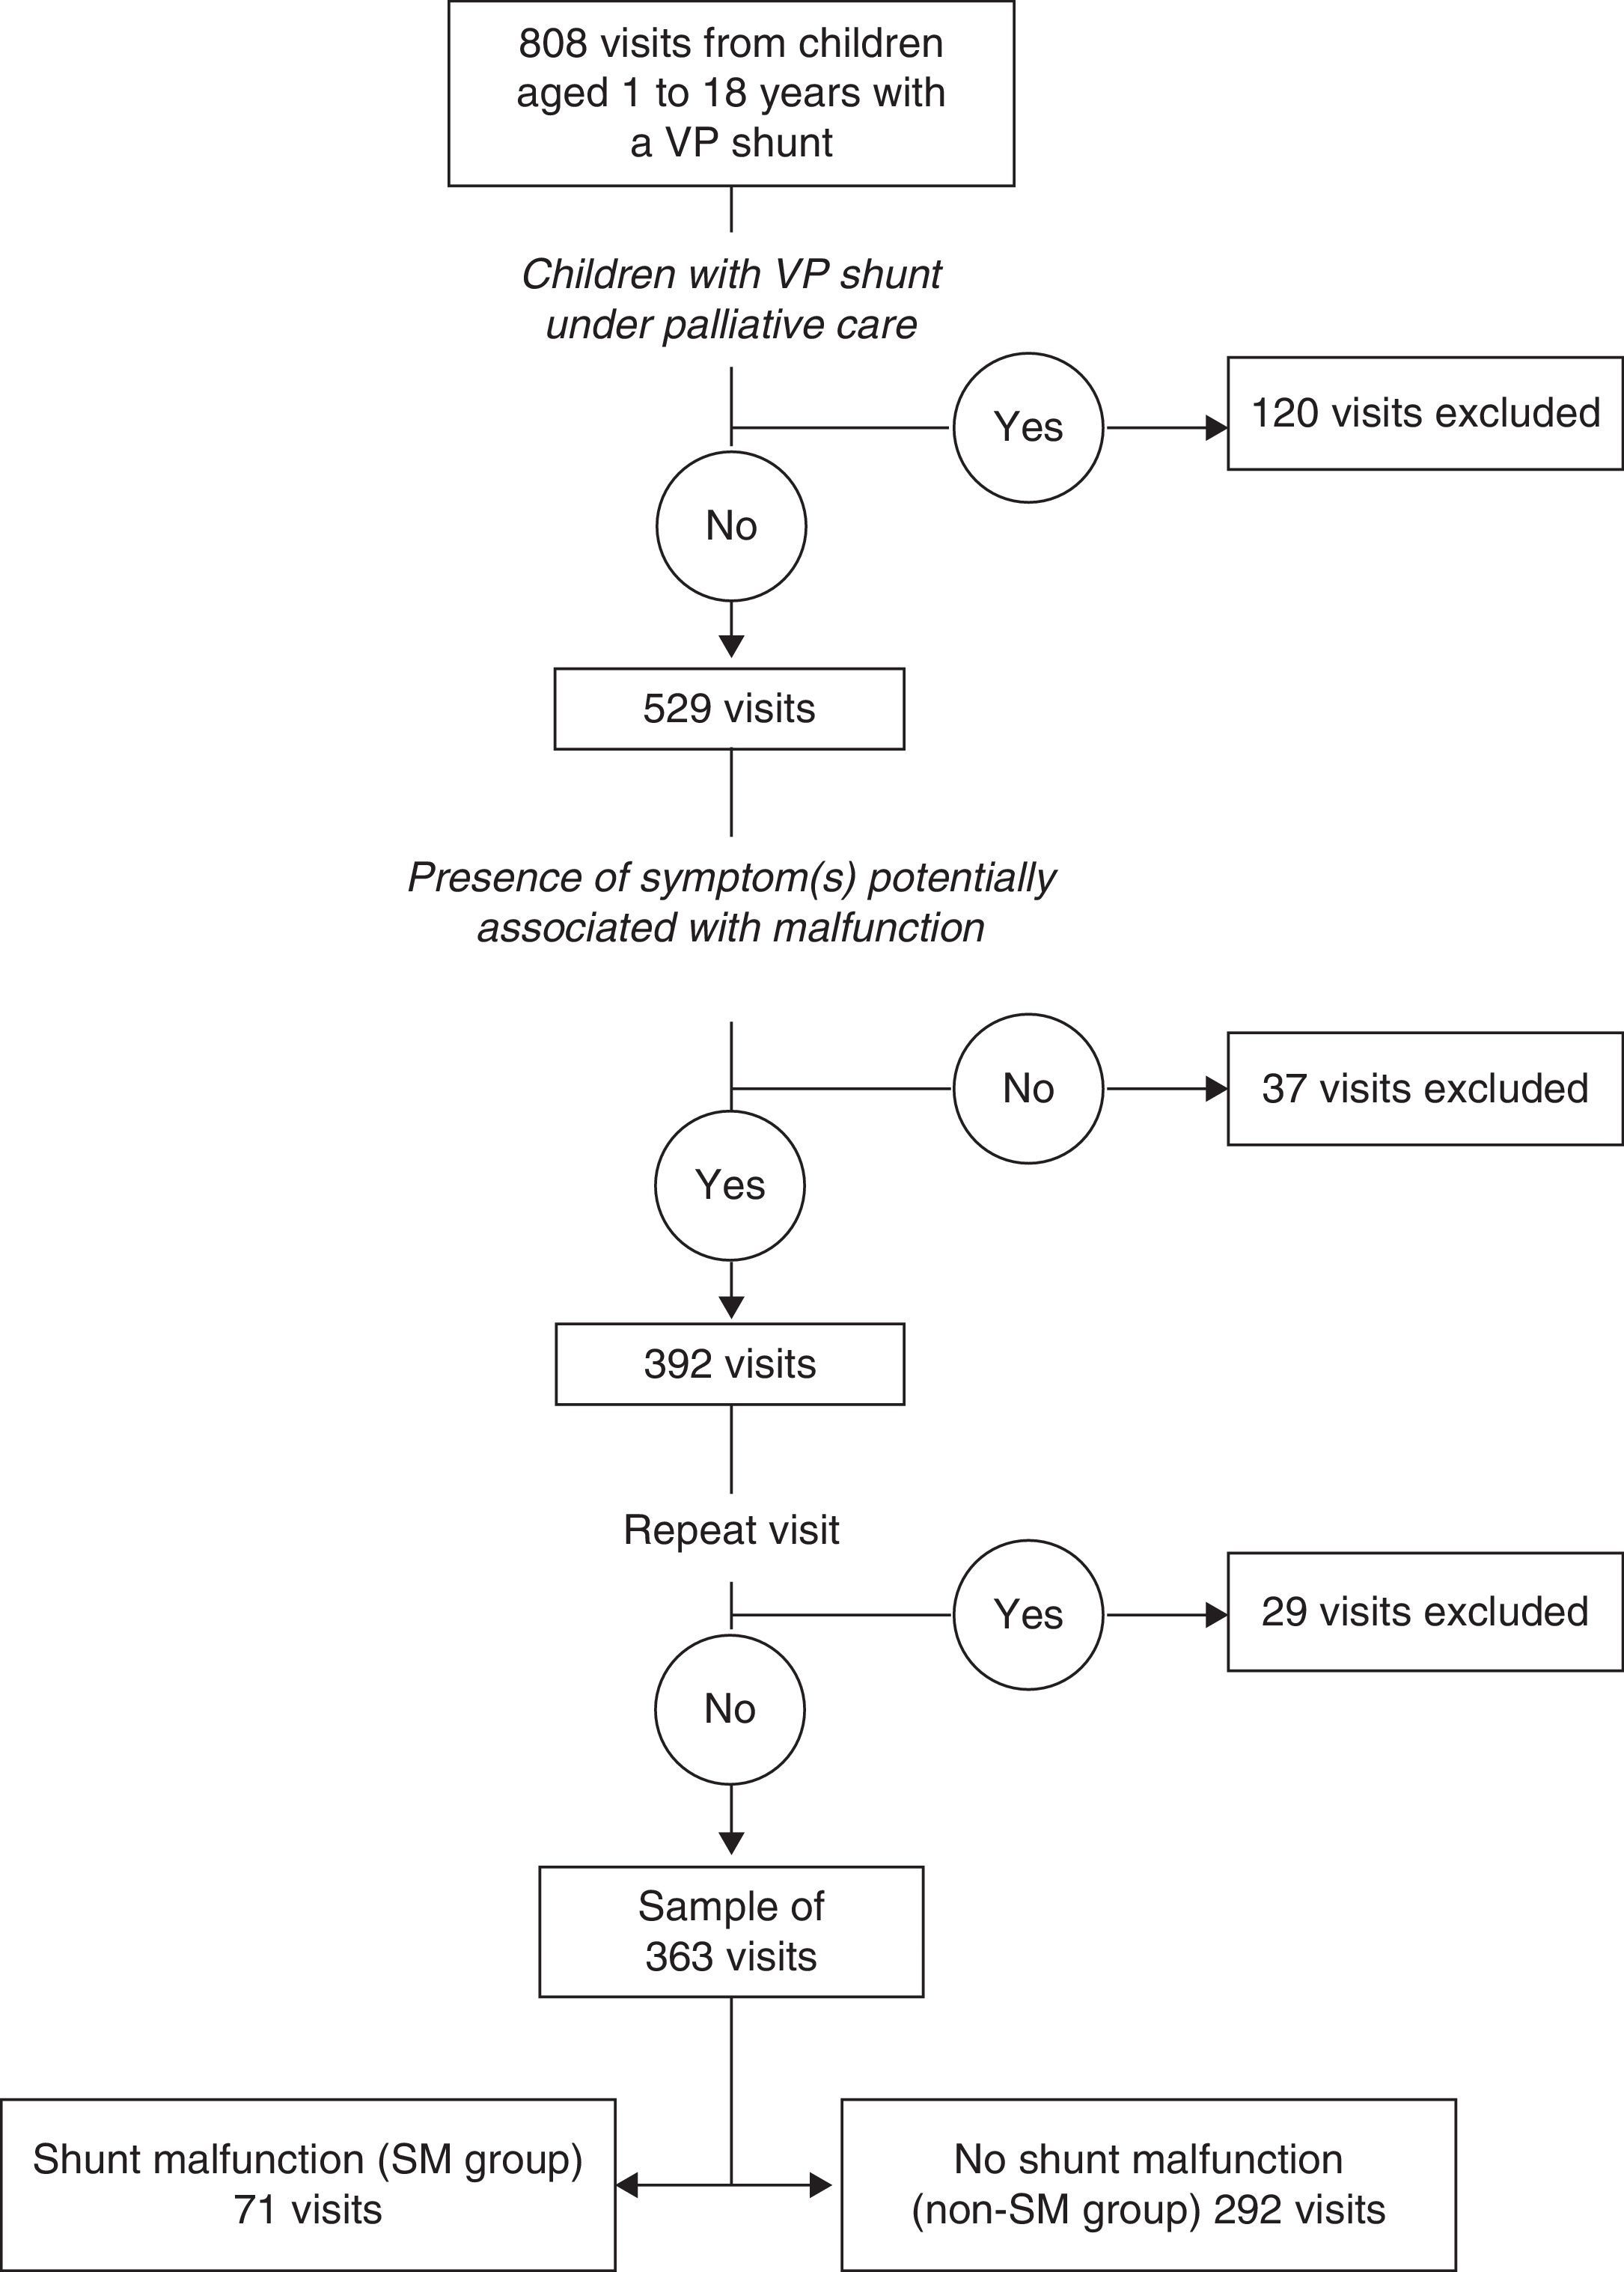
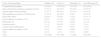
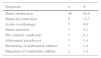
Shunt malfunction was confirmed in 71 visits (19.5%; SM group), and ruled out in 292 visits (80.5%, non-SM group). Table 1 shows the reasons for VP shunt placement in the patients, and the number of associated visits. Table 2 shows the different types of SM that were diagnosed. We observed that children that experienced SM were older than children that did not (median age, 8.8 years vs 6.7 years; P=.016) and had undergone their last surgical procedure more recently (median elapsed time, 1.8 vs 2.7 years; P=.004). We determined that the optimal cut-off value for diagnosing SM was 4 years in terms of age, and two years when it came to the time elapsed since the last surgical intervention.
Reasons for shunt placement, number of visits and frequency of shunt malfunction.
| Cause of hydrocephalus | Children (%) | Visits (%) | SM group (%) | Non-SM group (%) |
|---|---|---|---|---|
| Congenital hydrocephalus | 50 (34.5) | 124 (34.2) | 22 (31.0) | 102 (34.9) |
| Intraventricular haemorrhage in preterm newborn | 31 (21.4) | 83 (22.9) | 25 (35.2) | 58 (19.9) |
| Tumour-induced hydrocephalus | 17 (11.7) | 44 (12.1) | 10 (14.1) | 34 (11.6) |
| Hydrocephalus secondary to CNS infection | 15 (10.3) | 38 (10.5) | 6 (8.5) | 32 (11.0) |
| Neural tube defect | 13 (9.0) | 35 (9.6) | 2 (2.8) | 33 (11.3) |
| Hydrocephalus secondary to CVA | 9 (6.2) | 14 (3.9) | 2 (2.8) | 12 (4.1) |
| Intracranial cyst | 5 (3.4) | 11 (3.0) | 0 (0.0) | 11 (3.8) |
| Craniosynostosis | 2 (1.4) | 10 (2.8) | 3 (4.2) | 7 (2.4) |
| Arnold–Chiari malformation | 1 (0.7) | 1 (0.3) | 0 (0.0) | 1 (0.3) |
| Hydrocephalus secondary to TBI | 1 (0.7) | 1 (0.3) | 0 (0.0) | 1 (0.3) |
| Other | 1 (0.7) | 1 (1.4) | 1 (0.3) | 2 (0.6) |
| Total | 145 (100) | 363 (100) | 71 (100) | 292 (100) |
CNS, central nervous system; CVA, cerebrovascular accident; TBI, traumatic brain injury.
Types of valve malfunction diagnosed (n=71).
| Diagnosis | n | % |
|---|---|---|
| Shunt obstruction | 46 | 84.8 |
| Shunt disconnection | 9 | 12.7 |
| Acute overdrainage | 7 | 9.9 |
| Shunt infection | 3 | 4.2 |
| Slit ventricle syndrome | 3 | 4.2 |
| Abdominal pseudocyst | 1 | 1.4 |
| Shortening of abdominal catheter | 1 | 1.4 |
| Migration of ventricular catheter | 1 | 1.4 |
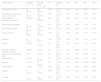
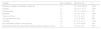
Table 3 shows the univariate analysis of the epidemiological and clinical factors under study. Table 4 shows the independent risk factors identified by the multivariate logistic regression model. Although the presence of focal neurologic deficits of recent onset was not statistically significant and could not be considered an independent risk factor for SM, we do consider it clinically significant, and therefore included it in the final equation.
Univariate analysis of previous history of disease and clinical and epidemiological factors at the time of the Emergency Department visit.
| Signs/symptoms | SM group n=71 | Non-SM group n=292 | P | OR (95% CI) | Sen | Spe | PPV | NPV |
|---|---|---|---|---|---|---|---|---|
| Age older than 4 years | 65 (91.5%) | 166 (67.1%) | <.001 | 5.3 (2.2–12.7) | 91.5% | 32.9% | 24.9% | 94.1% |
| Time since last surgery equal to or less than 2 years | 37 (52.1%) | 101 (34.6%) | .006 | 2.1 (1.2–12.8) | 52.1% | 65.8% | 26.8% | 84.9% |
| Previous history of psychomotor retardation | 21(29.6%) | 146 (50.0%) | .002 | 0.42 (0.2–0.7) | 29.6% | 50.0% | 12.5% | 74.5% |
| Previous history of epilepsy | 15 (21.1%) | 105 (36.5%) | .017 | 0.5 (0.3–0.9) | 21.2% | 60.0% | 12.5% | 77.0% |
| Previous history of SM | 47 (66.6%) | 140 (47.9%) | .006 | 2.1 (1.2–3.7) | 66.2% | 52.1% | 25.1% | 86.4% |
| Absence of fever | 68 (95.8%) | 163 (55.8%) | <.001 | 17.9 (5.5–58.3) | 95.8% | 44.2% | 29.4% | 97.7% |
| Headache | 52 (73.2%) | 81 (27.7%) | <.001 | 7.1 (4.0–12.8) | 73.2% | 72.3% | 39.1% | 91.7% |
| Seizures | 2 (2.8%) | 33 (11.3%) | .03 | 0.2 (0.05–0.9) | 2.8% | 88.7% | 5.7% | 78.9% |
| Erythema, swelling or discharge at shunt site | 4 (5.6%) | 3 (1.0%) | .030 | 5.7 (1.2–26.3) | 5.6% | 99.0% | 57.1% | 81.2% |
| Recent-onset focal neurologic deficit | 4 (5.6) | 2 (0.7%) | .015 | 8.6 (1.5–48.2) | 5.6% | 99.3% | 66.6% | 81.2% |
| Abdominal pain | 6 (8.5%) | 34 (11.6%) | .441 | 0.7 (0.3–0.7) | 8.4% | 88.3% | 15.5% | 79.9% |
| Irritability | 8 (11.3%) | 25 (8.6%) | .477 | 1.3 (0.6–3.1) | 11.3% | 91.4% | 24.4% | 80.9% |
| Nuchal rigidity | 2 (2.8%) | 1 (0.3%) | .099 | 8.4 (0.7–94.3) | 2.8% | 99.6% | 66.6% | 80.8% |
| Lethargy | 25 (35.2%) | 11 (3.8%) | <.001 | 13.8 (6.4–30.1) | 35.2% | 96.2% | 69.4% | 85.9% |
| Vomiting | 51 (71.8%) | 101 (36.4%) | <.001 | 4.8 (2.8–8.5) | 71.8% | 65.4% | 33.5% | 90.5% |
SM, shunt malfunction; Spe, specificity; Sen, sensitivity; NPV, negative predictive value; PPV, positive predictive value.
Multivariate logistic regression model.
| Variable | Beta coefficient | OR (95% CI) | P |
|---|---|---|---|
| Erythema, swelling or discharge at shunt site | 3.9 | 48.1 (6.6–356.6) | <.001 |
| Lethargy | 3.1 | 22.4 (7.7–71.1) | <.001 |
| Nuchal rigidity | 3.4 | 30.7 (1.1–883.5) | .046 |
| Headache | 1.8 | 6.1 (2.6–14.2) | <.001 |
| Absence of fever | 1.8 | 6.2 (1.6–24.8) | .010 |
| Age greater than 4 years | 1.9 | 7.0 (1.9–26.5) | .004 |
| Vomiting | 1.6 | 4.1 (2.3–11.3) | <.001 |
| Focal neurologic deficits of recent onset | 1.4 | 4.1 (0.2–104.6) | .388 |
| Time elapsed since last surgical intervention less than or equal to 2 years | 1.0 | 2.8 (1.3–5.9) | .009 |
CI, confidence interval; OR, odds ratio.
The predictive power of this model, assessed by the area under the ROC curve, was 0.92 (95% CI, 0.89–0.94).
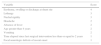
Table 5 shows the SM risk scale (SMRS) obtained with these results. The ROC curve analysis determined an optimal cut-off score of 7 in the SMRS for the identification of patients at high risk of SM (area under the curve, 0.91; 95% CI, 0.88–0.94). Scores of 7 or higher in the SMRS were associated with a higher risk of SM (OR, 34.0; 95% CI, 15.4–74.9; sensitivity, 88.3%; specificity, 81.1%; PPV, 53.4%; NPV, 96.7%).
Shunt malfunction risk scale for children and adolescents ages 1–18 with a ventriculoperitoneal shunt.
| Variable | Score |
|---|---|
| Erythema, swelling or discharge at shunt site | 4 |
| Lethargy | 3 |
| Nuchal rigidity | 3 |
| Headache | 2 |
| Absence of fever | 2 |
| Age greater than 4 years | 2 |
| Vomiting | 2 |
| Time elapsed since last surgical intervention less than or equal to 2 years | 1 |
| Focal neurologic deficits of recent onset | 1 |
Score ≥7: high risk of shunt malfunction. Conduct the appropriate tests for its assessment (such as computed tomography, shunt series, eye fundus examination).
Score 4–6: personalised assessment of the case. Monitoring in hospital with a neurosurgeon on call.
Score 0–3: discharge home with monitoring instructions.
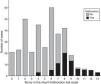
Fig. 2 shows the distribution of SMRS scores by presence or absence of SM. We observed that out of the 115 patients that had a SMRS score less than or equal to 3, none (0%) had SM, while conversely, out of the 118 that had a score equal to or greater than 7, 63 (53.4%) had SM. The group with scores ranging between 4 and 6 comprised 130 patients, of whom 8 (6.2%) had SM. These intervals are the intervals used to determine the approach to management in the emergency setting (Table 5).
Discussion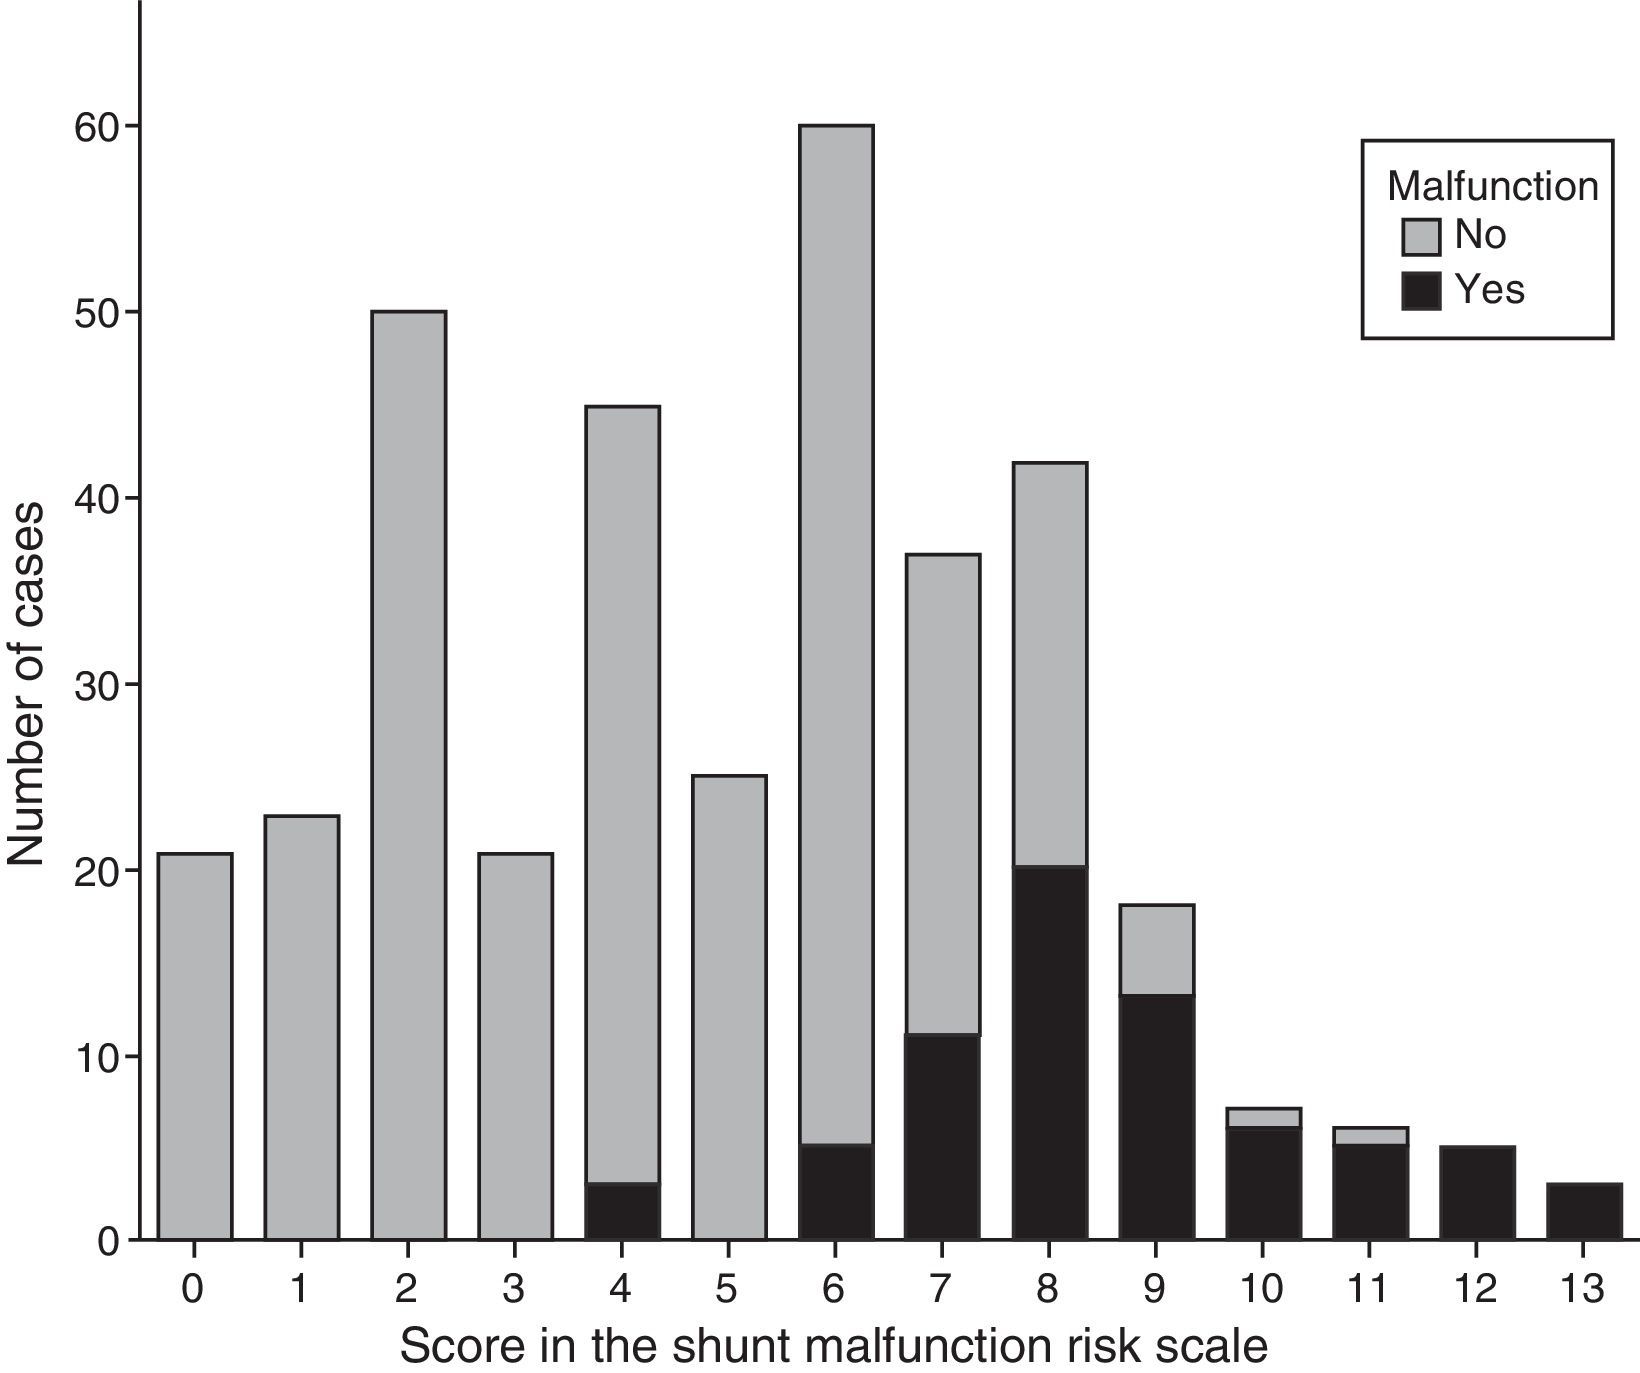
The results of this study allowed us to develop a SMRS for children and adolescents aged 1–18 years with a VP shunt based on seven clinical variables, the age of the patient and the time elapsed since the last surgical intervention, with a maximum score of 20 points. Scores in the SMRS equal to or greater than 7 points are associated to a high risk of SM with a high negative predictive value, which makes this scale particularly useful for identifying children at low risk of SM in whom performance of diagnostic tests could be avoided. The variables included in the definitive SMRS were selected intuitively and based on clinical experience. In this regard, changes at the shunt site such as erythema, swelling or the presence of discharge, despite being infrequent, were given significant weight because they are highly specific symptoms of shunt complications, while more frequent symptoms (such as headache and vomiting) must present together, and not in isolation, to indicate a higher risk of SM.
Although the SMRS helps estimate the risk of SM in children with a VP shunt seeking care at the ED, a personalised assessment is required in all cases. In light of the results we obtained, children with a score of 3 could be discharged home after giving clear information on the symptoms that would require returning for additional care. Children with scores of 7 or higher should be evaluated by a neurosurgeon in the ED, and undergo the necessary diagnostic tests to assess for a potential SM (CT and/or SS and/or fundus examination). We recommend that children with scores between 4 and 6 be kept in hospital under observation with a neurosurgeon on call.
The results of our study were consistent with the previous literature, and identified mechanical problems as the main cause of SM,3–5 with obstruction being the most common among them, affecting 80% of the patients in our series. All of the above makes the SMRS we present here particularly useful in case such complications are suspected. In the SMRS, fever is a protective factor. This is explained by the low proportion of children in whom shunts become infected (only three of the children in our series), as in most cases, children presenting with fever receive a diagnosis other than SM. Nevertheless, we must always keep in mind that the presence of fever without source in a child that has undergone placement or revision of a VP shunt in the past three months requires ruling out a shunt infection.3,4 It is also important to remember that the SMRS was designed to assess the risk of SM in children aged more than 1 year with a VP shunt, and should not be used to assess risk in infants or children with other types of CSF shunts. Another of the limitations of our study involves the low prevalence of SM, as there were not enough cases for a validation study of the SMRS, which may be validated in future studies.
Last of all, we ought to note that the use of scales to assess the risk of SM, such as the SMRS, can help improve decision making in the ordering of diagnostic tests in children with VP shunts, which would reduce health care costs and decrease radiation exposure in these patients.
Conflict of interestsThe authors have no conflict of interests to declare.
Please cite this article as: Muñoz-Santanach D, Trenchs Sainz de la Maza V, Candela Canto S, Luaces Cubells C. Escala clínica para el diagnóstico de disfunción de válvula ventriculoperitoneal en niños en el Servicio de Urgencias. An Pediatr (Barc). 2016;84:311–317.
This study has been partially funded by the II Grant for Research of the Sociedad Española de Urgencias de Pediatría.

Anales de Pediatría (English Edition) follows the Recommendations for the Conduct, Reporting, Editing and Publication of Scholarly Work in Medical Journals