


Our aim was to investigate the correlations between patterns of head growth and intellectual disability among distinct aetiological presentations of microcephaly.
Patients and methods3269 head circumference (HC) charts of patients from a tertiary neuropaediatric unit were reviewed and 136 microcephalic participants selected. Using the Z-scores of registered HC measurements we defined the variables: HC Minimum, HC Drop and HC Catch-up. We classified patients according to the presence or absence of intellectual disability (IQ below 71) and according to the cause of microcephaly (idiopathic, familial, syndromic, symptomatic and mixed).
ResultsUsing discriminant analysis a C-function was defined as C=HC Minimum+HC Drop with a cut-off level of C=−4.32 Z-score. In our sample 95% of patients scoring below this level, severe microcephaly, were classified in the disabled group while the overall concordance was 66%. In the symptomatic-mixed group the concordance between HC function and outcome reached 82% in contrast to only 54% in the idiopathic-syndromic group (P-value=0.0002).
ConclusionsWe defined a HC growth function which discriminates intellectual disability of microcephalic patients better than isolated HC measurements, especially for those with secondary and mixed aetiologies.
Nuestro objetivo fue investigar la correlación entre patrones de crecimiento cefálico y discapacidad intelectual entre distintas presentaciones etiológicas de microcefalia.
Pacientes y métodos3.269 gráficas de perímetro cefálico (PC) de una unidad de neuropediatría terciaria fueron revisadas y 136 participantes con microcefalia seleccionados. Utilizando las puntuaciones Z de las medidas de PC registradas definimos las variables: PC Mínimo, Caída de PC y Recuperación de PC. Los pacientes se clasificaron según la existencia o no discapacidad intelectual (CI inferior a 71) y según la causa de la microcefalia (idiopática, familiar, sindrómica, sintomática y mixta).
ResultadosMediante el uso del Análisis Discriminante se definió una función C como C=PC mínimo + Caída de PC con un nivel de corte de puntuación Z de C=−4.32. En nuestra muestra, el 95% de pacientes con resultados por debajo de este nivel, microcefalia severa, presentaban discapacidad intelectual. La concordancia global entre la función de PC y la presencia de discapacidad intelectual fue del 66%. En el grupo de sintomáticas y mixtas esta concordancia alcanzó el 82%, en contraste con sólo el 54% del grupo de idiopáticas y sindrómicas (P=0,0002).
ConclusionesLa utilización de una función de crecimiento del PC discrimina la discapacidad intelectual en pacientes con microcefalia mejor que mediciones aisladas de PC, especialmente en etiologías secundarias y mixtas.
Head circumference (HC) measurement is an easy method to assess brain growth. Microcephaly, defined as a statistically abnormally low HC, has a relationship with mental retardation which is well known since the 19th century.1 This relationship was extensively studied during the second half of the 20th century2–10 and for a general population it was established that a HC below −2 standard deviations (SD) for age and sex is associated with an IQ below 70 in 10% of the children, and in 51% for those with a HC below −3 SD.9
Head growth patterns have been proposed as an important tool in the assessment of microcephaly.11,12 However, they have been defined using the shape of the HC curves on the charts rather than on mathematical models. It is clear that the lower the HC the child has the greater the likelihood of neurological impairment is.9 But it is not known for all aetiologies of microcephaly which level of low velocity in HC growth is associated with a comparable outcome.
There are many different neurological conditions causing microcephaly or slow HC growth and some of them have already been object of research. In hypoxic–ischaemic encephalopathy slight decelerations imply neurological impairment even before the microcephalic range is attained13 and the patterns of lesions found in magnetic resonance imaging (MRI) correlate with HC growth and neurological status.14 Research on congenital rubella15 has shown normal intelligence in the presence of microcephaly when children with hearing and vision losses were excluded. Conversely, microcephaly was the most specific early predictor of mental retardation in congenital CMV infection16 while neurologic disorders do not develop in the majority of congenitally infected infants.17 In very low weight birth infants Hack and cols18 found that HC at 8 months of age was the best growth predictor of intelligence quotient at 3 years of age. In another study the presence of HC catch-up growth before the age of 6 months was associated with fewer motor abnormalities at 12 months.19 A normal HC at 12 months in pre-term infants with intracranial haemorrhage was associated with a better outcome.20 Regev and cols21 found that slow head growth after intra-cranial haemorrhage correlated with a poor neurodevelopmental outcome. Ionizing radiation exposure,22 malnutrition,23 medication during pregnancy24 and genetic or primary microcephaly25,26 are other known causes of small head and mental retardation. Microcephaly is also a clinical feature of hundreds of multiple malformation syndromes.
In a hospital based retrospective study of 58 microcephalic patients, neuroimaging was concluded to be the best study in order to establish aetiology27 and in another study MRI was abnormal in 80% of 55 microcephalic paediatric patients.28
In our study we aimed to investigate the concordance of a HC growth function with intellectual disability among different aetiological clinical presentations in a sample of microcephalic infants and children.
Patients and methodsWe retrospectively studied patients from a tertiary hospital neuropaediatric unit in Spain which serves as a referral area for three million people. Since 1982 a follow-up HC Nellhaus Chart11 according to patient's sex was routinely placed in every medical record during the first visit regardless of the reason of referral. In more than a half of the visits the neuropaediatrician measured with a flexible tape the maximum HC in cm, to one decimal point, and plotted it onto the chart. Neither parent's HC nor patient's height were part of the protocol. Since 1989 MRI has been available in our hospital and it has become a part of the assessment in most of the microcephalic children.
After a decade using this protocol we started to collect the data. We reviewed all records of patients receiving care in our unit during the years 1987–2001. On each one of the 3269 patients HC chart was checked and all patients with one or more HC measurements more than two SD below the mean for age and sex were fully reviewed. The inclusion criteria to select participants were: one or more HC measurement below −2 SD for age and sex according to Nellhaus chart; more than 3 years of follow-up in our unit; three or more years of age at the time of intellectual or developmental assessment; three or more HC measurements registered and aetiological study available including MRI when needed. Following Brandt recommendations29 we excluded pre-term infants under 34 weeks of gestation whose HC was in the normal range after the age of 18 months. Parent's HC was recorded in those cases where hereditary microcephaly was suspected.
We plotted all available HC points of every patient onto the Nellhaus. We obtained the Z-score (SD units) of all HC measurements according to: Z=(HC measurement−mean HC for age)/SD for age. Once all Z-scores were calculated we defined the following variables as the descriptors of the patient HC curve pattern:
Standardized head circumference minimum (HC Minimum)It is the lowest registered Z-score per participant. Given that all patients were microcephalic, this variable was always negative and always smaller than −2.
Standardized head circumference drop (HC Drop)It was obtained, in all those patients whose Z-scores became more negative over time, by subtracting from the lowest registered Z-score the highest previous z-score. This variable was always negative. All HC drops from 0 to −0.2 were considered negligible and equal to 0.
Standardized head circumference catch-up (HC Catch-up)It was obtained, in all those patients whose Z-scores increased after the smallest registered Z-score, by substracting the lowest previously registered Z-score from the highest final Z-score. This variable was always positive. All HC Catch-up below 0.2 were considered negligible and equal to 0.
In order to establish the neurological outcome we reviewed the level of intellectual impairment of every patient with his or her paediatric neurologist. WISC-R tests in children older than 6 years with a sufficiently preserved mental status to allow them to collaborate with the test, school and parent reports in normal functioning children older than 6 years and Terman Merill or Leiter developmental tests in those older than 3 years, were considered.
We distributed patients into two groups according to their outcome:
Intellectually disabled: IQ below 71 and/or severe to profound levels of impairment at neurological examination at 3 years or older.
Not intellectually disabled: IQ scoring 71 or more and/or normal functioning at 6 years or older supported by school reports.
Clinical groups were established according to the most probable cause of microcephaly. Following the criteria proposed by Baxter et al.,12 participants were distributed into five presentations: (1) idiopathic, that is, no cause could be recognized from the history, examination, or investigations, and there were no other abnormal findings; (2) familial, that is, a parent and/or sibling had a head circumference at or below the second percentile; (3) syndromic, that is, associated anomalies were present (outside central nervous system); (4) symptomatic, that is, following a pathogenic event; or (5) mixed: two or more of the aforementioned.
Statistical analysesHC descriptor variables HC Minimum, HC Drop, and HC Catch-up were carefully examined and their statistical distributions analyzed. Mean, median, standard deviation and interquartile range were used to express the central tendency and statistical dispersion of data. Graphical comparison between disabled and non disabled groups was performed by the box-plot diagram. In this diagram, the bottom and top edges of the box correspond to the sample's 25th (Q1) and 75th (Q3) percentiles, the box length is one interquartile range (IQR=Q3−Q1), the centre horizontal line corresponds to the sample median value, and the error bars that project out from the box indicate the 90th and 10th percentiles. The nonparametric Wilcoxon rank-sum test, on the original variables, and the Fisher's exact-test, on the categorical variables resulting after recoding in two (0, <0) classes, were used to assess the statistical differences between intellectual impairment groups. Statistical significance was set at a P value of <0.05. Multivariate discriminant analysis was carried out to study the HC growth pattern descriptor variables jointly and their influence on patient adscription to either disabled or non disabled groups. Statistical analyses were performed with SAS/STAT release 9.1 (SAS Institute Inc., Cary, NC, USA).
ResultsAfter the revision of 3269 charts, 136 patients satisfied the study inclusion criteria. Male to female ratio was 60:76. The mean age of the first available HC (measured by the paediatric neurologist) was 20 months (median 10 months). The mean length of the HC follow-up was 56 months (median 38 months) and the mean number of HC measurements recorded was 5.65 (median 5 measurements). We included 16 infants born before the 34th week of gestation, as they remained microcephalic after the age of 18 months. MRI reports were available in 112 patients.
In our sample 75% of participants were intellectually disabled (102/136), and 48% of them (49/102) also had a diagnosis of cerebral palsy within levels III–V of the gross motor function classification system (GMFCS).30 Accordingly 25% of participants were not intellectually disabled (34/136), and three of them also suffered from cerebral palsy at level III of the GMFCS.
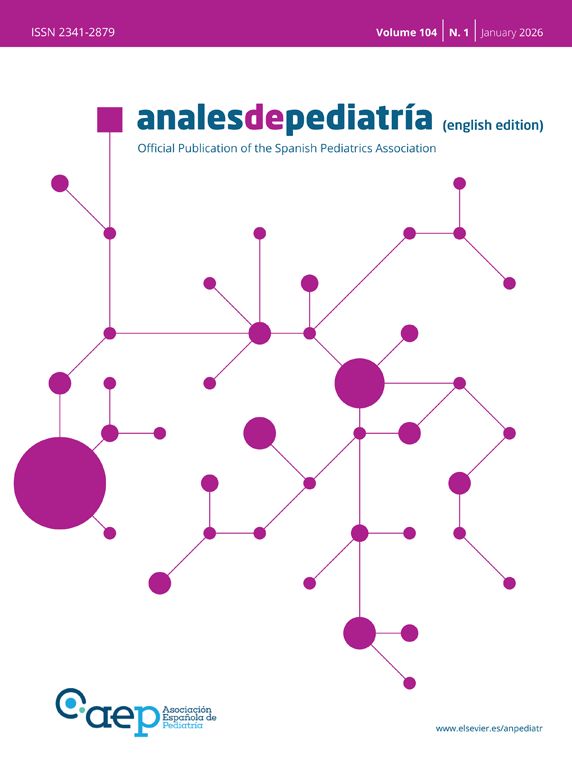
Disabled and non disabled groups showed different HC growth patterns. Mean HC Minimum was −2.93 in non impaired participants and −3.99 in impaired ones (Fig. 1). These differences were statistically significant (P<0.05, Wilcoxon rank-sum test).
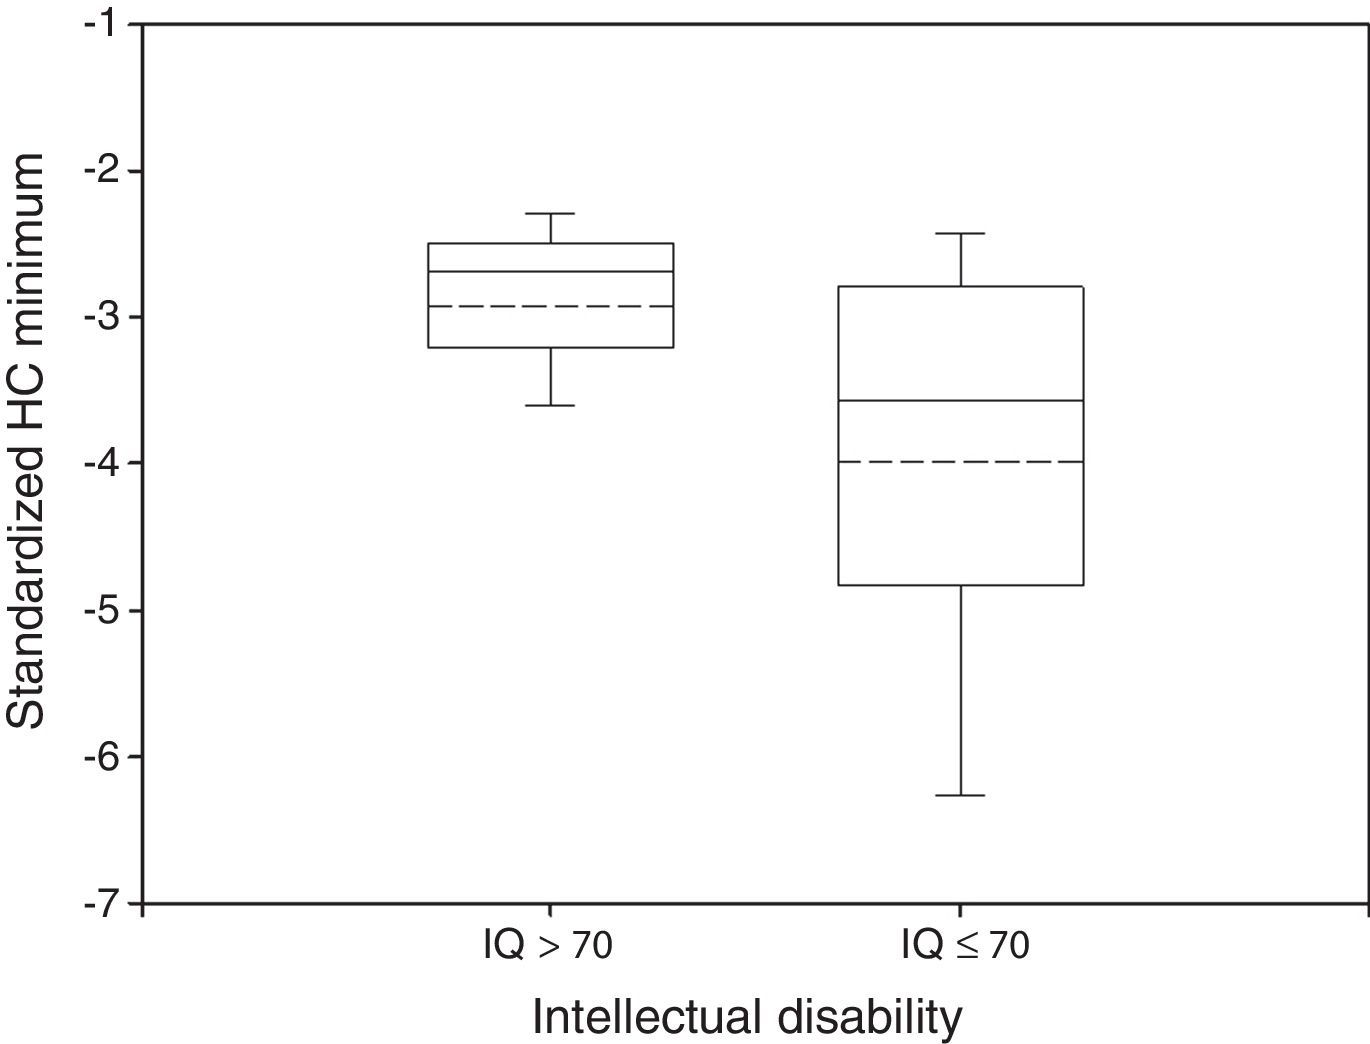
Box plot of standardized HC Minimum by neurological outcome. The median and the mean are depicted within the boxes as solid and dashed lines, respectively. Non disabled group: n=34, mean=−2.93, standard deviation=0.64, median=−2.69, IQR=0.68. Disabled group: n=102, mean=−3.99, standard deviation=1.50, median=−3.58, IQR=1.97. Wilcoxon rank-sum test: P<0.05.
In 51% of patients HC Drop was significantly different from 0. In the normal group only 29% of the participants had a HC Drop and mean HC Drop was −0.29 while in the impaired group 42% had a significant HC Drop and mean HC Drop was −1.42 (Fig. 2). These differences were also significant (P<0.05 in Wilcoxon rank-sum test for HC Drop by intellectual disability group and in Fisher's Exact Test for proportion of HC Drop different from 0 by intellectual disability group).
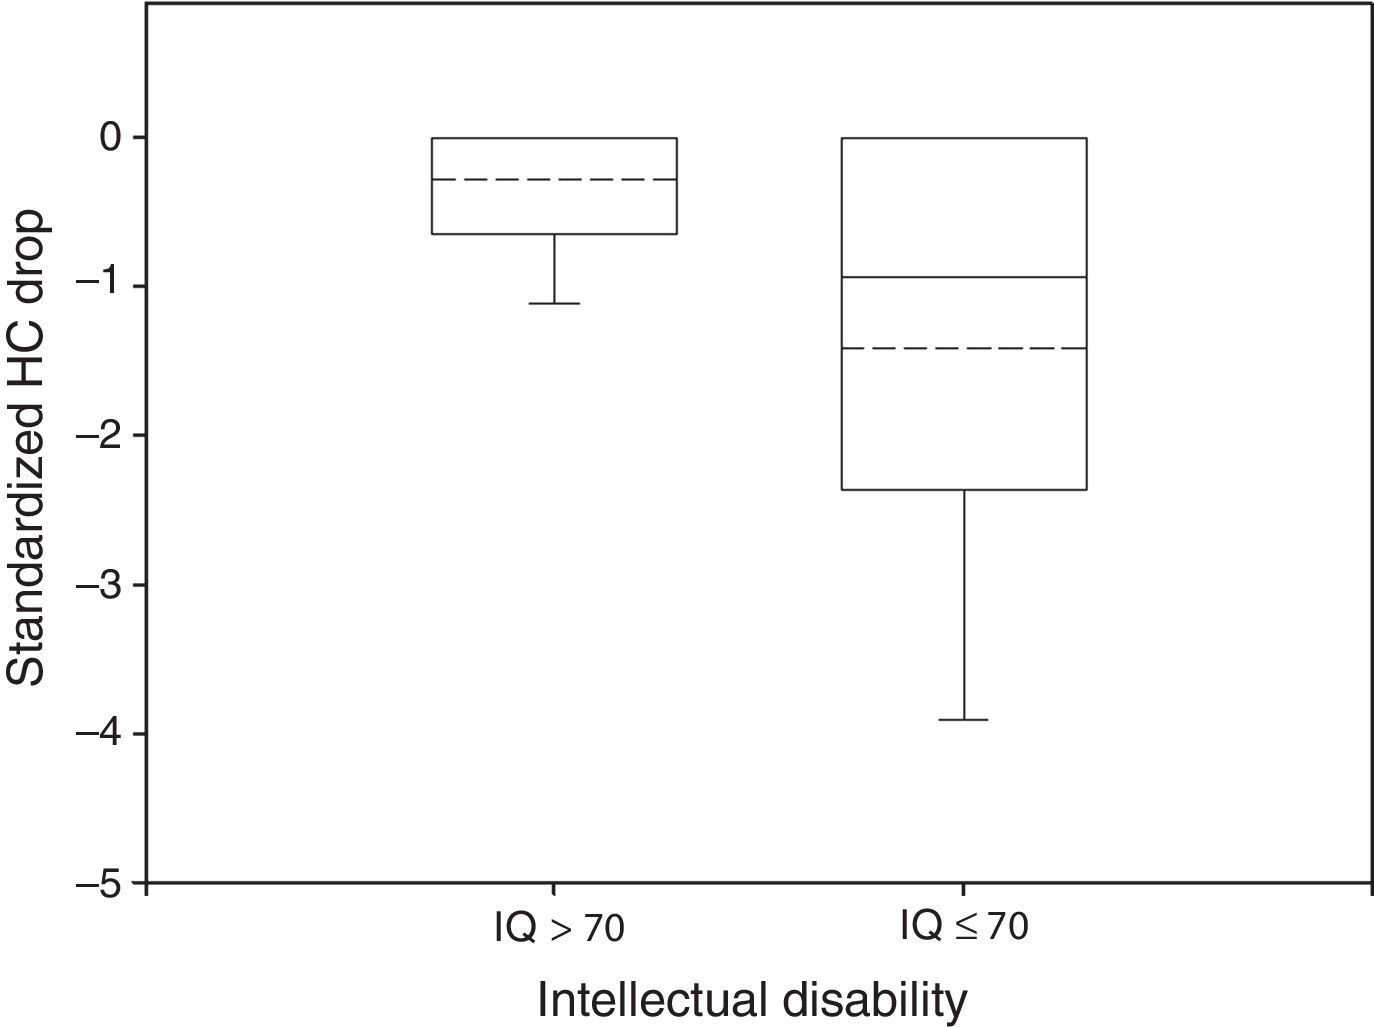
Box plot of standardized HC Drop by neurological outcome. The median and the mean are depicted within the boxes as solid and dashed lines, respectively. Non disabled group: n=34, mean=−0.29, standard deviation=0.50, median=0, IQR=0.64. Disabled group: n=102, mean=−1.42, standard deviation=1.66, median=−0.94, IQR=2.34. Wilcoxon rank-sum test: P<0.05.
Only 23% of participants had a HC Catch-up significantly different from zero, 38% of the normal group and 14% of the impaired group (Fisher's exact test: P<0.05). The mean HC Catch-up was 0.45 in non disabled participants and 0.21 in the disabled group, as depicted in Fig. 3 (Wilcoxon rank-sum test: P<0.05).
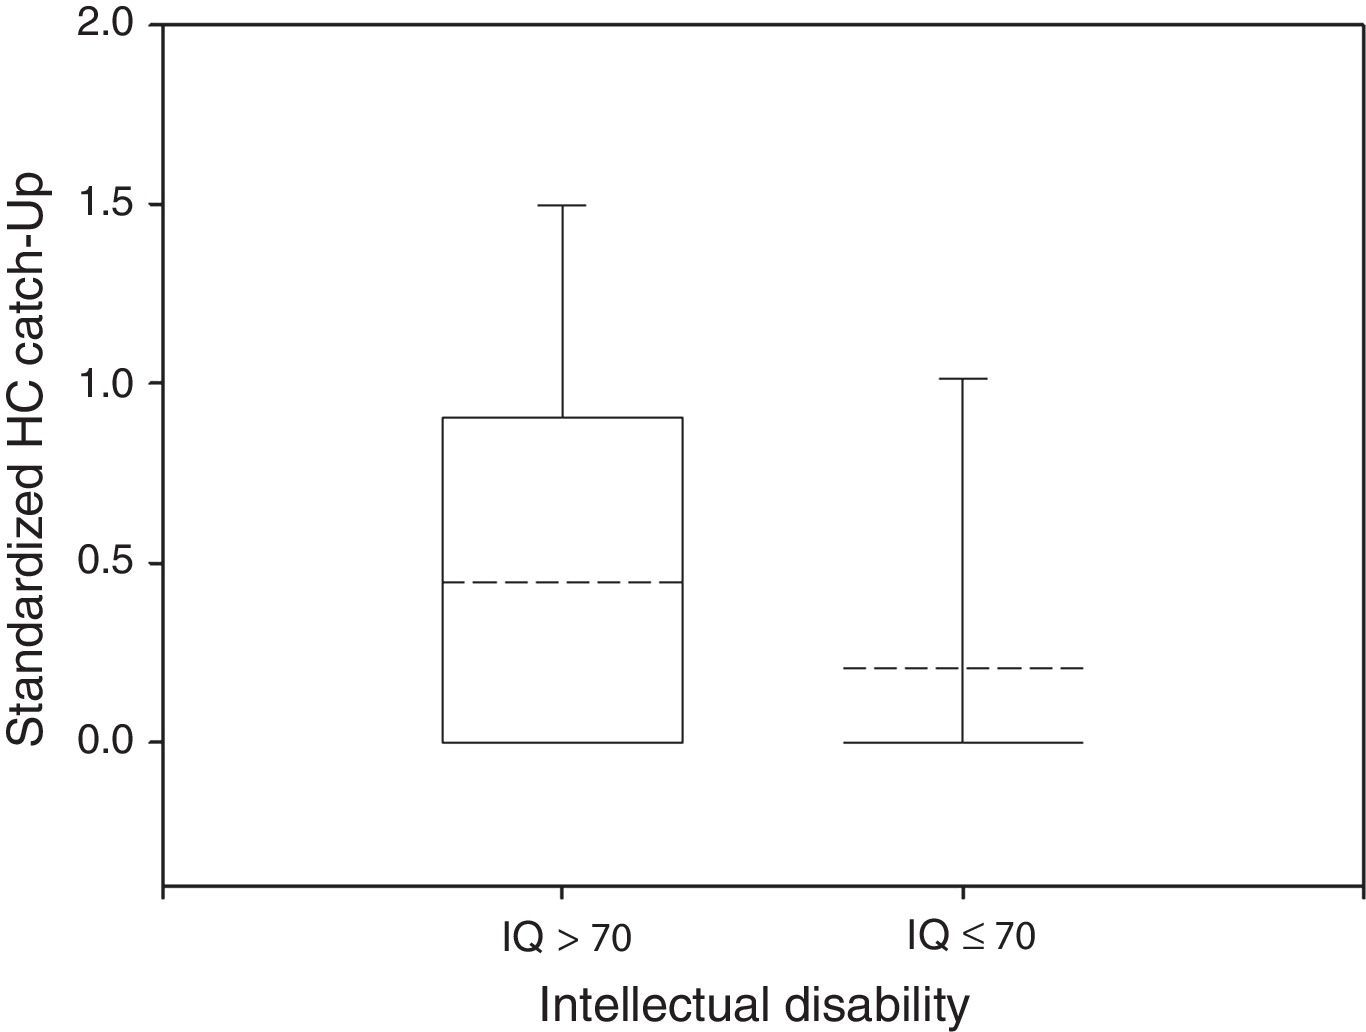
Box plot of standardized HC Catch-up by neurological outcome. The median and the mean are depicted within the boxes as solid and dashed lines, respectively. Non disabled group: n=34, mean=0.45, standard deviation=0.64, median=0, IQR=0.88. Disabled group: n=102, mean=0.21, standard deviation=0.56, median=0, IQR=0. Wilcoxon rank-sum test: P<0.05.
The multivariate discriminant analysis using HC Minimum, HC Drop and HC Catch-up as predictor variables showed that HC Minimum was the variable which contained more information. Discriminant analysis stepwise procedure accepted HC Drop in a second step but HC Catch-up was rejected as it did not add new information.
The Fisher linear discriminant function31 by intellectual disability was obtained as Z=−0.4HC Minimum −0.4HC Drop which, by including the mean values found for each predictor variable in intellectually disabled and non disabled groups, yielded a cut-off value of 1.73. By applying this function, 91% (31/34) of actually non intellectually disabled children had scores below the cut-off level and 58% (59/102) of disabled ones scored above this level. We propose the function Z′, by making Z′=Z/(−0.4), which can be expressed as: Z′=HC Minimum+HC Drop and by substituting the mean values for the predictor variables in the disability groups, yields a cut-off value (C) of −4.32. Therefore, when HC Minimum+HC Drop is below −4.32, the patient's HC growth pattern is indicative of intellectual disability: severe microcephaly. When HC Minimum + HC Drop is above −4.32, we define the patient's HC pattern as mild microcephaly and it is consistent with the absence of intellectual disability.
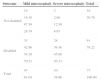
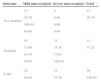
We analyzed the differences in concordance between the function outcome prediction and the actual intellectual status. The overall concordance was 66% and 91% (31/34) of non impaired and 95% (59/62) of severe microcephaly participants were correctly classified by the function. Nevertheless only in 58% (59/102) of impaired patients and only in 42% (31/74) of mild microcephaly ones, there was concordance between our function and the actual outcome (Table 1).
Outcome by HC growth function.
| Outcome | Mild microcephaly | Severe microcephaly | Total |
|---|---|---|---|
| HCmin+HCdrop≫−4.32 | HCmin+HCdrop<−4.32 | ||
| Non disabled | 31 | 3 | 34 |
| IQ≫71 | 22.79 | 2.21 | 25.00 |
| 91.18 | 8.82 | ||
| 41.89 | 4.84 | ||
| Disabled | 43 | 59 | 102 |
| IQ<71 | 31.62 | 43.38 | 75.00 |
| 42.16 | 57.84 | ||
| 58.11 | 95.16 | ||
| Total | 74 | 62 | 136 |
| 54.41 | 45.59 | 100.00 | |
In every cell, from the top: frequency, percentage, row percentage, column percentage.
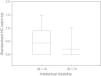
We also analyzed the differences in concordance for each one of the five aetiological clinical presentations proposed by Baxter et al.12 There were only three cases in the familial group and we decided to discard them. As depicted in Table 2, the presentations with a higher concordance were symptomatic and mixed ones. We decided to merge them considering that in all mixed patients there was, at least, one pathogenic event contributing to microcephaly. The rest of the participants from idiopathic and syndromic presentations were also merged into a second group, bearing in mind that most of patients with primary or genetic microcephalies belonged to them.
Outcome prediction by aetiological group.
| Group | HC function prediction | Total | |||
|---|---|---|---|---|---|
| Correct IQ≫71 and HCmin+HCdrop≫−4.32 | Correct IQ<71 and HCmin+HCdrop<−4.32 | Error IQ≫71 and HCmin+HCdrop<−4.32 | Error IQ<71 and HCmin+HCdrop≫−4.32 | ||
| Idiopathic | 6 | 17 | 0 | 15 | 38 |
| 4.51 | 12.78 | 0.00 | 11.28 | 28.57 | |
| 15.79 | 44.74 | 0.00 | 39.47 | ||
| 20.69 | 28.81 | 0.00 | 34.88 | ||
| Syndromic | 8 | 11 | 2 | 18 | 39 |
| 6.01 | 8.27 | 1.50 | 13.53 | 29.32 | |
| 20.51 | 28.20 | 5.13 | 46.15 | ||
| 27.59 | 18.64 | 100.00 | 41.86 | ||
| Symptomatic | 11 | 25 | 0 | 9 | 45 |
| 8.27 | 18.80 | 0.00 | 6.77 | 33.83 | |
| 24.44 | 55.55 | 0.00 | 20.00 | ||
| 37.93 | 42.37 | 0.00 | 20.93 | ||
| Mixed | 4 | 6 | 0 | 1 | 11 |
| 3.01 | 4.51 | 0.00 | 0.75 | 8.27 | |
| 36.36 | 54.54 | 0.00 | 9.09 | ||
| 13.79 | 10.17 | 0.00 | 2.33 | ||
| Total | 29 | 59 | 2 | 43 | 133 |
| 21.80 | 44.36 | 1.50 | 32.33 | 100.00 | |
In every cell, from the top: frequency, percentage, row percentage, column percentage.
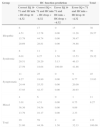
The two resulting compounded groups showed a statistically significant different concordance between function prediction and outcome reaching a higher level of 82% (46/56) in the symptomatic-mixed group and of only 54% (42/77) in the idiopathic-syndromic one (P-value=0.0002, Tables 3 and 4).
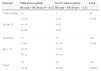
Idiopathic-syndromic group.
| Outcome | Mild microcephaly | Severe microcephaly | Total |
|---|---|---|---|
| Not disabled | 14 | 2 | 16 |
| 18.18 | 2.60 | 20.78 | |
| 87.50 | 12.50 | ||
| 29.79 | 6.67 | ||
| Disabled | 33 | 28 | 61 |
| 42.86 | 36.36 | 79.22 | |
| 54.10 | 45.90 | ||
| 70.21 | 93.33 | ||
| Total | 47 | 30 | 77 |
| 61.04 | 38.96 | 100.00 | |
In every cell, from the top: frequency, percentage, row percentage, column percentage.
Symptomatic-mixed group.
| Outcome | Mild microcephaly | Severe microcephaly | Total |
|---|---|---|---|
| Not disabled | 15 | 0 | 15 |
| 26.79 | 0.00 | 26.79 | |
| 100.00 | 0.00 | ||
| 60.00 | 0.00 | ||
| Disabled | 10 | 31 | 41 |
| 17.86 | 55.36 | 73.21 | |
| 24.39 | 75.61 | ||
| 40.00 | 100.00 | ||
| Total | 25 | 31 | 56 |
| 44.64 | 55.36 | 100.00 | |
In every cell, from the top: frequency, percentage, row percentage, column percentage.
Serial HC measurement can be used to identify markers of neurological outcome. Our results confirm the importance of taking into account not only the degree of microcephaly, as reflected by HC Minimum, but also the fall in head growth velocity reflected by HC Drop. This approach has been used in some conditions leading to microcephaly, as in hypoxic-ischaemic encephalopathy,13 but we have broadened this concept to include most conditions where microcephaly is a relevant clinical sign. In one recent evidence-based review report from the American Academy of Neurology32 a cut-off of −3 SD was established to define severe microcephaly and a high risk of developmental impairments. Our study may refine this statement by adding the predictive value of the amount of HC Z-score drop that many times precedes the minimum Z-score achieved by the patient. In this regard we were able to classify children's HC between −2 and −3 SD as a severe microcephaly, because they suffered a significant loss of percentiles before this measurement; and also patients who attained the −3 to −4.32 SD level as a mild microcephaly because they did not. It is noteworthy that using this approach the level of concordance in our sample for the symptomatic and mixed compound group was 82%, similar to the aforementioned Ashwal et al. review; in our sample this level could not be reached using the minimum HC only, as explained in the results of multivariate discriminant analysis.
A general feature of data for both HC Minimum and HC Drop was a lower value (more negative) of the mean and the median in the intellectually impaired group (Figs. 1 and 2). The statistical measurements of dispersion (standard deviation or IQR) were higher in the impaired group for both variables with respect to the non intellectually disabled group. Regarding HC Catch-up (Fig. 3), the mean but not the median was higher for the non disabled group and there was a wider spread distribution, as indicated by the IQR, in comparison with the disabled group.
In our hospital based population study only 25% of patients assessed had normal intelligence in contrast with the children from the collaborative project where the IQ of children with HC under −2 SD scored above 70 in 90% of cases.9 It is worth noting that, when only children under −3 SD were considered, the proportion of patients from the collaborative project with an IQ above 70 fell to 49%. This finding is consistent with our observation pointing to the significant relationship between HC Minimum and Intellectual Disability. Considering the higher proportions of intellectual impairment and microcephaly in our hospital based population, in comparison with the general population, the application of our results to children from the community should be done by adjusting these proportions according to the Bayes’ theorem.
The presence in 23% of participants of a head growth catch-up after the smallest registered z-score microcephaly reached, was significantly associated to a better outcome. Interestingly this variable did not add any information to HC Minimum and HC Drop in order to distinguish impaired from normal participants as it was refused by the discriminant analysis method to create the Intellectual Disability prediction function. The fact that catch-up growth appears late in child neurodevelopment, after the HC Minimum is already reached, it also reduces its value to anticipate outcome.
Although we used a clinical classification for children with acquired microcephaly we found their group definitions useful for our wider sample. As a matter of fact, the British study12 in which this classification was proposed, was unable to find associations between growth patterns and IQ while our multivariate discriminant analysis approach succeeded. Some differences between the two studies are: the number of participants (51 participants in contrast to 136 in our sample), the number of MRI results available (29 patients in contrast with 112 in our sample) and the measurement of the height of the patients and the HC of the parents in the Baxter et al. study, which was not required in our clinical protocol.
We hypothesize that in secondary or symptomatic microcephalies the use of head growth patterns to predict neurological impairment is more reliable than in primary or idiopathic microcephaly. The reason for the higher concordance between head growth and prognosis in aetiologies like hypoxic-ischaemic encephalopathy, haemorrhage, infarction and infection may lie in the resulting broad parenchymal damage and extensive cell death leading to the loss of brain growth potential and associated neurological deficits.
This study is a contribution to a better understanding of pathological head growth and supports the definition of a head growth failure syndrome where head growth patterns defined by variables which take into account percentile changes over time are better prognostic tools than microcephaly itself.
In conclusion, in a sample of microcephalic patients from a tertiary hospital, the concordance of neurological outcome and the HC growth function is higher in those patients with secondary microcephaly than in idiopathic cases or in those presenting as a multimalformation syndrome.
Please cite this article as: Coronado R, Macaya A, Giraldo J, Roig-Quilis M. Concordancia entre una funcion de crecimiento del perimetro cefalico y la discapacidad intelectual en relacion con la etiologia de la microcefalia. Anal Pediatr. 2015;83:109–116.
This work was the first oral presentation of the Parallel Session 12 on Foetal and Neonatal Neurology of the 10th European Paediatric Neurology Society Congress, Brussels, 25–28 September 2013. “Concordance between head circumference growth and neurological impairment among four clinical presentations of microcephaly” Eur J Paediatr Neuro 2013,17 supplement 1, S23.

Anales de Pediatría (English Edition) follows the Recommendations for the Conduct, Reporting, Editing and Publication of Scholarly Work in Medical Journals