


The optimal intake to improve protein metabolism without producing adverse effects in seriously ill infants has yet to be established. The aim of our study was to analyse whether an increased protein intake delivered through enteral nutrition would be associated with an improvement in nitrogen balance and serum protein levels in critically ill infants.
MethodsWe conducted a multicentre, prospective randomized controlled trial (December 2016-June 2019). The sample consisted of critically ill infants receiving enteral nutrition assigned randomly to 3 protein content groups: standard diet (1.7 g/dL), protein-enriched diet (2.7 g/dL) and high protein-enriched diet (5.1 g/dL). Blood and urine tests were performed, and we assessed nitrogen balance at baseline and at 3–5 days of the diet. We analysed variations in nitrogen balance and serum protein levels (total protein, albumin, transferrin, prealbumin, and retinol-binding protein) throughout the study period.
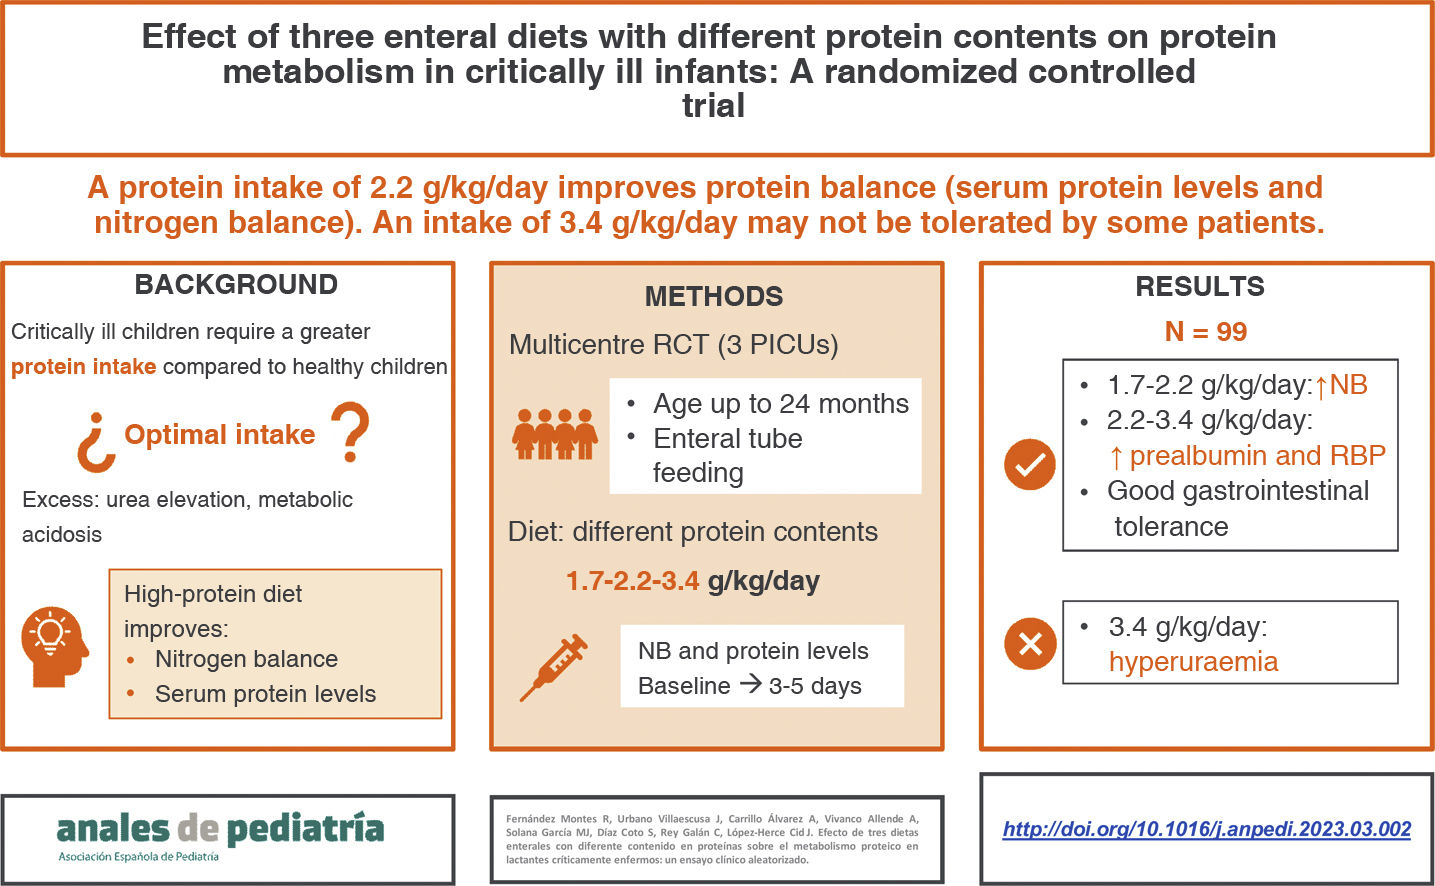
ResultsNinety-nine infants (33 per group) completed the study. We did not find any differences were between groups in demographic characteristics, severity scores or prescribed medications, except for corticosteroids, administered in a higher proportion of patients in the third group. We observed significant increases in prealbumin and retinol-binding protein levels in patients receiving the protein-enriched and high protein-enriched diets at 3–5 days compared to baseline. The nitrogen balance increased in all groups, but the differences were not significant in the high protein-enriched group. There were no differences in gastrointestinal tolerance. Patients fed high protein-enriched formula had higher levels of serum urea, with a higher incidence of hyperuraemia in this group.
ConclusionEnteral administration of higher amounts of protein improves serum protein levels in critically ill children. A protein intake of 2.2 g/kg/day is generally safe and well tolerated, whereas an intake of 3.4 g/kg/day may produce hyperuraemia in some patients.
No ha sido establecido cual es el aporte óptimo para mejorar el metabolismo proteico sin producir efectos adversos en lactantes gravemente enfermos. Nuestro objetivo fue analizar si un mayor aporte proteico a través de la nutrición enteral se relaciona con una mejoría en el balance proteico en lactantes críticamente enfermos.
Material y métodosSe diseñó un estudio multicéntrico, prospectivo, aleatorizado y controlado (diciembre 2016 a junio 2019). Se incluyeron lactantes críticamente enfermos con nutrición enteral, asignándose aleatoriamente a tres dietas con diferente contenido proteico: estándar (1,7 g/100 ml), hiperproteica (2,7 g/100 ml) e hiperproteica suplementada (5,1 g/100 ml). Se realizaron análisis de sangre y orina y se calculó el balance nitrogenado en el momento basal y tras 3–5 días de nutrición. Se analizó la variación del balance nitrogenado y proteínas séricas (proteínas totales, albúmina, transferrina, prealbúmina y proteína ligada al retinol) a lo largo del periodo de estudio.
Resultados99 lactantes (33 por grupo) completaron el estudio. No se encontraron diferencias entre grupos en características demográficas, puntuaciones de gravedad y otros tratamientos recibidos, salvo corticoides, administrados en una mayor proporción de pacientes del tercer grupo. Tuvo lugar un aumento significativo de los niveles de prealbúmina y proteína ligada al retinol en los grupos con nutrición hiperproteica e hiperproteica suplementada. El balance nitrogenado aumentó en todos los grupos, pero este incremento no fue significativo en el grupo de nutrición hiperproteica suplementada. No se encontraron diferencias en cuanto a tolerancia gastrointestinal. Los pacientes con nutrición hiperproteica suplementada presentaron niveles superiores de urea sérica y mayor incidencia de hiperuremia.
Conclusionesla administración enteral de altas cantidades de proteínas mejora los niveles de proteínas séricas en lactantes críticamente enfermos. Un aporte proteico de 2,2 g/kg/día es generalmente seguro y bien tolerado, mientras que aportes de 3,4 g/kg/día pueden producir hiperuremia en algunos pacientes.
The metabolic response to stress in critical illness, after a short initial phase of reduced metabolism with a decrease in oxygen consumption and energy expenditure that usually only lasts a few hours, is characterised by a hypercatabolic state regulated by a series of hormonal changes, with elevation of serum levels of insulin, glucagon, cortisol, catecholamines and proinflammatory cytokines resulting in increased glucose and lipid turnover rates and, more characteristically, an increased protein turnover.1,2 Amino acids from skeletal muscle are used in the liver to synthesise inflammatory mediators, structural proteins and glucose, the primary energy source, through gluconeogenesis.3 Thus, there is an increase in both protein synthesis and breakdown, with a predominance of the latter, yielding a net negative protein balance.2,3
The administration of exogenous protein through the diet does not halt this response. However, protein synthesis may be stimulated by ensuring an adequate energy and protein intake, so early initiation of nutritional support contributes to a quicker achievement of the nutritional goals set for the patient, improving clinical outcomes in critically ill children.4–8
There is limited evidence on the subject of nutritional support in critically ill children. Current guidelines,9–11 which are chiefly based on expert opinion, evidence extrapolated from studies in adults and a small number of paediatric studies,12,13 propose a minimum protein intake of 1.5 g protein/kg/day to prevent protein deficiency, although they do acknowledge that protein requirements in infants may be as high as 2.5–3 g/kg/day.
Previous studies suggest that the administration of formula with a high protein content in infants facilitates the achievement of a positive nitrogen balance (NB),14–17 improving protein serum levels, for instance, levels of retinol-binding protein (RBP), prealbumin15,17,18 and amino acids.14,19
The administration of protein amounts greater than 3 g/kg/day has been associated with the development of hyperuraemia and metabolic acidosis as the most frequent adverse events,14,17,20 with no evidence of relevant gastrointestinal complications.15–22
In additional to nutritional support, there are other factors that could affect protein metabolism in critically ill children, such as changes in hepatic or renal function, the presence of burns or the administration of certain treatments. Although the literature on the subject is contradictory,23 traditionally it has been hypothesised that the administration of corticosteroids, which are used frequently in intensive care, could increase the elimination of urea through the urine, thereby decreasing the NB.24,25
The aim of our study was to analyse whether an increased protein intake delivered through enteral nutrition would be associated with an improvement in protein metabolism, assessed through changes in the NB and serum protein levels (total protein, albumin, prealbumin, transferrin and RBP) and assess its safety.
Material and methodsStudy designWe conducted a prospective open-label randomised controlled interventional study in the paediatric intensive care units (PICUs) of 3 university hospitals in Spain between December 2016 and June 2019.
ParticipantsThe study included infants and toddlers aged 1–24 months admitted to the PICU who were going to receive enteral nutrition (EN) for at least 72 h.
We excluded patients with diabetes mellitus or other inborn errors of metabolism, receiving parenteral nutrition or intravenous sodium bicarbonate, requiring renal replacement therapy or who were exclusively breastfeed or fed with special formula.
The following were the criteria established for discontinuation of nutritional supplementation: development of hyperproteinaemia (total protein >85 g/L) or hyperuraemia (serum urea >80 mg/dL) in the absence of impaired renal function (according to the Kidney Disease Improving Global Guidelines [KDIGO] criteria)26 or hypercatabolism (underlying disease and negative NB).
Participants were recruited by convenience sampling.
We calculated the sample size using the EPIDAT software, version 3.1. The estimated minimum sample size required for a level of significance of 5%, a power of 80% and the detection of a minimum standardised mean difference of 0.9 was 30 patients per group (including the Bonferroni correction).
Recruited patients were assigned in the order they were included to each of the 3 established dietary intervention arms (control group and 2 experimental groups) using a restrictive block randomisation table generated with the EPIDAT 3.1 software (General Public Health Administration of the Department of Health of the Regional Government of Galicia, Spain, in collaboration with the Health Information and Analysis team of the Pan American Health Organization).
InterventionAll patients received exclusive EN through a nasogastric or transpyloric tube, initiated within 24 h of admission.
The patients included in the control group, or standard enteral nutrition (SEN) group, received the customary protein amount and were fed a standard infant formula (Nidina 1, Nestlé, Barcelona). The two experimental groups received a polymeric protein-dense formula (Infatrini, Nutricia, Madrid): patients in the protein-enriched nutrition (PEN) group received this formula alone, while patients in the high protein-enriched nutrition (HPEN) group received the same formula with the addition of 2.6 g protein per 100 mL in the form of a modular protein supplement (non-hydrolysed whey powder, Resource Protein Instant, Nestlé, Barcelona) (Table 1). The bottles were prepared in the unit itself or in the department of nutrition and dietetics of the hospital, depending on the centre, and both the staff and the family of the patient were aware of the composition of the administered formula.
Nutrition was delivered by continuous infusion, starting with a rate of 0.5−1 mL/kg/h, increasing the rate by 0.5−1 mL/kg every 3–4 hours if it was well tolerated, until achieving an energy intake of 65 kcal/kg/day or meeting the energy requirements determined by means of indirect calorimetry (IC) in patients in whom it was performed. Switching from EN delivered in continuous infusion to bolus delivery in patients whose clinical improvement allowed it was not an exclusion criterion, as the daily intake remained the same.
The follow-up ended after 7 day of EN or before if the patient was discharged from the PICU or met any of the criteria for discontinuation mentioned above.
Patients were followed up for 7 days. At baseline (first 24 h) and by the end of follow-up (day 3–5 from initiation of EN) samples of blood and urine were collected, with additional performance of IC (Datex S5 monitor, E-COVX, GE Healthcare/Datex-Ohmeda, Helsinki, Finland) if it was available and the patient met the required technical criteria.27
Data collectionWe collected demographic and anthropometric data: age, sex, weight, length and diagnosis at admission. We assessed severity and organ dysfunction by means of the Pediatric Index of Mortality 2 (PIM2), Pediatric Risk of Mortality (PRISM) and Pediatric Logistic Organ Dysfunction (PELOD) scores. We documented the presence of shock and of infection and recorded respiratory parameters and vital signs. Blood samples were collected for analysis of protein, creatinine and urea serum levels and other blood chemistry tests, such as the C-reactive protein (PCR) test and blood gas analysis, at baseline and the end of follow-up.
We documented the total energy and protein intake in addition to other administered treatments (muscle blockers, sedation and analgesia, diuretics, corticosteroids and vasoactive drugs) and calculated the vasoactive-inotropic score.28
The NB was calculated by subtracting nitrogen losses from the nitrogen intake, including urinary, faecal and miscellaneous losses (dermal, sweat, integumentary)29 with the following formula:
where 75 mg/kg represents faecal and miscellaneous nitrogen losses.30 The total urinary nitrogen (TUN) excretion was estimated as the urinary urea nitrogen concentration (mg/kg) × 1.25 to include nitrogen losses in the form of ammonia, creatinine, uric acid and amino acids.31 We used a factor of 6.25 to transform the protein intake into the estimated nitrogen intake, which represents the mean amount of nitrogen per gram of protein.
To assess the safety of the protein-dense diets, we documented any gastrointestinal complications in addition to any other unexpected adverse events. The need to suspend EN was determined by the physician in charge of the patient at the given time.
All the data were collected prospectively from the health records of the patient and recorded in a form developed for the purpose, and the principal investigator was responsible for the safekeeping of these forms, the data of which were subsequently anonymised applying the code assigned to the patient at enrolment in the study and entered in a database designed with the software SPSS (IBM, Armonk, USA).
Statistical analysisThe primary endpoint was the change in NB values in mg/kg/day throughout the follow-up (final NB – baseline NB).
The secondary endpoints were the change from baseline to the final assessment in serum protein levels (total protein, albumin, prealbumin, transferrin and RBP), the incidence per 1000 patient days of hyperuraemia (serum urea >80 mg/dL) or hyperproteinaemia (total protein >85 g/L), which were criteria for withdrawal from the study, and the incidence per 1000 patient days of gastrointestinal complications (abdominal distension, vomiting, diarrhoea and high residual gastric volume) and metabolic acidosis (pH < 7.35 with bicarbonate <24 mmol/L).
The statistical analysis was performed with the R free software environment (www.r-project.org), and we carried out an intention-to-treat analysis. We have summarised quantitative variables as mean and standard deviation (SD) or median and interquartile range (IQR). We compared groups using the Student t test in the case of normally distributed variables and otherwise with the Kruskal–Wallis test. We assessed the normality of the distribution with the Kolmogorov–Smirnov test.
We summarised qualitative variables as absolute and relative frequencies and compared them between groups by means of the χ2 test.
The changes in variables between baseline and the final assessment were assessed with the Student t test for paired samples. We fitted mixed-effects logistic regression models to assess the variation in these variables adjusted for the energy intake.
We expressed the incidence of the most relevant adverse events with 95% confidence intervals (CIs). Groups were compared with the bootstrap method. Statistical significance was defined as a P value of less than 0.05.
Ethical considerationsThe study was approved by the respective research ethics committees and registered in ClinicalTrials.gov (NCT03901742).32 We obtained informed consent from the parents or legal guardians of the patients.
ResultsDemographic characteristicsWe recruited 112 patients between December 2016 and June 2019, of who 99 completed the follow-up, distributed evenly into the 3 diet groups (Fig. 1); they were aged 1–24 months (median, 4 months) and 36.4% were female.

In the overall sample, the median severity scores at admission were 2.3 in the PRISM, 1.0 in the PIM2 and 0.1 in the PELOD, the median length of stay was 6 days and the mortality was 1%. More than half of the patients had infection, while only 5.1% were in shock. At the time of admission, 42.3% required mechanical ventilation. In addition, 35.4% received inotropic support, with a median vasoactive-inotropic score of 0. Muscle blockers were administered to 9.2% of patients, and corticosteroids to 8.1% (Table 2). The reason for admission was respiratory failure in 60% of the patients, postoperative care after cardiac surgery for 28.3% and other diagnoses in the remaining 11.1%.
Comparison of baseline characteristics and main endpoints in the three study groups.
| Patient characteristics | Total (n = 99) | Standard diet (n = 33) | Protein-enriched diet (n = 33) | High protein-enriched diet (n = 33) | P |
|---|---|---|---|---|---|
| Age, monthsa | 4 (4.5) | 4 (4.5) | 4 (5.5) | 5 (5.0) | .189 |
| Female sex, n (%) | 36 (36.4%) | 8 (24.2%) | 14 (42.4%) | 14 (42.4%) | .265 |
| Peso, kgb | 5.9 ± 2.2 | 5.4 ± 1.8 | 5.8 ± 2.3 | 6.4 ± 2.5 | .179 |
| Longitud, cmb | 60.6 ± 8.3 | 58.7 ± 5.8 | 60.9 ± 9.1 | 62.1 ± 9.3 | .461 |
| PRISM, %a | 2.3 (3.9) | 2.3 (3.5) | 2.8 (4.9) | 2.2 (4.9) | .867 |
| PIM2, %a | 1.0 (2.4) | 0.8 (1.8) | 1.8 (3.2) | 0.9 (1.7) | .259 |
| PELOD, %a | 0.1 (1.0) | 0 (0.1) | 0.1 (1.3) | 0.0 (0.1) | .265 |
| Infection | 60.2% | 66.7% | 50.0% | 63.6% | .342 |
| Shock | 5.1% | 3.0% | 9.4% | 3.0% | .444 |
| CMV | 42.3% | 33.3% | 51.6% | 42.4% | .344 |
| VISa | 0 (12.0) | 0 (12.0) | 0 (16.0) | 0 (10.0) | .342 |
| Muscle blockers | 9.1% | 9.1% | 6.1% | 12.1% | .906 |
| Corticosteroids | 8.2% | 3.1% | 3.1% | 18.2% | .047 |
| Length of stay in PICU, daysa | 6.0 (7.0) | 6.0 (8.0) | 6.0 (6.0) | 6.5 (7.0) | .658 |
| Mortality | 1.0% | 3.0% | 0.0% | 0.0% | 1.000 |
CMV, conventional mechanical ventilation; PELOD, Pediatric Logistic Organ Dysfunction; PICU, paediatric intensive care unit; PIM2, Pediatric Index of Mortality 2; PRISM, Pediatric Risk of Mortality; VIS, vasoactive-inotropic score.
We did not find significant differences between groups in any clinical or anthropometric variable nor the treatments received, with the exception of corticosteroid drugs, which were administered to a higher proportion of patients in the HPEN group (P = .047) (Table 2).
Nutrient intake and energy expenditureThe mean energy intake administered through EN at the end of the follow-up was 74.2 kcal/kg/day (SD, 25.3), and was greater in patients in the HPN group (P = .041). The final mean protein intake was 2.4 g/kg/day (SD, 1.1), and the protein intake was greater the greater the relative protein content of the administered formula (Table 3).
Mean energy and protein intake achieved at end of follow-up.
| Formula | Total (n = 99) | Standard diet (n = 33) | Protein-enriched diet (n = 33) | High protein-enriched diet (n = 33) | P |
|---|---|---|---|---|---|
| Energy intake (kcal/kg/day) | 74.2 (25.3) | 67.1 (21.3) | 84.3 (31.5) | 71.2 (18.5) | .041 |
| Protein intake (g/kg/day) | 2.4 (1.1) | 1.7 (0.6) | 2.2 (0.8) | 3.4 (1.2) | <.001 |
Values expressed as mean ± standard deviation.
Sixteen of the 99 patients underwent IC, and were found to have a mean energy requirement of 45.2 kcal/kg/day (SD, 8.9) at baseline and 50.8 kcal/kg/day (SD, 13.4) in the final assessment. We did not find significant changes in the basal energy expenditure (BEE) throughout the study in any of the three groups (Table 4). There were also no significant differences between the 3 groups between baseline (P = .919) and the end of the follow-up (P = .315).
Changes in basal energy expenditure, measured by indirect calorimetry, between baseline and the end of follow-up.
| BEE (kcal/kg/day) | Total (n = 16) | Standard diet (n = 6) | Protein-enriched diet (n = 6) | High protein-enriched diet (n = 4) |
|---|---|---|---|---|
| Baseline | 45.2 ± 8.9 | 44.2 ± 11.2 | 46.1 ± 7.9 | 45.4 ± 8.9 |
| Final | 50.8 ± 13.4 | 42.8 ± 15.6 | 55.9 ± 11.9 | 55.2 ± 6.8 |
| Change | 5.6 ± 11.8 | –1.4 ± 12.0 | 9.7 ± 12.3 | 9.7 ± 6.7 |
| P | .078 | .791 | .111 | .062 |
BEE, basal energy expenditure.
Values expressed as mean ± standard deviation.
Urine samples were collected for 87 patients (87.9%); in 36 (41.4%), it was a 24 -h urine sample. In all other patients, a single random specimen was collected with a urine collection bag, and we estimated the daily urinary nitrogen excretion by extrapolation based on the measurement of the total daily urine output.
The TUN at the end of follow-up was higher in the HPEN group (mean, 466.4 mg/kg; SD, 232.6) compared to the SEN group (mean, 172.2 mg/kg; SD, 180.3) and the PEN group (mean, 213.2; SD, 169 mg/kg) (P < .001).
The NB was negative in 72.4% of the patients at baseline, and remained negative in 38.2% at the end of follow-up. As can be seen in Table 5, patients in the SEN and PEN groups exhibited significant increases in the NB, with a mean increase of 150 (SD, 274) and 149 (SD, 201) mg/kg/day respectively, whereas the change in the HPEN group was not statistically significant (mean, 96; SD, 384 mg/kg/day; P = .212). We obtained similar P values after adjusting the analysis for the energy intake.
Changes in nitrogen balance and serum protein levels between baseline and the end of follow-up.
| Total | Standard diet | Protein-enriched diet | High protein-enriched diet | |
|---|---|---|---|---|
| Nitrogen balance (mg/kg/day) | n = 83 | n = 28 | n = 29 | n = 26 |
| Baseline | –103 ± 211 | –111 ± 180 | –107 ± 197 | –92 ± 261 |
| Final | 29 ± 207 | 39 ± 193 | 42 ± 207 | 5 ± 225 |
| Change | 133 ± 290 | 150 ± 274 | 149 ± 201 | 96 ± 384 |
| P | <.001 | .008 | <.001 | .212 |
| P adjusteda | <.001 | <.001 | <.001 | .188 |
| Total protein (g/L) | n = 87 | n = 29 | n = 31 | n = 27 |
| Baseline | 5.3 ± 0.7 | 5.3 ± 0.7 | 5.1 ± 0.7 | 5.3 ± 0.8 |
| Final | 5.5 ± 0.8 | 5.5 ± 0.7 | 5.5 ± 0.7 | 5.5 ± 1.1 |
| Change | 0.2 ± 0.9 | 0.1 ± 0.8 | 0.3 ± 0.8 | 0.2 ± 1.0 |
| P | .012 | .348 | .023 | .270 |
| P adjusteda | .012 | .447 | .031 | .315 |
| Albumin (g/L) | n = 86 | n = 29 | n = 31 | n = 26 |
| Baseline | 3.6 ± 0.6 | 3.7 ± 0.5 | 3.5 ± 0.6 | 3.6 ± 0.6 |
| Final | 3.6 ± 0.6 | 3.6 ± 0.4 | 3.6 ± 0.5 | 3.6 ± 0.7 |
| Change | 0.0 ± 0.6 | 0.1 ± 0.5 | 0.1 ± 0.7 | 0.0 ± 0.6 |
| P | .830 | .363 | .232 | .768 |
| P adjusteda | .818 | .323 | .326 | .826 |
| Prealbumin (mg/L) | n = 77 | n = 23 | n = 29 | n = 25 |
| Baseline | 10.2 ± 3.7 | 9.4 ± 3.2 | 10.2 ± 3.7 | 11.0 ± 4.0 |
| Final | 13.7 ± 6.3 | 11.0 ± 4.6 | 13.4 ± 5.3 | 16.6 ± 7.5 |
| Change | 3.5 ± 6.0 | 1.6 ± 5.3 | 3.2 ± 5.0 | 5.6 ± 7.3 |
| P | <.001 | .156 | .002 | .001 |
| P adjusteda | <.001 | .254 | .004 | .001 |
| RBP (mg/dL) | n = 33 | n = 9 | n = 11 | n = 13 |
| Baseline | 2.1 ± 1.1 | 2.1 ± 0.9 | 2.2 ± 1.5 | 2.1 ± 0.8 |
| Final | 3.8 ± 2.1 | 2.2 ± 1.1 | 3.5 ± 2.2 | 5.1 ± 1.6 |
| Change | 1.7 ± 1.7 | 0.1 ± 1.0 | 1.3 ± 1.4 | 3.0 ± 1.3 |
| P | <.001 | .711 | .011 | <.001 |
| P adjusteda | <.001 | .724 | .011 | <.001 |
| Transferrin (g/L) | n = 71 | n = 20 | n = 26 | n = 25 |
| Baseline | 177.5 ± 58.4 | 184.0 ± 58.3 | 175.3 ± 55.4 | 174.7 ± 63.4 |
| Final | 193.4 ± 54.6 | 186.7 ± 45.6 | 194.8 ± 59.9 | 197.3 ± 57.0 |
| Change | 15.9 ± 48.2 | 2.6 ± 41.6 | 19.5 ± 53.2 | 22.6 ± 47.6 |
| P | .007 | .779 | .073 | .026 |
| P adjusteda | .007 | .912 | .075 | .013 |
RBP, retinol-binding protein.
Values expressed as mean ± standard deviation.
In the overall sample, there was improvement in all protein values under study with the exception of albumin. When we studied the changes in each group, we found that the increase in total protein was only significant in the PEN group. In the PEN and HPEN groups, there was an increase in prealbumin levels (mean of 3.2 mg/L [SD, 5.0] and 5.6 mg/L [SD, 7.3], respectively) and RBP (mean of 1.3 mg/dL [SD, 1.4] and 3.0 mg/dL [SD, 1.3], respectively), which was greater in the group with a greater protein intake. Transferrin levels increased only in the HPEN group (Table 5).
Impact of corticosteroid administration on the changes in NB and serum protein levelsA greater proportion of patients in the HPEN group received corticosteroids (methylprednisolone at 1 mg/kg/day or dexamethasone at 0.6 mg/kg/day), so we fitted a mixed-effects logistic regression model to assess the impact of this treatment in protein metabolism. We did not find a significant effect on the change in NB (P = .227), total protein (P = .348), albumin (P = .953), prealbumin (P = .133), RBP (P = .490) or transferrin (P = .847).
Safety of the protein-enriched and high protein-enriched dietsFifteen patients withdraw early from the study: 8 due to development of hyperuraemia (1 in the PEN group and 7 in the HPEN group), 1 patient in the PEN group due to diarrhoea and 1 in the HPEN due to feeding tube obstruction. Four children with chylothorax required a special formula, and 1 patient with shock required fluid restriction, which precluded continuation of EN.
Serum urea levels were higher the greater the protein intake (P < 0.001), and the incidence of hyperuraemia was greatest in the HPEN group, followed by the PEN group (P = .003) (Table 6). There were no cases of hyperproteinaemia or metabolic acidosis.
Urea levels at the end of follow-up and incidence of adverse events.
| Total (n = 99) | Standard diet (n = 33) | Protein-enriched diet (n = 33) | High protein-enriched diet (n = 33) | P | |
|---|---|---|---|---|---|
| Serum urea (mg/dL)a | 21.0 (29.5) | 11.0 (21.0) | 16.0 (23.5) | 36.5 (31.5) | <.001 |
| Hyperuraemiab | 15.4 (6.0−26.4) | 0.0 (0.0−0.0) | 5.6 (0.0−18.6) | 41.9 (17.3−71.0) | .003 |
| Diarrhoeab | 7.7 (1.8−16.1) | 0.0 (0.0−0.0) | 16.7 (0.0−37.6) | 6.0 (0.0−19.5) | .197 |
| Abdominal distensionb | 23.2 (11.8−35.1) | 23.4 (6.0−42.8) | 22.2 (5.2−45.5) | 24.0 (6.0−45.2) | .989 |
| Temporary suspensionb | |||||
| High residual gastric volume | 3.9 (0.0−10.0) | 0.0 (0.0−0.0) | 0.0 (0.0−0.0) | 11.9 (0.0−30.7) | .130 |
| Abdominal distension | 1.9 (0.0−6.2) | 0.0 (0.0−0.0) | 5.6 (0.0−18.2) | 0.0 (0.0−0.0) | .466 |
| Infusion rate lowered due to gastrointestinal adverse eventb | 7.7 (1.8−16.2) | 0.0 (0.0−0.0) | 5.6 (0.0−19.2) | 18.0 (0.0−37.9) | .150 |
Hyperuraemia: serum urea >80 mg/dL.
We did not find differences in enteral feeding tolerance between groups (Table 6).
DiscussionOur study analysed the impact of enteral feeding with 3 levels of protein content on the NB, used as a surrogate of protein balance, and serum protein levels in critically ill infants.
Adequate enteral protein intake in critically ill children has been associated with a decrease in morbidity, mortality5 and duration of mechanical ventilation.6–8 However, the optimal protein intake has yet to be established.
Protein turnover has a high energetic cost,3 and therefore protein synthesis does not depend solely on protein intake, but also on an adequate energy intake. Authors of previous studies have proposed minimum thresholds of 57 kcal/kg/day and 1.5 g of protein/kg/day to achieve a positive protein balance.12,13 Our patients received a mean of 74.2 kcal/kg/day, above the mean BEE measured with CI, which should be sufficient to avoid limiting protein synthesis, and a protein intake greater than 1.5 g/kg/day, exceeding the amount proposed by the main international paediatric intensive care guidelines.9 However, the patients in the HPEN received 3.4 g de proteins/kg/day, an amount exceeding the recommended intake for infants.14–16,19
After 3–5 days of EN, there was improvement in the NB in the entire sample. In fact, the NB turned positive in 27.3% of the patients, supporting the hypothesis that early initiation of EN is essential to prevent a shift towards catabolism and the maintenance of a negative protein balance in critically ill patients.
When we analysed the variation in the NB based on the diet, we found similar increases in the SEN and PEN groups. However, despite receiving a greater amount of protein, children in the HPEN exhibited a lesser increase in the NB, although the difference was not statistically significant. A large proportion of patients in this group received corticosteroids (Table 2). Past evidence has linked the use of corticosteroids with decreases in NB on account of the increased excretion of urea in the urine.24,25 However, we did not find a significant association between the administration of corticosteroids and protein metabolism in our sample.
Several clinical trials that analysed the impact of a high-protein diet found an association between a greater protein intake, faster acquisition of nutritional goals and improvement in the NB in critically ill children with a protein intake of approximately 2.7 g/kg/day compared to 1.5 g/kg/day.14–16
In our study, the patients who received PEN or HPEN exhibited increases in prealbumin and RBP levels, which were greater the greater the protein intake. Prealbumin and RBP are both proteins with a short half-life and a low volume of distribution, and are considered early and sensitive nutritional markers.33 Significant increases in the levels of these proteins have been described previously in critically ill children fed a protein-enriched diet.15,18 However, these changes must be interpreted with caution, as the liver synthesis of these proteins may decrease on account of the prioritization of the synthesis of acute-phase reactants under inflammatory conditions.33
Protein supplementation entails an increase in osmolality in the formula that may have an impact on gastrointestinal tolerance.34 In agreement with previous studies,14,15,34 in which the main adverse events were diarrhoea, abdominal distension and high residual gastric volume, all of them infrequent and tolerable,16,18 we did not find relevant gastrointestinal complications in patients fed a protein-enriched diet. However, one patient in the HPEN group experienced obstruction of the feeding tube attributed to the excessive density of the formula, which evinces the importance of not only the osmolality, but also the physical properties of the formula to be administered.
An excessive protein intake leads to the oxidation of the excess protein, thus promoting an elevation of urea levels in blood. In previous studies,14,20 patients treated with HPEN had higher urea levels, with a greater incidence of hyperuraemia (urea >80 mg/dL). This suggests that while the enteral administration of approximately 2.2 g/kg/day de proteins improves protein metabolism in critically ill infants, an intake of 3.4 g/kg/day could be excessive in these patients.
LimitationsOur study has several limitations on account of the methodology. First of all, a large proportion of patients did not carry urinary catheters, so the urine samples in many patients were single random specimens. Although some studies have found an acceptable correlation between the measurement of TUN in 24 -h and timed shorter-term urine samples,35,36 there is evidence that the urinary excretion of urea varies widely in critically ill children, with reported TUN values ranging from 100 to 1000 mg/kg/day in the previous literature.14,37–39 This compromises the reliability of measurements of TUN in timed short-term or single urine specimens,40 and therefore the validity of our findings regarding NB. However, many critically ill children do not require a urinary catheter, so our results may be useful for real-world practice.
In addition, patients in all 3 groups should have had the same energy intake to ensure that changes in protein metabolism could be attributed solely to differences in protein intake. However, we chose to use commercially available formulas—as opposed to compounding specific formulas for the study, which would have allowed us to provide the same energy content to all groups—to better replicate the conditions of real-world clinical practice. Still, after adjusting the analysis for the energy intake, we did not find relevant changes in our results as regards the variation in NB and serum protein levels.
StrengthsOur study was a clinical trial carried out in patients in a real-world clinical practice context, and efforts were made to ensure its findings were applicable to the actual conditions of care delivery in the PICU.
ConclusionThe administration of a protein-enriched diet improved protein metabolism, assessed by means of the NB and serum protein levels, in critically ill children aged up to 24 months. An intake of 2.2 g de proteins/kg/day, greater than the minimum intake recommended by the main international guidelines and the amount customarily given to critically ill paediatric patients, was found to be generally safe and well tolerated, whereas an intake of 3.4 g/kg/day could cause hyperuraemia in some patients. Additional studies are required to establish the optimal protein intake, which is probably somewhere between these two amounts.
FundingThe study was conducted with financial support from theInstituto de Investigación Carlos III and the European Regional Development Fund (ERDF) ref. PI11/00721, and the Maternal and Child Health and Development Research Network (Red SAMID, RETICS), funded by the National R + D+I Plan 2008–2011, ISCIII – Sub-Directorate General for Research Assessment and Promotion and European Regional Development Fund (ERDF), ref. RD16/0022/0007.
Author contributionsA Carrillo, C Rey and J López-Herce have contributed equally to the conception and design of the study. J Urbano contributed to the design of the study; R Fernández, J Urbano, A Vivanco and MJ Solana contributed to the implementation of the protocol in participating centres, the active recruitment of patients and data collection. S Díaz contributed to the analysis of the data. All authors participated in the drafting and revision of the manuscript and approved the final version submitted for publication.
We give our heartfelt thanks to all the staff of participating units for their support and collaboration.
