


Prospective studies on the physical development of girls adopted from China to date, to our knowledge, have had follow-up periods of less than 4 years.1–3 The purpose of this scientific letter is to contribute data on the temporal trends in weight, height, body mass index (BMI) and head circumference in 30 Chinese girls adopted by Spanish families between 2001 and 2007 who were followed up for 15 years from the post-arrival medical evaluation, the age at thelarche (Tanner stage II of pubertal development) and the age at menarche.
Follow-up evaluations and measurements took place every 6 months and were always performed by the same clinician. Families were instructed on how to watch for thelarche and menarche and to schedule an appointment once they happened (in these particular visits, the percentage body fat was calculated with the Deurenberg equation). We entered data for the study variables in an Excel spreadsheet, also used to calculate the mean and standard deviation (SD). Using the WHO AnthroII (0–5 years) and WHO AnthroPlus (5–19 years) applications, we compared the anthropometric measurements obtained in the sample with the World Health Organization (WHO) growth standards, calculating the corresponding z scores and percentiles (PCTL) for age and sex (note: these applications do not calculate the z score or percentile of the head circumference from age 5 years or of the weight from age 10 years). We defined significant catch-up growth for any given variable as a z score increase of +0.5 SDs or greater.
Table 1 presents the anthropometric measurements obtained in the initial evaluation and in the annual visits over the 15-year follow-up, comparing them with the WHO growth standards. Fig. 1 shows the temporal trends in the height and BMI z scores using the WHO growth standards as reference.
Weight, height, body mass index and head circumference in girls adopted from China (n = 30) in the initial post-arrival evaluation and during the 15-year follow-up. Comparison with the World Health Organization child growth standards.
| Weight (kg) | Height (cm) | BMI | Head circumference (cm) | ||||||||||||
|---|---|---|---|---|---|---|---|---|---|---|---|---|---|---|---|
| Mean | ±SD | z | PCTL | Mean | ±SD | z | PCTL | Mean | z | PCTL | Mean | ±SD | z | PCTL | |
| Post-arrival evaluation | |||||||||||||||
| Age, mean ± SD: 16 ± 5 months | 8.53 | ±1.65 | −1.16 | 12.3 | 74.45 | ±6.91 | −1.49 | 6.8 | 15.4 | −0.38 | 35.2 | 44.37 | ±1.52 | −1.09 | 13.9 |
| Age/follow-up | |||||||||||||||
| 2 years 4 months/+1 year | 11.81 | ±1.46 | −0.46 | 32.3 | 86.94 | ±5.64 | −1.05 | 14.8 | 15.9 | 0.24 | 59.7 | 46.74 | ±0.99 | −0.77 | 22.1 |
| 3 years 4 months/+2 years | 13.72 | ±1.65 | −0.57 | 28.5 | 95.18 | ±5.94 | −0.97 | 16.6 | 15.4 | 0.03 | 51.4 | 47.98 | ±0.88 | −0.64 | 26.0 |
| 4 years 4 months/+3 years | 15.83 | ±2.22 | −0.49 | 31.1 | 102.41 | ±6.03 | −0.87 | 19.3 | 15.3 | 0.04 | 51.4 | 48.79 | ±0.90 | −0.57 | 28.5 |
| 5 years 4 months/+4 years | 17.73 | ±2.87 | −0.47 | 32.0 | 108.65 | ±6.66 | −0.61 | 26.9 | 15.0 | −0.15 | 44.0 | 49.23 | ±1.02 | ||
| 6 years 4 months/+5 years | 20.20 | ±3.60 | −0.27 | 39.4 | 115.47 | ±6.72 | −0.38 | 35.3 | 15.2 | −0.10 | 46.0 | 49.71 | ±1.04 | ||
| 7 years 4 months/+6 years | 22.59 | ±4.06 | −0.23 | 41.1 | 121.84 | ±6.94 | −0.23 | 40.7 | 15.2 | −0.17 | 43.3 | 50.38 | ±1.17 | ||
| 8 years 4 months/+7 years | 24.92 | ±4.90 | −0.33 | 37.2 | 127.34 | ±7.33 | −0.27 | 39.2 | 15.4 | −0.27 | 39.5 | 50.85 | ±1.24 | ||
| 9 years 4 months/+8 years | 26.62 | ±4.66 | −0.65 | 25.7 | 130.76 | ±5.70 | −0.68 | 24.9 | 15.6 | −0.39 | 34.7 | 51.34 | ±1.30 | ||
| 10 years 4 months/+9 years | 29.38 | ±3.75 | 136.63 | ±4.87 | −0.70 | 24.0 | 15.7 | −0.58 | 28.1 | 51.95 | ±1.45 | ||||
| 11 years 4 months/+10 years | 34.11 | ±4.28 | 143.09 | ±5.58 | −0.67 | 25.1 | 16.7 | −0.42 | 33.9 | 52.51 | ±1.51 | ||||
| 12 years 4 months/+11 years | 38.43 | ±5.41 | 148.12 | ±4.94 | −0.79 | 21.6 | 17.5 | −0.35 | 36.3 | 53.17 | ±1.79 | ||||
| 13 years 4 months/+12 years | 43.19 | ±5.54 | 152.64 | ±4.62 | −0.77 | 22.1 | 18.5 | −0.23 | 40.7 | 53.86 | ±1.69 | ||||
| 14 years 4 months/+13 years | 48.50 | ±3.81 | 155.17 | ±5.22 | −0.80 | 21.1 | 20.1 | 0.11 | 54.2 | 54.64 | ±1.67 | ||||
| 15 years 4 months/+14 years | 51.33 | ±5.35 | 157.04 | ±5.26 | −0.74 | 22.9 | 21.1 | 0.23 | 59.1 | 55.13 | ±1.75 | ||||
| 16 years 4 months/+15 years | 52.06 | ±4.73 | 157.30 | ±5.08 | −0.80 | 21.2 | 20.7 | −0.04 | 48.5 | 55.15 | ±1.74 | ||||
BMI, body mass index; PCTL, percentile; SD, standard deviation; z, z score.
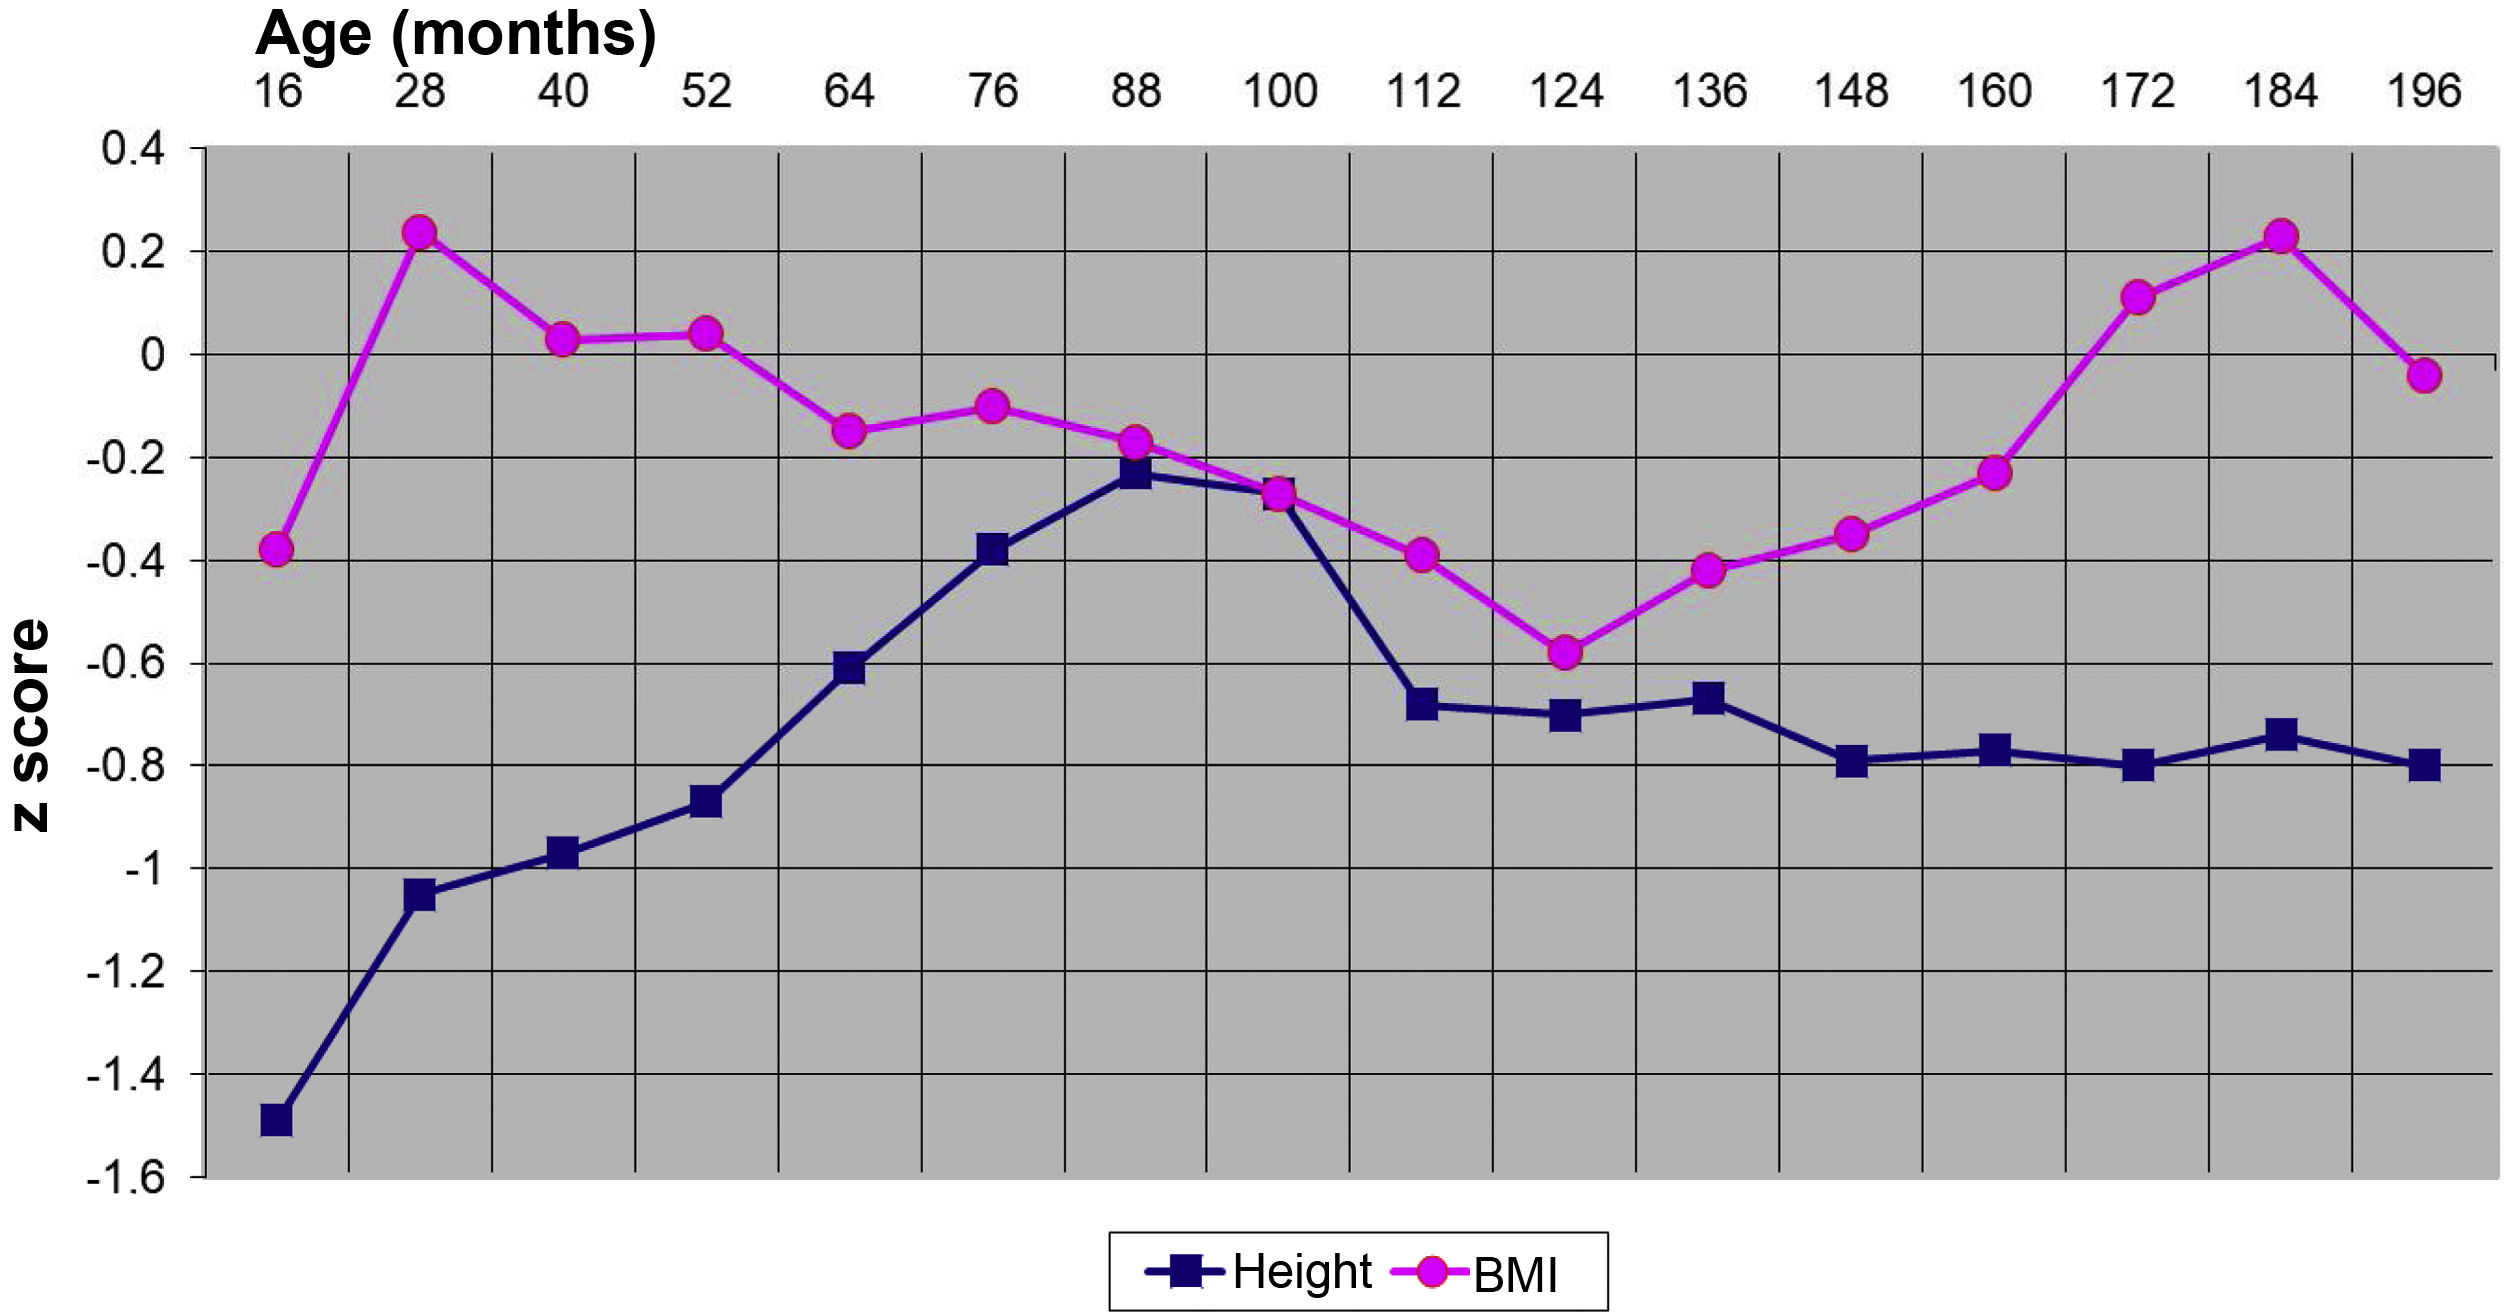
The mean weight and height z scores in the post-arrival evaluation were very similar to those reported by Miller and Hendrie4 in girls adopted from China at a mean age of 15.7 months. We observed significant catch-up growth in weight and BMI in the first year following the post-arrival evaluation, in height in the second year, and in head circumference in the third year. In a study conducted 3 years after the post-arrival evaluation in girls adopted from China, Palacios et al.3 found significant catch-up growth in every anthropometric parameter. In the longitudinal analysis of the height z score, we found catch-up growth through age 8 years, with a decrease between ages 8 and 10 years and stabilization from 10 to 16 years. In the longitudinal analysis of the BMI z score, compared to linear growth, we found a greater catch-up growth through age 6 years, similar growth between ages 6 and 10 years, and progressive growth between ages 10 and 16 years.
The mean age at thelarche was 10 years and 1 month (SD, 1 year and 3 months). At this follow-up visit, the mean weight was 30.3 kg (SD, 4.6), the mean height 137.1 cm (SD, 5.8; z, −0.40; 32.9th PCTL), the mean BMI 16.1 (SD, 1.7; z, −0.30; 38.3th PCTL) and the mean percentage body fat 16.1% (SD, 1.9%). The mean age at menarche was 12 years and 2 months (SD, 1 year). At this visit, the mean weight was 38.7 kg (SD, 3.7), the mean height 149.5 cm (SD, 5.8 cm; z, −0.44; 32.9th PCTL), the mean BMI 17.3 (SD, 1.2; z, −0.38; 35.1th PCTL) and the percentage body fat 18.1% (SD, 1.3%). Hayes and Tan,5 in a survey of the adoptive parents of a cohort of 814 girls adopted from China into North America, found a mean age at menarche of 12.37 years (95% CI, 11.84–13 years). In the group of adopted girls analysed in our study, we found a mean linear growth of 20.2 cm from the beginning of Tanner stage II to the time the adult height was achieved; the peak height velocity between thelarche and menarche was 12.4 cm, and the mean remaining linear growth after menarche was 7.8 cm. These data suggest that pubertal development in these girls could be considered normal.6 However, the height achieved by age 16 years and 4 months, compared to Chinese linear growth charts and the WHO child growth standards, was smaller by 2.85 cm and 5.4 cm, respectively.7
