
To analyse the prevalence, evolution of cardiovascular risk factors (CVRF) and their relationship with follow-up of metabolic control in paediatric patients with Type 1 Diabetes (T1DM).
Patients and methodsA longitudinal ambispective study was conducted including 75 children and adolescents with T1DM diagnosed from 1996 to 2003 and followed-up for nine years. Family history of CVRF was registered. Data from the second, sixth and ninth year after diagnosis were analysed.
ResultsFamily history of CVRF was found in 46.6% of the patients. The prevalence of HbA1c>7.5% in the second, sixth and ninth year after diagnosis was 45.3%, 53.3% and 56%, respectively. The prevalence of obesity (BMI>2SDS) in the three visits was 5.3%, 5.3% and 6.7%, respectively. Hypertension (BP>p90) was found in 14.6%, 8% and 13.3% of the patients in the three visits, respectively. The levels of various parameters were the following: Total cholesterol>200mg/dL: 25.3%, 13.3% and 16%; high density cholesterol lipoprotein<40mg/dL: 1.3%, 1.3% and 4%; low density cholesterol lipoprotein>100mg/dL: 38.6%, 34.6% and 38.6%; triglyceride>150mg/dL: 0%, 1.3% and 2.6%, respectively. There was a significant increase in the prevalence of TG/HDL-C≥2 between the sixth and the ninth year after diagnosis (1.3% and 9.3%, P<0.05). A persistent HbA1c≥7.5% showed a statistically significant relationship to a 0.94 decrease in HDL-C z-score between the second and the sixth year, and a persistent HbA1c<7.5% was significantly associated with a 0.55 increase in HDL-C z-score (P=0.015) in the same period.
ConclusionsA non-optimal metabolic control in the first year of DM1 is associated with a decrease in HDL-C z-score. TG/HDL-C ratio could be an early marker of cardiovascular risk.
Analizar la prevalencia, evolución de factores de riesgo cardiovascular (FRCV) y su relación con el control metabólico en pacientes pediátricos con diabetes mellitus tipo 1 (DM1).
Pacientes y métodosEstudio longitudinal ambispectivo en 75 niños y adolescentes españoles con DM1 diagnosticados en los años 1996-2003 y seguidos durante 9 años. Analizamos los FRCV y su evolución al segundo, sexto y noveno años tras el diagnóstico, y los antecedentes familiares (AF) de FRCV.
ResultadosEl 46,6% tenía AF de FRCV. En el segundo, sexto y noveno años encontramos una prevalencia de HbA1c>7,5% del 45,3, el 53,3 y el 56%, respectivamente; de obesidad (índice de masa corporal>2 desviaciones estándar) del 5,3, el 5,3 y el 6,7%, y de HTA (presión arterial>p90) del 14,6, el 8 y el 13,3%. Colesterol total>200mg/dl en el 25,3, el 13,3 y el 16%; lipoproteína de alta densidad del colesterol (HDL-c)<40mg/dl en el 1,3, el 1,3 y el 4%; lipoproteína de baja densidad del colesterol (LDL-c)>100mg/dl en el 38,6, el 34,6 y el 38,6%; triglicéridos (TG) >150mg/dl en el 0, el 1,3 y el 2,6%, respectivamente. Encontramos un aumento significativo en la prevalencia de TG/HDL-c≥2 entre el sexto y el noveno años de evolución de la enfermedad (1,3% y 9,3%, p<0,05). Una HbA1c≥7,5% en el segundo y el sexto años se asoció de forma significativa a una disminución en el HDL-c z-score de 0,94, y una HbA1c<7,5% durante ese mismo periodo se asoció significativamente a un aumento del HDL-c z-score del 0,55(p=0,015).
ConclusionesEl peor control metabólico de la DM1 en los primeros años de evolución se asocia a una disminución del HDL-c z-score. El cociente TG/HDL-c podría ser un marcador precoz de riesgo cardiovascular.
Cardiovascular disease (CVD) is the leading cause of death in patients with type 1 diabetes mellitus (T1DM).1,2 It has been demonstrated3–5 that cardiovascular risk factors (CVRFs) present in the paediatric age group progress into adulthood, and there is evidence of their association with markers of atherosclerosis5 and/or atherosclerotic lesions in autopsies.3,4
In childhood and adolescence, T1DM may be associated with other CVRFs such as obesity, dyslipidaemia and hypertension (HTN). Cross-sectional studies6,7 have shown a high prevalence of CVRFs in young patients with T1DM, but there are few longitudinal studies.8,9 Disorders of lipid metabolism are among the most studied CVRFs in T1DM.10,11 Di Bonito et al. proposed that a high triglyceride (TG) to high-density lipoprotein cholesterol (HDL-c) ratio could be useful in clinical practise for identifying children with poorer cardiovascular profiles,12 but no studies on this subject have been conducted in children with T1DM.
The aim of our study was to analyse the prevalence of different CVRFs, including the TG-to-HDL-c ratio, over a period of nine years, and to assess the relationship between glycaemic control and lipid profiles in a cohort of children and adolescents less than 19 years of age with T1DM. This is the first longitudinal study conducted on a Spanish paediatric population with T1DM.
Patients and methodsWe conducted an ambispective longitudinal study (retrospective analysis until 2006 and prospective analysis thereafter) with a nine-year follow-up of a cohort of 75 patients with T1DM, less than 19 years of age (57.3% male), diagnosed between 1996 and 2003, and followed up at our Diabetes Unit. The mean age at diagnosis was 6.5±3.4 years. All patients were Caucasian and were being treated with a basal-bolus multiple dose insulin (MDI) regimen or with continuous subcutaneous insulin infusion (CSII). During the first visit, we excluded from the study any patients with any other systemic disease that could affect their lipid levels. We evaluated the patients every 3 months as part of their T1DM follow-up visits scheduled to adjust the insulin dosage and to provide education on diabetes. We selected 3 visits for our study, corresponding to the last visits in the second year (visit 1), sixth year (visit 2) and ninth year (visit 3) following the T1DM diagnosis. We collected demographic data from the medical records, including the ethnicity and family history of CVRF (family history [FH] of HTN, obesity, dyslipidaemia, type 1 and/or 2 diabetes in member of the immediate family, or a history of acute myocardial infarction in a close male relative younger than 55 years and/or a close female relative younger than 65 years). A complete physical examination was performed at each visit. We measured the height with a Harpenden stadiometer. We calculated the body mass index (BMI) as the weight over the height squared (kg/m2) expressed in standard deviations (SDs). We defined obesity as a BMI above 2SD for age and sex based on Spanish growth charts.13 We determined pubertal development by means of the Tanner stages,14 dividing the patients into 2 categories: prepubertal (Tanner 1) or pubertal (Tanner 2–5). Arterial blood pressure (BP) was measured 3 times each visit with a Critikon Dinamap 8100 monitor (vital signs) after the patient had been at rest for a minimum of 5min. We selected the lowest reading and evaluated it using the percentiles of the Task Force on Blood Pressure.15 We collected data on the type of insulin therapy (MDI or CSII) and insulin dosage expressed in IU/kg/day. Metabolic control was assessed by determination of haemoglobin A1c (HbA1c) every 3 months by means of HPLC (Menarini) standardised against the Diabetes Control and Complication Trial results and the IFCC reference system (normal value, 5.3±0.4%), and documented the mean value for the previous year. At every visit, we analysed the lipid levels in blood samples collected after 12h of fasting. The total cholesterol (CT), HDL-c and TG levels were measured by means of enzyme assays with an AEROSET/ARCHITECTc8000 system (Abbott). Low-density lipoprotein cholesterol (LDL-c) values were calculated with the Friedewald equation if the TG levels were below 400mg/L. We calculated the z-scores for LDL-c, TC, HDL-c and TG using as a reference the Spanish study by López et al.16 We also calculated the TG-to-HDL-c ratio as yet another CVRF in the publication of Di Bonito et al.12 Urinary albumin excretion (UAE) was determined by radioimmunoassay in an overnight (8-h) urine sample. Patients were classified as having a normal UAE (UAE<20μg/min) or albuminuria (UAE>20μg/min in 3 consecutive samples). We obtained laboratory samples if there had been no episodes of metabolic decompensation in the month preceding the visit.
We defined the following CVRFs: prehypertension and HTN as diastolic or systolic BP>90th percentile for age, sex and height based on the Fourth Report on the Diagnosis, Evaluation and Treatment of High Blood Pressure in Children and Adolescents15; a mean annual HbA1c≥7.5% based on the 2011 consensus clinical practise guidelines of the IDF/ISPAD17; obesity as a BMI>2 SD for age and sex based on Spanish growth charts.13 We assessed for abnormal lipid levels: TC>200mg/dL, HDL-c<40mg/dL and TG>150mg/dL based on the 2011 consensus clinical practise guidelines of the IDF/ISPAD.17 LDL>160mg/dL, LDL within 130–160mg/dL and LDL within 100–130mg/dL, based on the ATPIII,18 ADA19 and IDF/ISPAD17 guidelines. For the TG-to-HDL-c ratio, we applied 2 cut-off points, ratio ≥2 and within 1.2–2, based on the limits for the paediatric population published by Di Bonito et al.12
We performed the statistical analysis with SPSS Inc., version 15.0 (Chicago, USA). We have described categorical variables as absolute frequencies and the percentages for each category, and continuous variables as the mean±SD. When it came to CVRFs, we created dichotomous variables for the presence or absence of a specific characteristic. We used the non-parametric Friedman test to compare the frequencies of CVRFs through time, and Student's t test and the chi square test to compare CVRFs by sex at the time of the third visit. To determine the association between glycaemic control and lipid levels, we created a dichotomous variable for visits 1 and 2 (HbA1c>7.5); and then created 4 groups: group 1 (HbA1c<7.5 in visits 1 and 2), group 2 (HbA1c <7.5 in visit 1 and ≥7.5 in visit 2), group 3 (HbA1c ≥7.5 in visit 1 and <7.5 in visit 2) and group 4 (HbA1c ≥7.5 in visits 1 and 2). We calculated the change in z-score by subtracting the z-score values for TG, HDL, TC and LDL of visit 1 from those of visit 2 in each group. To analyse the changes in the lipid levels between the 4 groups, we used the Kruskal–Wallis test, and when the result was statistically significant, we adjusted it for small groups using the Mann–Whitney test with the Bonferroni correction. We set the level of statistical significance at P<.05.
The study was approved by the ethics committee of our hospital, and the parents or guardians and mature minors signed the consent for participation.
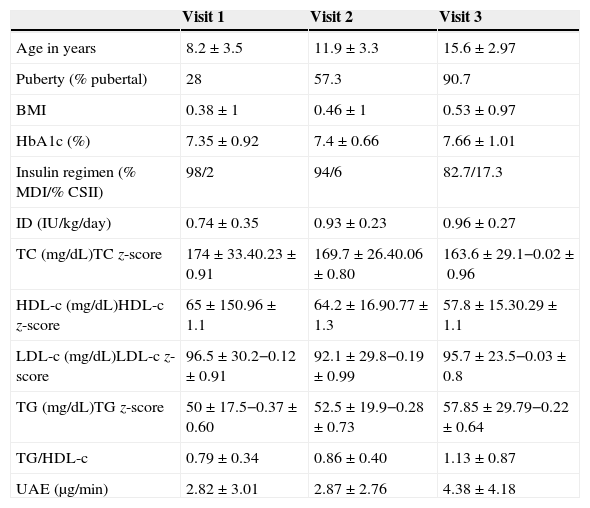
ResultsTable 1 shows the clinical characteristics of the patients. We found a FH of diabetes mellitus in 23.3% of the participants, and a FH of obesity, dyslipidaemia and premature CVD in 12.3%, 11%, 26% and 4.1% of the patients, respectively. The prevalence of a family history of at least one CVRF was 46.6%.
Clinical and laboratory characteristics of the cohort.
| Visit 1 | Visit 2 | Visit 3 | |
|---|---|---|---|
| Age in years | 8.2±3.5 | 11.9±3.3 | 15.6±2.97 |
| Puberty (% pubertal) | 28 | 57.3 | 90.7 |
| BMI | 0.38±1 | 0.46±1 | 0.53±0.97 |
| HbA1c (%) | 7.35±0.92 | 7.4±0.66 | 7.66±1.01 |
| Insulin regimen (% MDI/% CSII) | 98/2 | 94/6 | 82.7/17.3 |
| ID (IU/kg/day) | 0.74±0.35 | 0.93±0.23 | 0.96±0.27 |
| TC (mg/dL)TC z-score | 174±33.40.23±0.91 | 169.7±26.40.06±0.80 | 163.6±29.1−0.02±0.96 |
| HDL-c (mg/dL)HDL-c z-score | 65±150.96±1.1 | 64.2±16.90.77±1.3 | 57.8±15.30.29±1.1 |
| LDL-c (mg/dL)LDL-c z-score | 96.5±30.2−0.12±0.91 | 92.1±29.8−0.19±0.99 | 95.7±23.5−0.03±0.8 |
| TG (mg/dL)TG z-score | 50±17.5−0.37±0.60 | 52.5±19.9−0.28±0.73 | 57.85±29.79−0.22±0.64 |
| TG/HDL-c | 0.79±0.34 | 0.86±0.40 | 1.13±0.87 |
| UAE (μg/min) | 2.82±3.01 | 2.87±2.76 | 4.38±4.18 |
The results of continuous variables are expressed as mean±SD. To convert mg/dL to mmol/L, multiply by 0.02586.
BMI, body mass index; CSII, continuous subcutaneous insulin infusion; HbA1c, haemoglobin A1c; HDL-c: high-density lipoprotein cholesterol; ID, insulin dose; LDL-c, low-density lipoprotein cholesterol; MDI, multiple dose insulin; SD, standard deviation; TC, total cholesterol; TG, triglycerides; TG/HDL-c, triglycerides to high-density lipoprotein cholesterol ratio; UAE, urinary albumin excretion.
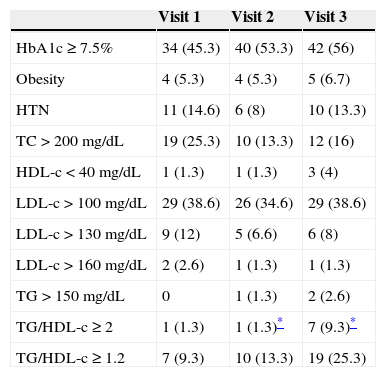
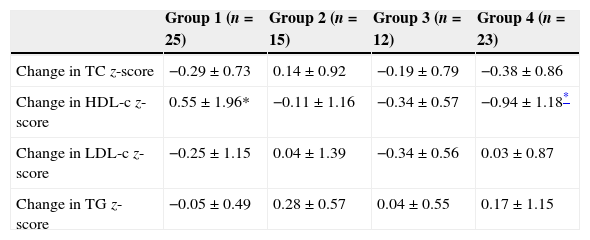
The prevalence of CVRFs in each of the visits is shown in Table 2. The most prevalent CVRF in our cohort was an HbA1c value equal or greater than 7.5, and we observed a trend that was not statistically significant towards a higher prevalence of HbA1c values equal or greater than 7.5 over the course of the disease (45.3%, 53.3% and 56% in each of the 3 visits). The prevalence of obesity in the second, sixth and ninth years was 5.3%, 5.3% and 6.7%, respectively, and the prevalence of HTN at each of the 3 visits was 14.6%, 8% and 13.3%, respectively (not significant). We only found one patient with an abnormal UAE in the ninth year from the diabetes diagnosis. As for the lipid profile, the prevalence of TC above 200mg/dL was 25.3%, 13.3% and 16% at the 3 time points analysed. We observed a non-significant increase in the prevalence of HDL-c above 40mg/dL through time (1.3%, 1.3% and 4% at each of the three visits). The prevalence of LDL-c above 100mg/dL through time was 38.6%, 34.6% and 38.6%, respectively. We observed a non-significant increase in the prevalence of TG levels above 150mg/dL (0%, 1.3% and 2.6% at the three time points). We found a significant increase in the prevalence of the TG-to-HDL-c ratios equal or greater than 2 through time (Table 2). We did not observe significant differences between sexes in the prevalence of any of the analysed CVRFs at the third visit. We compared the changes in lipid z-scores in the four groups we had established based on the glycaemic control at visits 1 and 2 (Table 3), and found no significant changes in the TC, LDL and TG z-scores. However, when we analysed the changes in HDL z-scores we observed that patients with sustained good metabolic control (group 1) had a significant increase in the HDL z-score of 0.55±1.96 between the first two visits, and that patients with a persistently poor metabolic control (group 4) experienced a significant decrease of 0.94±1.18 in the HDL z-score over the same time period (P=.015).
Prevalence of cardiovascular risk factors over the course of the disease.
| Visit 1 | Visit 2 | Visit 3 | |
|---|---|---|---|
| HbA1c≥7.5% | 34 (45.3) | 40 (53.3) | 42 (56) |
| Obesity | 4 (5.3) | 4 (5.3) | 5 (6.7) |
| HTN | 11 (14.6) | 6 (8) | 10 (13.3) |
| TC>200mg/dL | 19 (25.3) | 10 (13.3) | 12 (16) |
| HDL-c<40mg/dL | 1 (1.3) | 1 (1.3) | 3 (4) |
| LDL-c>100mg/dL | 29 (38.6) | 26 (34.6) | 29 (38.6) |
| LDL-c>130mg/dL | 9 (12) | 5 (6.6) | 6 (8) |
| LDL-c>160mg/dL | 2 (2.6) | 1 (1.3) | 1 (1.3) |
| TG>150mg/dL | 0 | 1 (1.3) | 2 (2.6) |
| TG/HDL-c≥2 | 1 (1.3) | 1 (1.3)* | 7 (9.3)* |
| TG/HDL-c≥1.2 | 7 (9.3) | 10 (13.3) | 19 (25.3) |
Values are expressed as n (%).
HbA1c, glycated haemoglobin; HDL-c: high-density lipoprotein cholesterol; LDL-c, low-density lipoprotein cholesterol; TC, total cholesterol; TG, triglycerides; TG/HDL-c, triglycerides to high-density lipoprotein cholesterol ratio; UAE, urinary albumin excretion.
Comparison of participants by category of glycaemic control over time (visits 1 and 2).
| Group 1 (n=25) | Group 2 (n=15) | Group 3 (n=12) | Group 4 (n=23) | |
|---|---|---|---|---|
| Change in TC z-score | −0.29±0.73 | 0.14±0.92 | −0.19±0.79 | −0.38±0.86 |
| Change in HDL-c z-score | 0.55±1.96* | −0.11±1.16 | −0.34±0.57 | −0.94±1.18* |
| Change in LDL-c z-score | −0.25±1.15 | 0.04±1.39 | −0.34±0.56 | 0.03±0.87 |
| Change in TG z-score | −0.05±0.49 | 0.28±0.57 | 0.04±0.55 | 0.17±1.15 |
Group 1 (HbA1c <7.5 in visits 1 and 2), group 2 (HbA1c <7.5 in visit 1 and ≥7.5 in visit 2), group 3 (HbA1c ≥7.5 in visit 1 and <7.5 in visit 2) and group 4 (HbA1c ≥7.5 in visits 1 and 2).
HDL-c: high-density lipoprotein cholesterol; LDL-c, low-density lipoprotein cholesterol; TC, total cholesterol; TG, triglycerides.
There are few studies on CVRFs in paediatric patients with T1DM, and most of them are cross-sectional studies.7,20 Our study is the first longitudinal study on the subject in a Spanish sample of children and adolescents with T1DM. Similar longitudinal studies10,11 have included patients diagnosed at up to 25 years of age, while in our cohort all patients were younger than 19 years, with a mean age at diagnosis of 6.5±3.4 years, so that the entire follow-up took place within the paediatric age interval. While the ADA recommends that the first lipid screening in patients with T1DM without a FH of CVRFs or obesity be done starting at 10 years of age or at puberty,19 the expert panel of the NHLBI recommends a selective screening for dyslipidaemia in patients with T1DM between 2 and 8 years of age, irrespective of the FH of CVRFs.21 In our paediatric diabetes unit we perform the dyslipidaemia screening starting from the first year from diagnosis with T1DM, which has allowed us to find out that at 8.2±3.5 years of age, and 1.66±0.63 years after diagnosis, 25.3% of the patients have a TC above 200mg/dL, 1.3% of the patients have a HDL-c below 40mg/dL and 38.6% of the patients have a LDL above 100mg/dL. For this reason, and in agreement with the expert panel of the NHLBI,21 we believe that dyslipidaemia screenings should be performed starting one year after the T1DM diagnosis.
Generally, published studies on CVRFs do not include the FH in the analysis, an aspect that we think is relevant considering the significant influence of genetic factors. Nearly half of our patients has a FH of CVRFs and 23% have relatives with a history of diabetes mellitus, a proportion that is much higher than the one reported for the general population in Spain.22 The presence of a FH of early CVD is considered a risk factor for atherosclerosis in the general population,23 and Mäkimattila et al. have demonstrated that the presence of a FH of type 2 diabetes is an important risk factor for CVD.24 All of the above underscores the importance of including the FH in the evaluation of cardiovascular risk. While there was a high prevalence of FH in our cohort, we did not find a greater overall prevalence of CVRFs, as we are about to explain in greater detail.
The most frequent CVRF in our cohort was an elevated HbA1c level. The growing available evidence shows that glycaemic control exerts a decisive influence on the development of atherosclerosis in patients with diabetes. Thus, the EDIC study25 demonstrated that intensive treatment in patients with T1DM has a long-term beneficial effect on the risk of CVD. Snell-Bergeon et al.26 determined that a level of HbA1c equal or above 7.5% is an important risk factor for increased atherosclerotic plaque formation in youth with diabetes mellitus with no symptoms of coronary artery disease. In this sense, the mean HbA1c in our cohort was lower than the levels reported in other similar studies, as Margeirsdottir et al. found a mean HbA1c of 8.2%20 and Schwab et al. found a mean HbA1c of 8.25%.7
The prevalence of obesity in our paediatric cohort with T1DM is of approximately 6%, similar to the prevalence reported in other cross-sectional studies.7,20 We did not find significant differences in BMI in the course of the disease in consecutive visits, while we did find differences in the lipid profile. Maahs et al.11 observed that higher baseline BMIs were associated with unfavourable changes in lipid profiles, independent of glycaemic control. While we could not analyse this aspect due to our small sample size, we are aware of the complex relationship that exists between HbA1c, BMI and lipid levels, and of how all of these factors influence the development and progression of CVD in patients with T1DM.
The prevalence of HTN, of approximately 12%, was similar to the prevalence reported in other studies with a cross-sectional design.6,7,20
In our study, 38.6% of participants had LDL-c levels above 100mg/dL in visit 1, while 34.6% had such levels during follow-up, percentages that are lower than those reported by other authors.6,7,10 Two retrospective studies of T1DM found a positive correlation between HbA1c and TC,8 and between HbA1c, TC and LDL-c.9 Maahs et al.11 noticed that the change in HbA1c levels over the course of two years was significantly associated with concomitant changes in the lipid profiles of youth with diabetes mellitus, as decreases in HbA1c over that period were associated with decreases in TC, LDL-c and TG levels and increases in HDL-c levels, that is, with healthier lipid profiles. Our data is consistent with this, as a sustained less-than-optimal control between the second and sixth years from diagnosis was associated with a 0.94 decrease in the HDL z-score of children and adolescents with T1DM. On the other hand, a sustained optimal glycaemic control over the same period was associated significantly with a 0.55 increase in the HDL z-score. These findings suggest that an optimal glycaemic control may have a beneficial effect on HDL-c levels in young individuals with T1DM, which is of great clinical relevance, as several epidemiological studies have found an inverse correlation between HDL-c levels and cardiovascular risk.27
There is growing interest in the TG-to-HDL-c ratio as an alternative marker for atherogenic lipid abnormalities in adults,28 but the clinical value of this ratio has not been researched as thoroughly in the paediatric population.29 Di Bonito et al. showed that a TG-to-HDL-c ratio equal or greater than 2 was associated with multiple CVRFs in a healthy population of children and adolescents.12 Nearly 10% of our patients had a TG-to-HDL-c ratio equal or greater than 2 in visit 3, and one fourth of all patients had a TG-to-HDL ratio equal or greater than 1.2 at the same time point, prevalences that are lower than those reported by Di Bonito et al.,12 who found a TG-to-HDL-c ratio equal or greater than 1.2 in 65% of the patients and a ratio equal or greater than 2 in 31% of the patients. These differences may be due to the high incidence of overweight and obesity in the population of the Di Bonito study (of up to 76%).
In our study, a TG-to-HDL-c ratio of 2 or greater was the only CVRF that increased significantly through time, which suggests that this ratio could be an early marker of future lipid abnormalities. This increase could also be associated with other factors, such as age, pubertal stage or the degree of metabolic control, relationships that we could not analyse due to the small sample size and the absence of a control group. The FinnDiane study demonstrated an association between metabolic syndrome and diabetic nephropathy,30 and albuminuria has been associated with an increase in retinopathy, macrovascular disease and other CVRFs. We did not observe these conditions in our study, probably due to adequate metabolic control. We did not find significant differences between the sexes in any of the CVRFs analysed at visit 3, so we could not assess whether sexual dimorphism influences these CVRFs.
Although this was an ambispective study conducted on a small sample, we collected all the available data from the medical records, which are held in an electronic database. One limitation of our study was that we did not systematically collect data on relevant information, such as physical activity and diet composition, although in the diabetes education provided to all patients with T1DM and their family members we recommend a diet low in saturated fats and restricting carbohydrates with high glycaemic indices. We also advise all patients to exercise regularly, and most patients did exercise a minimum of three times a week.
The most salient characteristic of our study was the nine-year follow-up of CVRFs within the paediatric age range, including the FH of CVD. This study is of great clinical relevance, as it evinces the prevalence of atherogenic risk factors in children and adolescents with T1DM undergoing intensive treatment and with a mean HbA1c of 7.35±0.92, 7.4±0.66 and 7.66±1.01 at the 3 time points analysed, respectively. We observed a significant increase in the prevalence of TG-to-HDL-c ratios equal or greater than 2 with the passage of time. We also demonstrated that a persistently elevated HgA1c in the first 4 years following diagnosis is associated with a decrease in the HDL z-score during this time interval, and that a sustained good metabolic control is associated with an increase in the HDL z-score during the same period.
Conflicts of interestThe authors have no conflicts of interest to declare.
Please cite this article as: Golmayo Gaztelu L, Ros Pérez P, Alonso Blanco M, Martín-Frías M, Barrio Castellanos R. Factores de riesgo cardiovascular en niños y adolescentes españoles con diabetes mellitus tipo 1: evolución a lo largo de 9 años. An Pediatr (Barc). 2015;83:40–46.
