


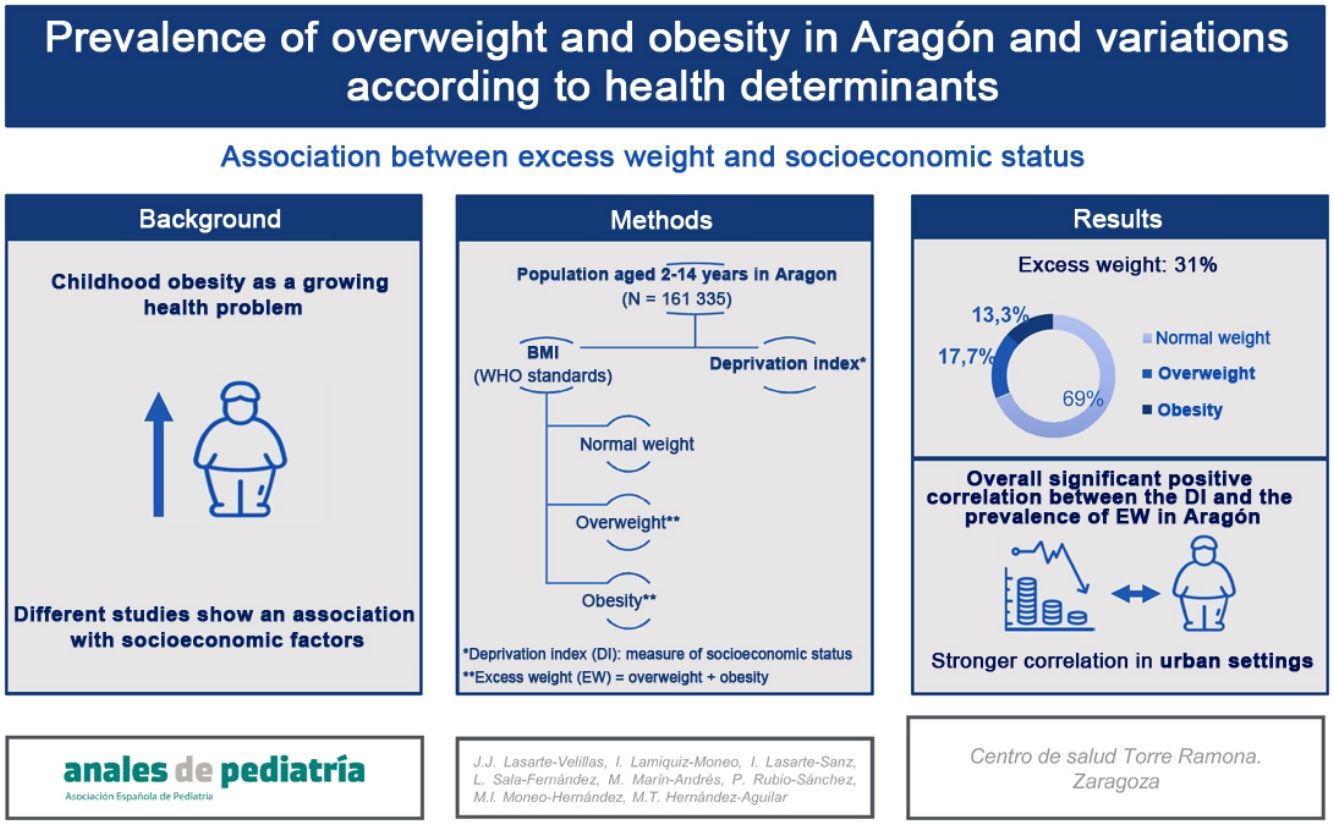
Childhood obesity is a serious global health problem that is continuously increasing worldwide. Many studies suggest that socioeconomic factors are related to the development of obesity. The objective of our study was to analyse the prevalence of overweight and obesity in Aragón, calculated applying the World Health Organization (WHO) growth standards, and to study its association with socioeconomic factors.
Material and methodsWe collected data for the entire paediatric population of Aragón aged 2–14 years. We classified each child as normal weight, overweight or obese based on the body mass index. We calculated prevalences by province and basic health care zone. To analyse differences in relation to social inequalities, we used the Aragón deprivation index as an indicator of socioeconomic status.
ResultsThe final sample consisted of 161 335 children aged 2–14 years, 51% male and 49% female. The overall prevalence of excess weight was 31.1% (17.7% overweight and 13.3% obesity) and was significantly higher in boys. We found a high frequency of under-recording in health records (65%). There was a direct association between the deprivation index and the prevalence of obesity and overweight throughout Aragón, with a significant strong correlation in urban areas, where socioeconomic factors explained up to 66.4% of obesity and 48.9% of body weight excess.
ConclusionsIn Aragón, the prevalence of obesity and excess weight is high and associated with low family socioeconomic status.
La obesidad infantil constituye un grave problema de salud global en continuo aumento en todo el mundo. Muchos estudios señalan que determinados factores socioeconómicos están relacionados con el desarrollo de obesidad. El objetivo de este estudio fue analizar la prevalencia de sobrepeso y obesidad en Aragón, calculadas según los estándares de OMS y estudiar su relación con factores socioeconómicos.
Material y métodosSe recopiló información sobre la totalidad de la población infantil de Aragón entre 2 y 14 años y cada individuo fue clasificado como normopeso, sobrepeso u obesidad según su índice de masa corporal. Se obtuvieron las prevalencias por provincias y zonas básicas de salud. Utilizamos el índice de privación de Aragón como marcador de la situación socioeconómica.
ResultadosLa muestra final estuvo constituida por 161.335 niños (51%) y niñas (49%) de 2 a 14 años. La prevalencia global de sobrecarga ponderal fue de 31,1% (17,7% sobrepeso y 13,3% obesidad), siendo significativamente mayor en niños. Detectamos un porcentaje elevado (65%) de infrarregistro en la historia clínica. Se encontró una relación directa entre el índice de privación y la prevalencia de obesidad y sobrecarga ponderal en todo Aragón, con una fuerte correlación significativa en zonas urbanas, en las que los factores socioeconómicos llegan a explicar hasta un 66,4% de la obesidad y un 48,9% de la sobrecarga ponderal total.
ConclusionesEn Aragón, la prevalencia de obesidad y sobrecarga ponderal es elevada y está relacionada con una situación socioeconómica familiar desfavorable.
At present, childhood obesity is an important public health problem that has been increasing globally since the past century.1–5 In Spain, the combined prevalence of overweight and obesity, or excess weight (EW), ranges between 26% and 32.5% depending on the time and place the studies are conducted and the standards used for reference.6–9 In a study conducted by our group in 201410 in Sector II of Zaragoza, one of the 8 health care sectors in Aragon, which mostly comprises urban health care districts (HCDs), we found a prevalence of EW of 30.8% applying the child growth standards of the World Health Organization (WHO).8
On the other hand, several studies have shown that living conditions play a role in health11–14 and in obesity.15,16 In Aragon, the incidence of overweight has been found to be higher in rural areas and disadvantaged neighborhoods,16 and there is evidence of an inverse association between obesity and educational attainment.15 A higher incidence has also been found in students in public schools compared to private schools.17
The aim of our study was to assess the prevalence of overweight, obesity and EW calculated in reference to the WHO growth standards in Aragon and its health sectors, and to analyse its association with socioeconomic factors. Obtaining current knowledge on EW in the paediatric population of Aragon would allow the identification of the areas that require urgent or intensive intervention, and sets the foundation for a more detailed analysis of the potential causes and risk factors to target in future studies. It can also serve as a baseline to start monitoring obesity in the paediatric population of Aragon, observing its temporal trends and comparing them with other autonomous communities (ACs) in Spain and/or other European countries.
Material and methodsDesignWe conducted a cross-sectional prevalence study with data from Healthy Child programme records for the paediatric population of Aragon, retrieved from the primary care electronic health record system of the region (known as OMI-AP). We retrieved this data on December 31, 2020. The study universe included every child aged 2–14 years (that is, born between December 31, 2003 and December 31, 2018) in Aragon for who, at the time of data collection, the OMI-AP database had at least one record of weight and height measurements taken at the same time. We calculated the age of each child as the difference between the date of birth and the date the weight and height were documented.
As of December 31, 2020, the population aged 2–14 in Aragon comprised 165 642 children, based on data from the Instituto Nacional de Estadística (National Institute of Statistics).18 We obtained data for 166 440 children, and the final sample included 161 335 children after excluding 5105 due to erroneous or extreme values (a body mass index [BMI] greater than 50 or smaller than 10).
We obtained anonymised data for the following variables: health care sector and district, sex, date of birth, most recent weight and height and the date they were recorded, and diagnosis of overweight/obesity documented at any time. Usually, this information is recorded during Healthy Child programme visits.
We calculated the BMI with the most recent weight and height measurements. We recorded the age of the individual as the age at the time this information was entered in the health record. Of the total sample, 37% of the children had BMI values based on measurements taken in the past year, and 87% values based on measurements taken within the past 3 years.
We classified each participant as having normal weight, overweight or obesity applying the WHO growth standards and the thresholds used most widely for their definition in Spain (overweight: 85th percentile [P85] to 97th percentile [P97]; obesity: >P97).19 We calculated the prevalence of overweight and obesity for each age, sex, province, health care sector and HCD. We used the term EW to refer to the presence of obesity or overweight of any degree.
To analyse differences in EW in relation to social inequalities in each HCD, we used the deprivation index (DI) of Aragon.20 This index was developed by the Section on Health Care Information and Research of the Directorate General of Public Health, the Instituto Aragonés de Estadística (Aragon Institute of Statistics) and the Universidad de Zaragoza to assess health inequalities between the different HCDs of Aragon based on population and household census data for year 2011. The DI values for each HCD in Aragon are published in the website of the Government of Aragon21 and range between −2.33 and +3.04, with higher values indicating higher levels of deprivation.
We conducted a simple descriptive analysis of frequencies. To analyse the association between the DI and the prevalence of overweight and obesity, we used the Pearson correlation coefficient and linear regression. We set the level of significance at a P value of less than .05. Lastly, we used the χ2 test for the detailed assessment of differences in the prevalence of overweight, obesity and EW broken down by HCD, sector and province.2 The statistical analysis was carried out with the RStudio software (version 3.5.0).
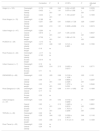
ResultsOf all children in the sample, 51% were male and 49% female. The overall prevalence of EW was 31.1% (17.7% overweight and 13.3% obesity). Table 1 presents the prevalence of overweight and obesity by sex and age in the entire region of Aragon. Table 2 presents the prevalence by province and health care sector.
Prevalence of overweight and obesity by sex and age in Aragon.
| Overweight | Obesity | ||||||||||||||
|---|---|---|---|---|---|---|---|---|---|---|---|---|---|---|---|
| Male | Female | Total | Male | Female | Male | Female | |||||||||
| n | n | N | n | % | 95% CI | n | % | 95% CI | n | % | 95% CI | n | % | 95% CI | |
| 2 years | 6059 | 5643 | 11 702 | 717 | 11.8% | (9.4%–14.1%) | 769 | 13.6%* | (11.1%–16.0%) | 311 | 5.1% | (2.5%–7.4%) | 297 | 5.3% | (2.6%–7.6%) |
| 3 years | 7144 | 6810 | 13 954 | 1249 | 17.5% | (15.3%–19.5%) | 1156 | 17.0% | (14.8%–19.1%) | 696 | 9.7% | (7.5%–11.9%) | 610 | 9.0% | (6.6%–11.1%) |
| 4 years | 7603 | 7227 | 14 830 | 1305 | 17.2 | (15.1%–19.2%) | 1255 | 17.4% | (15.2%–19.4%) | 706 | 9.3% | (7.1%–11.4%) | 613 | 8.5% | (6.2%–10.6%) |
| 5 years | 2173 | 2026 | 4199 | 335 | 15.4% | (11.4%–19.1%) | 304 | 15.0% | (10.8%–18.9%) | 261 | 12.0% | (7.9%–15.8%) | 208 | 10.3% | (5.9%–14.2%) |
| 6 years | 17 260 | 15 755 | 33 015 | 2611 | 15.1% | (13.7%–16.5%) | 2610 | 16.6%* | (15.1%–18.0%) | 2492 | 14.4%* | (13.0%–15.8%) | 1777 | 11.3% | (9.8%–12.7%) |
| 7 years | 1747 | 1790 | 3537 | 243 | 13.9% | (9.4%–18.1%) | 285 | 15.9% | (11.5%–20.0%) | 356 | 20.4% | (16.1%–24.4%) | 329 | 18.4% | (14.0%–22.4%) |
| 8 years | 5150 | 4847 | 9997 | 879 | 17.1% | (14.5%–19.5%) | 987 | 20.4%* | (17.8%–22.8%) | 1119 | 21.7%* | (19.3%–24.1%) | 817 | 16.9% | (14.2%–19.4%) |
| 9 years | 6505 | 6312 | 12 817 | 1223 | 18.8% | (16.6%–20.9%) | 1345 | 21.3%* | (19.1%–23.5%) | 1487 | 22.9%* | (20.7%–25.0%) | 1060 | 16.8% | (14.5%–19.0%) |
| 10 years | 3472 | 3534 | 7006 | 693 | 20.0% | (16.9%–22.9%) | 799 | 22.6%* | (19.6%–25.4%) | 818 | 23.6%* | (20.6%–26.4%) | 525 | 14.9% | (11.7%–17.8%) |
| 11 years | 1820 | 1826 | 3646 | 356 | 19.6% | (15.3%–23.5%) | 339 | 18.6% | (14.3%–22.6%) | 432 | 23.7%* | (19.6%–27.6%) | 268 | 14.7% | (10.3%–18.7%) |
| 12 years | 10 403 | 10 324 | 20 727 | 2271 | 21.8%* | (20.1%–23.5%) | 2066 | 20.0% | (18.3%–21.7%) | 2110 | 20.3%* | (18.5%–22.0%) | 1269 | 12.3% | (10.4%–14.1%) |
| 13 years | 1544 | 1370 | 2914 | 310 | 20.1% | (15.5%–24.4%) | 250 | 18.2% | (13.3%–22.8%) | 250 | 16.2%* | (11.4%–20.6%) | 172 | 12.6% | (7.3%–17.2%) |
| 14 years | 11 842 | 11 149 | 22 991 | 2247 | 19.0% | (17.3%–20.6%) | 2014 | 18.1% | (16.4%–19.7%) | 1516 | 12.8%* | (11.1%–14.5%) | 1018 | 9.1% | (7.3%–10.9%) |
| TOTAL | 82 722 | 78 613 | 161 335 | 14 439 | 17.5% | (16.8%–18.1%) | 14 179 | 18.0% | (17.4%–18.7%) | 12,554 | 15.2% | (14.5%–15.8%) | 8963 | 11.4% | (10.7%–12.1%) |
Prevalence of overweight and obesity by province and health sector.
| Population | Overweight | Obesity | Excess weight | ||||||||
|---|---|---|---|---|---|---|---|---|---|---|---|
| Province | Health sector | N | n | % | 95% CI | n | % | 95% CI | n | % | 95% CI |
| TERUEL | Alcañiz | 8499 | 1530 | 18.0% | (16.0%–19.9%) | 1160 | 13.6% | (11.6%–15.6%) | 2690 | 31.7% | (29.9%–33.4%) |
| Teruel | 8140 | 1339 | 16.4%* | (14.4%–18.4%) | 1003 | 12.3%* | (10.2%–14.3%) | 2342 | 28.8%* | (26.9%–30.6%) | |
| Teruel province total | 16 639 | 2869 | 17.2% | (15.8%–18.6%) | 2163 | 13.0% | (11.6%–14.4%) | 5032 | 30.2%** | (29.0%–31.5%) | |
| HUESCA | Barbastro | 13 741 | 2491 | 18.1% | (16.6%–19.6%) | 1962 | 14.3%* | (12.7%–15.8%) | 4453 | 32.4%* | (31.0%–33.8%) |
| Huesca | 13 497 | 2233 | 16.5%* | (15.0%–18.1%) | 1500 | 11.1%* | (9.5%–12.7%) | 3733 | 27.7%* | (26.2%–29.1%) | |
| Huesca province total | 27 238 | 4724 | 17.3% | (16.3%–18.4%) | 3462 | 12.7%** | (11.6%–13.8%) | 8186 | 30.1%** | (29.1%–31.0%) | |
| ZARAGOZA | Calatayud | 4401 | 819 | 18.6% | (15.9%–21.2%) | 784 | 17.8%* | (15.1%–20.4%) | 1603 | 36.4%* | (34.0%–38.7%) |
| Zaragoza I | 27 345 | 4808 | 17.6% | (16.5%–18.6%) | 3485 | 12.7%* | (11.6%–13.8%) | 8293 | 30.3%* | (29.3%–31.3%) | |
| Zaragoza II | 45 162 | 8122 | 18.0% | (17.1%–18.8%) | 5782 | 12.8%* | (11.9%–13.7%) | 13,904 | 30.8% | (30.0%–31.6%) | |
| Zaragoza III | 40 550 | 7276 | 17.9% | (17.1%–18.8%) | 5841 | 14.4%* | (13.5%–15.3%) | 13,117 | 32.3%* | (31.5%–33.1%) | |
| Zaragoza province total | 117 458 | 21 025 | 17.9%** | (17.4%–18.4%) | 15,892 | 13.5%** | (13.0%–14.1%) | 36,917 | 31.4%** | (31.0%–31.9%) | |
| ARAGON overall | 161 335 | 28 618 | 17.7% | (17.3%–18.2%) | 21,517 | 13.3% | (12.9%–13.8%) | 50,135 | 31.1% | (30.7%–31.5%) | |
Significant difference in the health care sector * or province ** compared to the rest of Aragon found with the χ2 test.
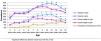
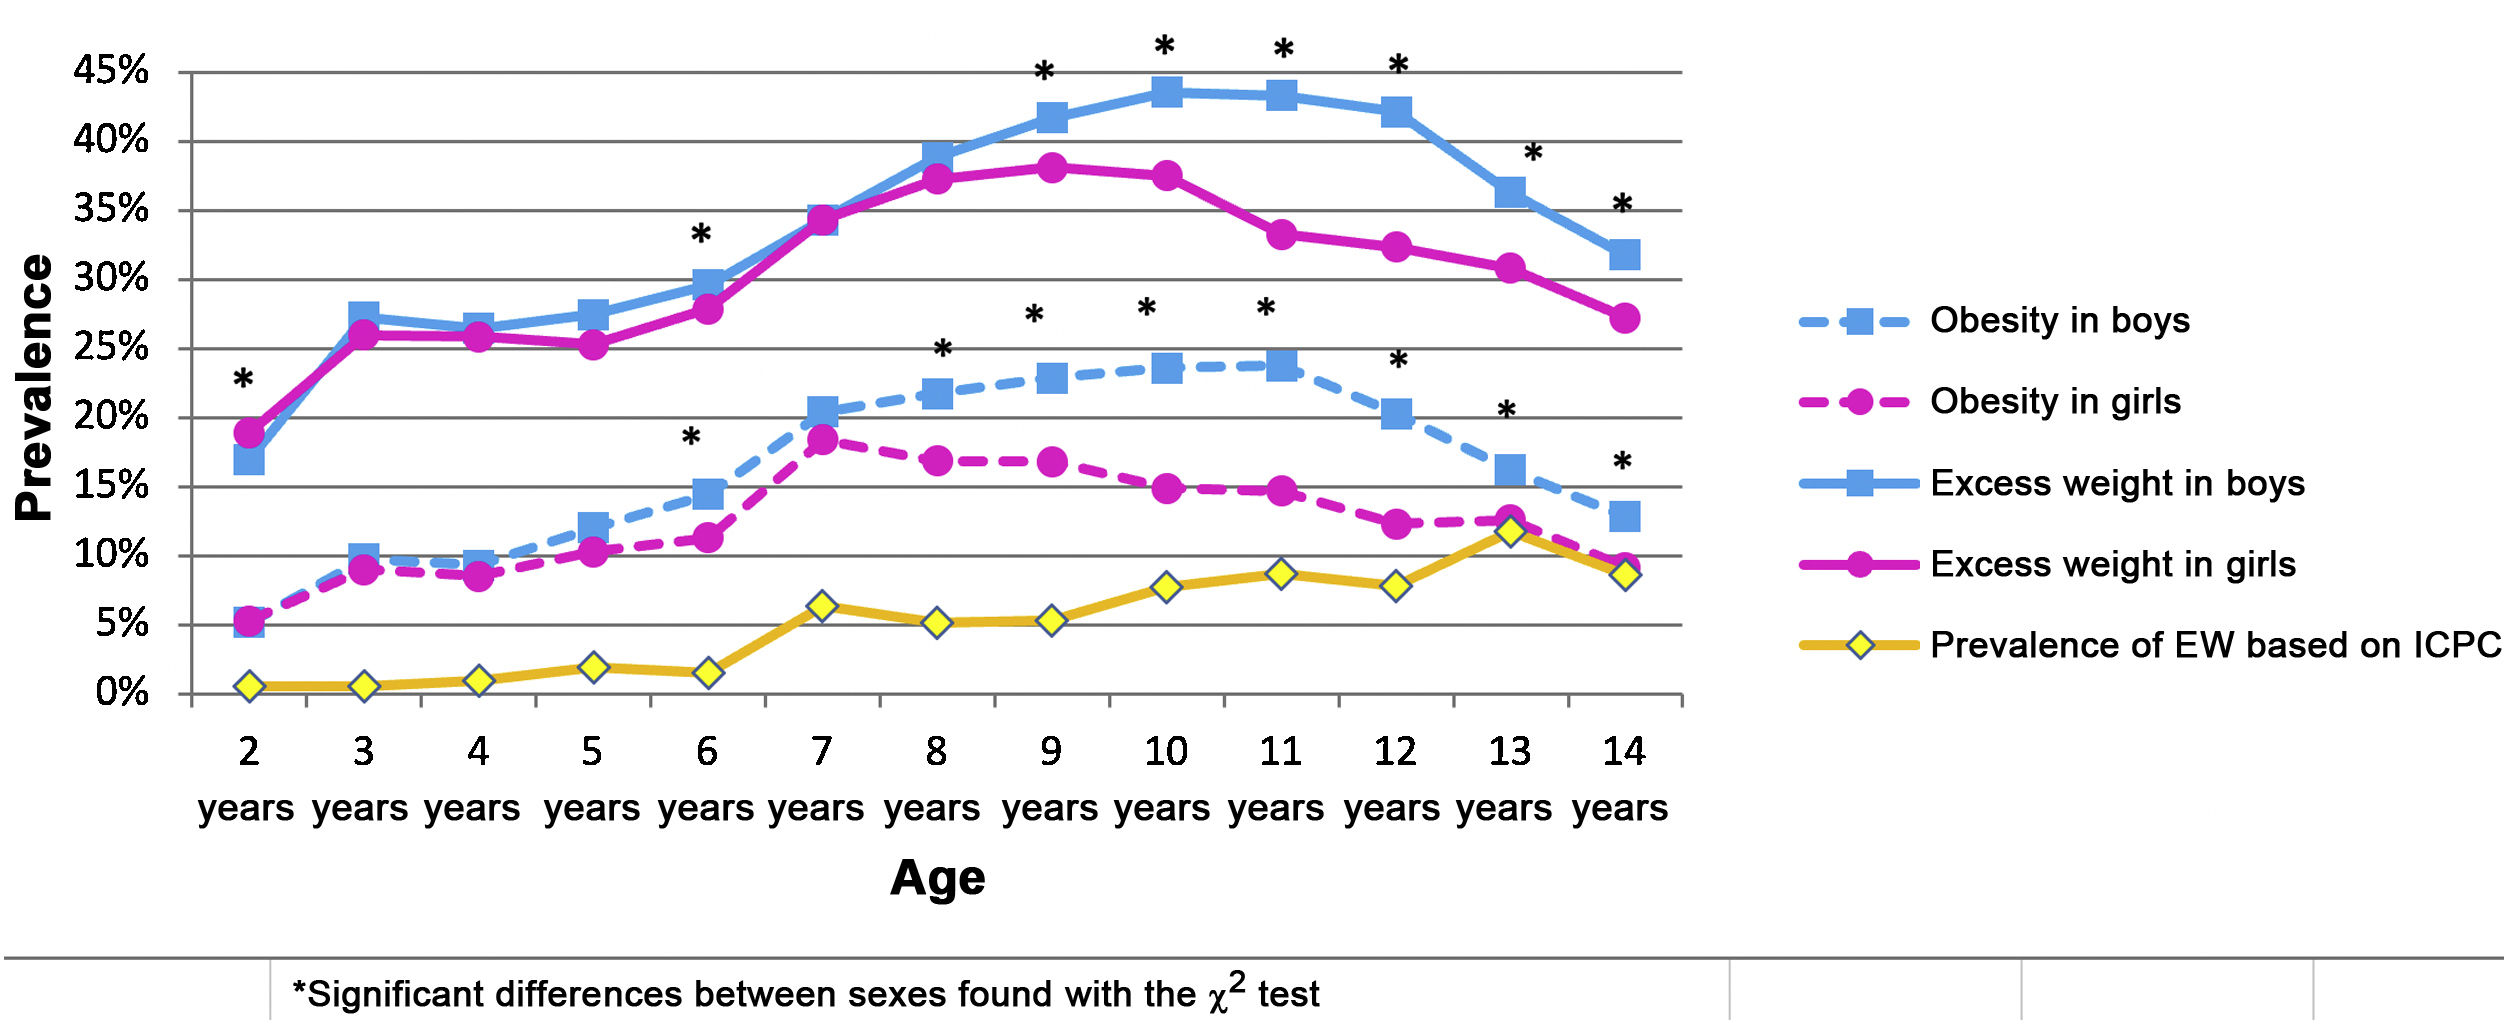
Fig. 1 shows the prevalence of EW and obesity by sex and age and the percentage of children whose records included an International Classification of Primary Care (ICPC) code for overweight or obesity by age. We found higher frequencies of EW and obesity in boys at every age except 2 years, with significant differences compared to girls at ages 6, 8, 9, 10, 11, 12, 13 and 14 years. The percentage of underdiagnosis in the health records was high at every age. In children under 6 years, fewer than 7% of patients with EW had a diagnostic code in the health record, and at age 13 years, the percentage was 34.8%.
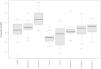
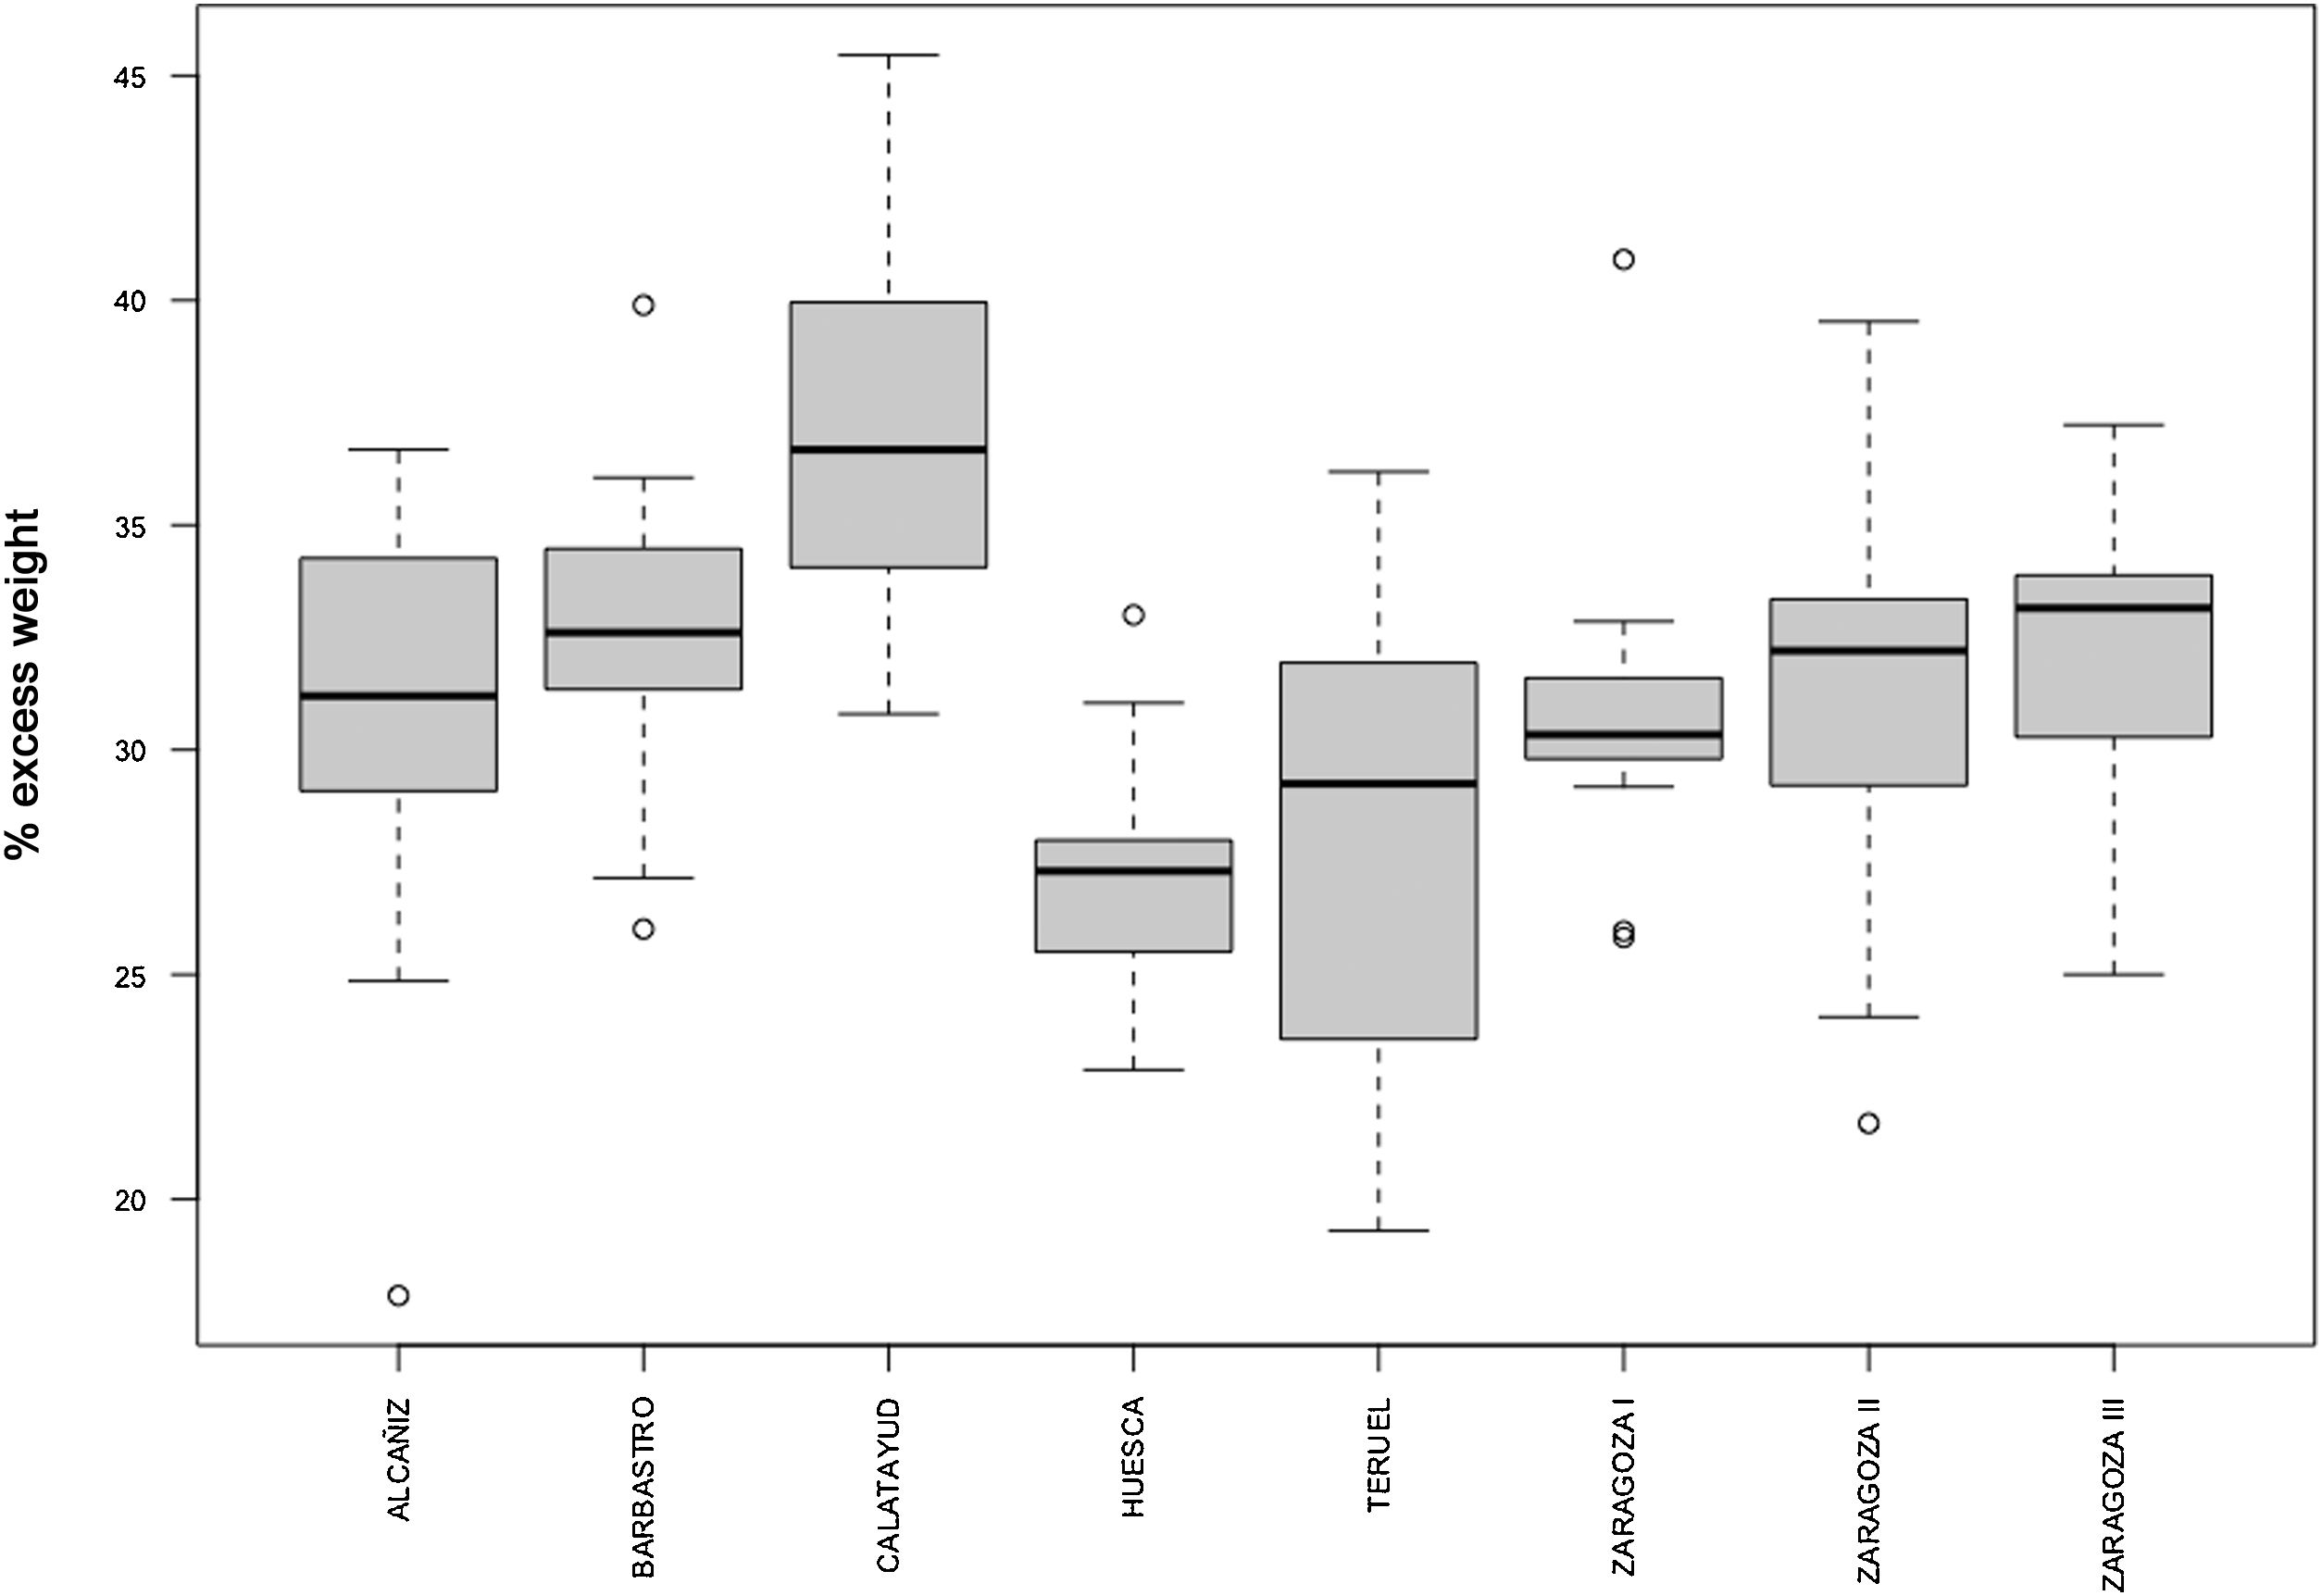
By province, Zaragoza was the one with a significantly greater prevalence of obesity and EW (P < .001 for both). We found significant differences in the prevalence of EW between health care sectors, with a markedly greater prevalence in Calatayud and lesser prevalence in Huesca and Teruel (Fig. 2).
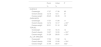
Overall, rural areas in Aragon had significantly higher prevalences of obesity (P < .001) and EW (P < .05). In the provinces of Zaragoza and Teruel, the observed prevalences of obesity and EW were significantly higher in rural areas, but we did not find significant differences based on the setting in the province of Huesca (Table 3). We also found no differences in prevalence comparing by HCD or health care sector.
Prevalence of overweight, obesity and excess weight by province, overall and in rural versus urban settings.
| Rural | Urban | P | |
|---|---|---|---|
| % | % | ||
| HUESCA | |||
| Overweight | 17.27 | 17.38 | .83 |
| Overall obesity | 12.18 | 13.0 | .51 |
| Excess weight | 29.45 | 30.39 | .10 |
| ZARAGOZA | |||
| Overweight | 17.57 | 17.99 | .11 |
| Overall obesity | 14.74 | 13.17 | < .001* |
| Excess weight | 32.31 | 31.16 | .026* |
| TERUEL | |||
| Overweight | 17.61 | 16.74 | .14 |
| Overall obesity | 13.67 | 12.09 | < .001* |
| Excess weight | 31.29 | 28.83 | < .001* |
| ALL OF ARAGON | |||
| Overweight | 17.52 | 17.82 | .14 |
| Overall obesity | 13.98 | 13.08 | < .001* |
| Excess weight | 31.49 | 30.91 | .022* |
P values calculated with the χ2 test.
We found a significant positive correlation between the DI and the overall prevalence of overweight (r = 0.18; P < .05), obesity (r = 0.43; P < .001) and EW (r = 0.4; P < .001) in the whole of Aragon. The linear regression model showed that socioeconomic factors are associated with the development of obesity. The DI explained 17.9% of the variance of obesity and 15.5% of the variance of EW (adjusted R2, Table 4).
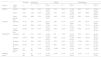
Correlation and results of regression analysis comparing obesity and excess weight with the deprivation index in Aragon, its provinces and their urban and rural settings.
| Correlation | P | B | IC 95% | P | Adjusted R2 | ||
|---|---|---|---|---|---|---|---|
| Aragon (n = 123) | Overweight | 0.179 | .048 | 0.46 | 0.004 a 0.925 | .048 | 0.0239 |
| Overall obesity | 0.432 | < .001 | 1.41 | 0.879 a 1.938 | < .001 | 0.1797 | |
| Excess weight | 0.404 | < .001 | 1.87 | 1.109 a 2.637 | < .001 | 0.1559 | |
| Rural Aragon (n = 76) | Overweight | 0.188 | ns | ||||
| Overall obesity | 0.251 | .029 | 0.91 | 0.0925 a 1.728 | .029 | 0.0497 | |
| Excess weight | 0.283 | .013 | 1.51 | 0.3226 a 2.696 | .014 | 0.0674 | |
| Urban Aragon (n = 47) | Overweight | 0.264 | ns | ||||
| Overall obesity | 0.819 | < .001 | 2.07 | 1.635 a 2.503 | < .001 | 0.6647 | |
| Excess weight | 0.708 | < .001 | 2.41 | 1.686 a 3.130 | < .001 | 0.4895 | |
| HUESCA (n = 29) | Overweight | −0.10 | ns | ||||
| Overall obesity | 0.371 | .048 | 1.25 | 0.0141 a 2.4891 | .048 | 0.1056 | |
| Excess weight | 0.18 | ns | |||||
| Rural Huesca (n = 22) | Overweight | −0.17 | ns | ||||
| Overall obesity | 0.193 | ns | |||||
| Excess weight | 0.014 | ns | |||||
| Urban Huesca (n = 7) | Overweight | 0.19 | ns | ||||
| Overall obesity | 0.855 | .014 | 2.13 | 0.6453 a 3.6213 | .014 | 0.6771 | |
| Excess weight | 0.71 | ns | |||||
| ZARAGOZA (n = 66) | Overweight | 0.35 | .005 | 0.66 | 0.2102 a 1.1036 | .005 | 0.105 |
| Overall obesity | 0.49 | < .001 | 1.54 | 0.8604 a 2.2326 | < .001 | 0.2287 | |
| Excess weight | 0.55 | < .001 | 2.20 | 1.3737 a 3.0331 | < .001 | 0.2946 | |
| Rural Zaragoza (n = 29) | Overweight | 0.40 | .03 | 0.99 | 0.1011 a 1.892 | .03 | 0.1308 |
| Overall obesity | 0.17 | ns | |||||
| Excess weight | 0.36 | ns | |||||
| Urban Zaragoza (n = 37) | Overweight | 0.33 | .04 | 0.42 | 0.0143 a 0.8289 | .04 | 0.0867 |
| Overall obesity | 0.83 | < .001 | 2.12 | 1.6429 a 2.6016 | < .001 | 0.6891 | |
| Excess weight | 0.74 | < .001 | 2.54 | 1.7673 a 3.3206 | < .001 | 0.5456 | |
| TERUEL (n = 28) | Overweight | 0.26 | ns | ||||
| Overall obesity | 0.38 | .044 | 1.22 | 0.0359 a 2.4073 | .044 | 0.1143 | |
| Excess weight | 0.40 | .036 | 2.14 | 0.15 a 4.14 | .036 | 0.1258 | |
| Rural Teruel (n = 25) | Overweight | 0.28 | ns | ||||
| Overall obesity | 0.34 | ns |
ns, not significant.
When we compared the urban versus rural settings in Aragon overall, we found a strong and significant correlation in urban HCDs between the DI and obesity (r = 0.82; P < .001) and the DI and EW (r = 0.71; P < .001). In rural HCDs, the correlation coefficients were only 0.25 for obesity and 0.28 for excess weight (Table 4); and the linear regression model showed that in urban areas, the DI could explain up to 66.4% of the variance in obesity and 48.9% of the variance in EW (adjusted R2), while these percentages were much smaller in rural areas (Table 4).
DiscussionIn our study, we found high prevalences of obesity and EW in the paediatric population of Aragon, with differences between the sexes and a significantly higher prevalence in boys (Fig. 1). In addition, the prevalence of EW was clearly associated with the DI and was higher in areas with households of lower socioeconomic status.
The overall prevalence of EW (30.3%) was similar to the one found in our previous study limited to Sector II of Zaragoza (30.8%),10 which is predominantly urban. However, we found that the prevalence of obesity had increased from 12.2% to 12.8% (P < .05) in only 5 years. While this is a short time span, and there has not been an overall increase in EW, this increase in the prevalence of obesity suggests that the situation continues to worsen as time goes by.
The correlation found between the DI and EW and obesity is particularly important. The variables with which the DI is obtained contribute information on aspects as relevant as education, employment, occupation and demographics, so this index holds information on the percentage of unemployment, temporary employment, insufficient education and foreign nationals in each HCD. In urban areas, the correlation was very strong, which corroborates the descriptions of other authors of the impact of socioeconomic factors not only on the prevalence of obesity, but also on its severity.22,23 Although the aetiology of obesity is multifactorial, our findings support the hypothesis that these determinants of health need to be improved if we aim at reducing this important public health problem.
In rural areas, the correlation of the DI with EW and with obesity at the HCD level was not as high (Table 4), suggesting that there may be lifestyle, sociocultural, family or dietary factors that ameliorate the impact of health determinants on obesity. Living in rural areas may reduce sedentary habits and/or promote healthier dietary habits.
As was the case in our previous study,10 we found an important under-recording of obesity in the health records. Although it decreased with increasing patient age, this under-recording probably reflects a minimization of EW as a health problem until it progresses to obesity. This is alarming, as underdiagnosis or delayed diagnosis probably entail a decreased likelihood of early preventive intervention. However, documentation in health records in the form of an ICPC code was significantly more frequent compared to our previous 2014 study (26.6% compared to 34.8% at age 13 years; P < .001), which may reflect a growing concern about the issue.
The large sample size of our study guarantees the reliability of its findings. Thus, we believe that the results constitute an adequate reference and could be used in the monitoring of in the paediatric population of the autonomous community of Aragon, in addition to allowing comparisons with other regions or countries.
One of the limitations of our study is that the DI data were from 2011 (more recent data were not available), and this variable may have changed since. In addition, the definitions of obesity and overweight are not homogeneous across studies in the literature, and there is no consensus on the standards to be used for reference, which may result in differences in the measurement of prevalence and hinder comparisons between our results and those of other studies. At any rate, we believe that indicators of obesity and overweight should be based on reference standards such as those of the WHO, and we invite other authors to apply them.
The results of the study highlight the areas requiring more intense or urgent intervention, and the substantial under-recording warns of the need to create awareness among health care professionals. On the other hand, our results hinted at other factors yet unidentified that warrant continued investigation of this important health problem.
ConclusionIn Aragon, the prevalence of obesity and EW is high and could be increasing, which is a public health problem of utmost importance.
We found a strong correlation between EW and the socioeconomic characteristics of the family.
The correlation between EW and socioeconomic factors was stronger in urban settings.
FundingThis research did not receive any external funding.
Conflicts of interestThe authors have no conflicts of interest to declare.
