


Disordered Eating Attitudes and Behaviours (DEABs) can impact both the mental and physical health of children. Early detection is crucial to prevent complications and improve outcomes. The Eating Attitudes Test-26 (EAT-26) is a widely used, cost-effective tool for assessing DEABs.
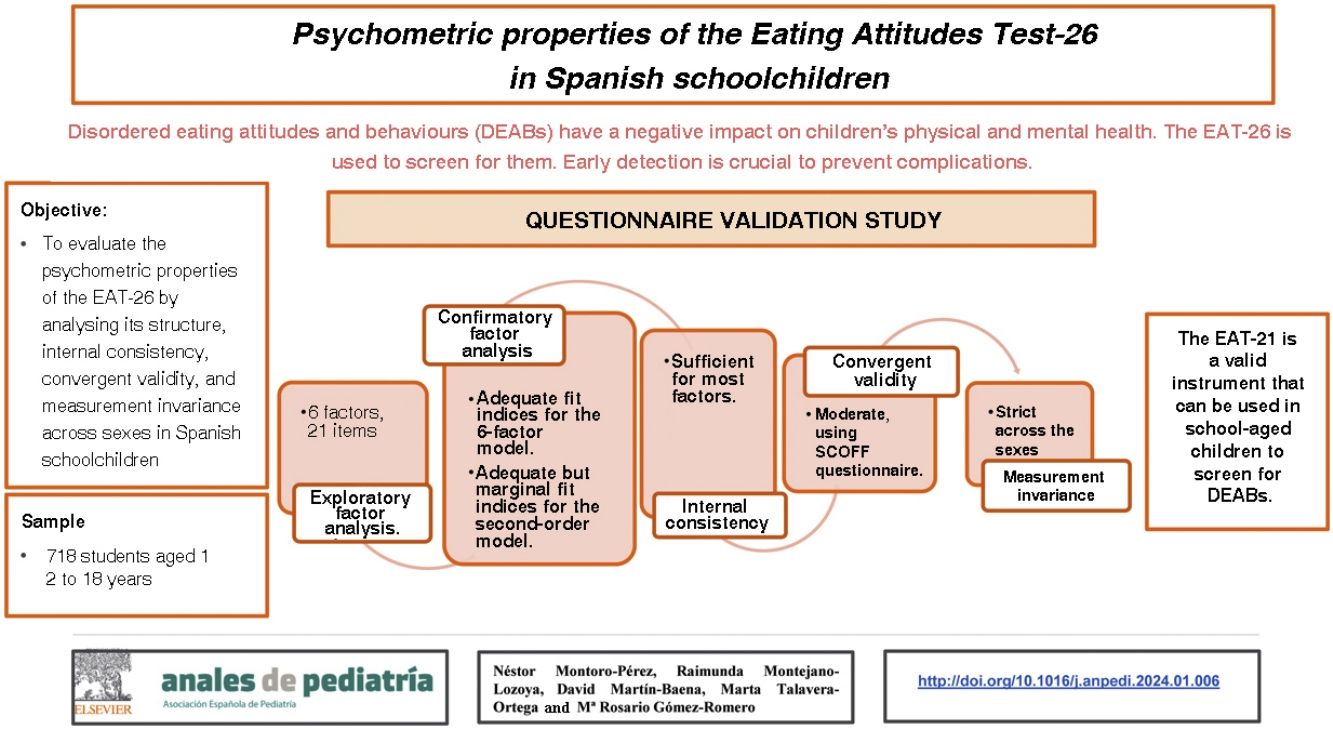
ObjectiveTo evaluate the psychometric properties of the EAT-26 by analysing its factor structure, internal consistency, convergent validity, and measurement invariance across sexes in Spanish schoolchildren.
MethodValidation study in a sample of 718 schoolchildren. The sample was randomly divided into 2 groups, each with 359 participants, and we carried out an exploratory factor analysis (EFA) and a confirmatory factor analysis (CFA) of the instrument. Subsequently, we assessed the internal consistency by means of the ordinal alpha, the convergent validity with the SCOFF questionnaire and the measurement invariance across the sexes.
ResultsThe results of the EFA and CFA supported a multidimensional structure of the EAT comprising 6 factors and 21 items. These factors underlie a second-order model of DEABs. The internal consistency was adequate for most factors. The SCOFF questionnaire showed a moderate convergent validity for most of the EAT-21 factors. We found measurement invariance across the sexes.
ConclusionsThe abbreviated EAT-21 scale exhibited modest and promising psychometric properties, making it a suitable instrument for assessing DEABs in both sexes in educational settings.
Las Actitudes y Comportamientos Alimentarios Desordenados (DEAB, por sus siglas en inglés) pueden afectar tanto a la salud mental como física en los niños/as. Su detección temprana es crucial para prevenir complicaciones y mejorar las posibilidades de recuperación. El Eating Attitudes Test-26 (EAT-26) es una herramienta ampliamente utilizada para evaluar los DEAB debido a su costo-efectividad.
ObjetivoEvaluar las propiedades psicométricas del EAT-26, analizando la estructura factorial, consistencia interna, validez convergente e invarianza de medida entre ambos sexos en escolares españoles.
MétodoEstudio instrumental con una muestra de 718 escolares. La muestra se dividió aleatoriamente en dos grupos, cada uno con 359 participantes, realizando un Análisis Factorial Exploratorio (AFE) y un Análisis Factorial Confirmatorio (AFC). Posteriormente, se estimó la consistencia interna con el alfa ordinal, la validez convergente con el cuestionario SCOFF y la invarianza de medida entre ambos sexos.
ResultadosLos hallazgos del AFE y AFC respaldaron una estructura multidimensional del EAT, compuesta por seis factores y 21 ítems. Estos factores subyacen en un modelo de segundo orden de las DEAB. La consistencia interna fue suficiente para la mayoría de los factores. Se mostró una validez convergente moderada con el cuestionario SCOFF para la mayoría de los factores del EAT-21. Se alcanzó una invarianza de medida entre ambos sexos.
ConclusionesLa escala abreviada EAT-21, mostró unas propiedades psicométricas modestas y prometedoras, constituyendo un instrumento adecuado para la evaluación de las DEAB, en niños y niñas, en contextos docentes.
Disordered Eating Attitudes and Behaviours (DEABs) constitute a spectrum of disease characterised by disordered eating attitudes and behaviours as well as disturbances in relation to perception and experience of their own body weight and shape.1,2 The classification of feeding and eating disorders of the American Psychiatric Association3 includes anorexia nervosa, bulimia nervosa, binge-eating disorder, other specified disorders and unspecified feeding and eating disorders. Anorexia nervosa and bulimia nervosa are among the most prevalent disorders in school-aged children.4 The prevalence of these disorders in school-aged children across the world ranges between 0.5% and 2.5%.2
On one hand, DEABs can have a negative impact on physical and mental health and are therefore associated with a high mortality.5 Early detection of DEABs is crucial to prevent complications and increase the probability of recovery.6 The Eating Attitudes Test-26 (EAT-26), developed by Garner et al.,7 is a widely used tool to assess DEABs due to its cost-effectiveness.8,9 This instrument has been validated in several populations (clinical and nonclinical samples) and different languages (English, Arabic, Japanese, Italian, Hebrew and Spanish).6,10–15
On the other hand, schools are an optimal setting to implement DEAB prevention and detection programmes, given the substantial amount of time young people spend in these institutions.16 However, more studies are needed to assess the psychometric properties of EAT-26 in this setting. Inconsistent and inconclusive study findings have raised concerns about the factorial structure and usefulness of the EAT-26 as a screening tool in nonclinical samples.14 Attempts to replicate the original factor structure (diet, bulimia and oral control) proposed by Garner et al.7 have been unsuccessful in samples of school-aged children in nonclinical settings. In fact, studies in school settings have described between 4 and 6 factors.8,9,14,17 Maïano et al.8 and McEnery et al.9 carried out an extensive investigation of the factor structure of the EAT-26 in one of the largest European samples to date, and their statistical analyses revealed a similar structure for the instrument that included 6 factors (fear of getting fat, eating-related control, eating-related guilt, food preoccupation, vomiting-purging behaviour and social pressure to gain weight).
A less studied but also important aspect is to ascertain measurement invariance in different subgroups. Most studies in schoolchildren have used samples composed exclusively of girls10,12,15,17 despite the growing tendency of boys to experience DEABs in the transition from childhood to adolescence.2,18 Therefore, it is essential to assess the performance of the EAT-26 in male as well as female students.
In Spain, previous validation studies of the EAT-2612,15 have used statistical methods that did not conform to the latest guidelines,19,20 which limits their results. The use of orthogonal rotations and the factor extraction method used in these studies can distort the factor structure and underestimate the actual number of factors.19,20 In consequence, the primary objective of our study was to assess the psychometric properties of the EAT-26, analysing its factor structure, internal consistency, convergent validity and measurement invariance in a sample of Spanish schoolchildren of both sexes.
Material and methodsStudy designWe conducted a validation study of the EAT-26 between September 2019 and February 2020, in secondary education students enrolled in 5 schools in the Valencian Community, Spain. Four schools were in the province of Valencia and one in the province of Alicante. Of the 4 schools in the province of Valencia, 2 were in the city of Valencia and the other 2 in rural towns near the city with fewer than 30 000 inhabitants; the school in the province of Alicante was in a rural setting inland. The socioeconomic level of the areas where the study was conducted varied from low to high. All participating schools were part of the public education system, four were state schools and one a publicly funded private school. When it came to the educational programmes offered, 2 offered compulsory secondary education (ESO, escuela secundaria obligatoria), vocational education (FP, formación profesional) and non-compulsory secondary education (bachillerato), 2 offered ESO and bachillerato studies, and 1 offered ESO and VE programmes.21
ParticipantsParticipants were recruited by convenience sampling. The sample size was calculated according to the most recent statistical recommendations, which yielded a minimum sample size of 500 participants.19 We excluded incomplete cases. The inclusion criteria were: (a) student aged 12 to 18 years (b) current enrolment in the school. We excluded students with known mental health disorders diagnosed by a physician.
Variables and instruments- -
Sociodemographic and clinical variables: age (in years, continuous variable); sex (male, female); nationality (Spanish, other); weight status based on Body Mass Index (BMI) (underweight, <18.5; normal weight, 18.5–24.9; overweight, 25–29.9; obesity >30).22
- -
Eating Attitudes Test-26 (EAT-26): originally developed by Garner et al.7 and later validated in Spain by Gandarillas et al.12 It is a self-report measure to assess DEABs. It consists of 26 items in 3 dimensions: (a) diet, (b) bulimia and (c) oral control. The items are rated on a 6-point Likert scale (1 = never to 6 = always) that is subsequently transformed into a 4-point Likert scale (0 = never to 3 = always). A score greater than 20 is indicative of DEABs.10 The scale has exhibited a moderate to adequate internal consistency internationally (>0.70).7,10
- -
SCOFF questionnaire: originally developed by Morgan et al.23 and subsequently validated in Spain by Rueda et al.24 It is a unidimensional instrument comprised of 5 items that assess different DEABs. Participants answer on a dichotomous scale (yes/no). Answering “yes” to 2 or more questions constitutes a positive result. In studies conducted in different countries, the internal consistency of the SCOFF questionnaire has ranged between 0.4 and 0.7, values considered sufficient for screening instruments.23,24
All participants who agreed to participate in the study were given a form to take home so that their parents or legal guardians could provide informed consent. The form included detailed information about the name, objectives and relevance of the study and about the confidentiality of the data. Participants in the study received another document containing all the variables under study.
Statistical analysisWe divided total number of observations (N = 718) into 2 samples, sample 1 (n = 359) and sample 2 (n = 359). All the analyses were carried out with the free software R (version 6.3). We assessed the performance of the instrument by calculating the symmetry, kurtosis and floor and ceiling effects. Asymmetry and kurtosis coefficients of less than −1.5 or more than 1.5, violate the assumption of a normal distribution.19 We considered that there was a floor or ceiling effect if more than 15% of the responses of participants were in the lowest or highest answer categories, respectively, which suggests that the measure cannot discriminate between subjects at either end of the scale.25 Applying the criteria proposed by Rhemtulla et al.,26 we treated the data as ordinal. We analysed the structure of the instrument using exploratory factor analysis (EFA) in sample 1. To determine whether the data were suited for EFA, we used the Kaiser-Meyer-Olkin (KMO) (suitable if KMO ≥0.7027), Bartlett’s test of sphericity (suitable if P < .0528) and the coefficient of determination (suitable if near zero). To determine the number of factors in the instrument, we used Horn’s parallel analysis.19,29 The EFA was performed with the psych package using the unweighted least-squares (ULS) method, recommended for categorical data without a normal distribution,30 and Promax oblique rotation using dimensions highly correlated to the construct being measured.19 The criteria used for the selection and finetuning of the items were: (a) saturation ≥0.40 and (b) elimination of Heywood cases (saturation ≥1).30 Subsequently, we assessed the structure obtained in the EFA with confirmatory factor analysis (CFA) in sample 2 with the lavaan package using the robust weighted least squares mean and variance (WLSMV) estimate, recommended for ordinal data.25 We adjusted the fit of the model using the comparative fit index (CFI), the Tucker-Lewis index (TLI) and the root mean square error of approximation (RMSEA), considering the following variables adequate: CFI > 0.90, TLI > 0.90 and RMSEA < 0.06.20,31,32 We proposed 4 statistical adjustments: (1) tau-equivalence, (2) congeneric model, (3) correlated errors (modification index >35 000) and (4) second-order model. We rejected models with Heywood cases, correlated errors that were incoherent at the theoretical level and negative variances.31 We assessed internal consistency through the calculation of the ordinal α coefficient, which offers a more precise estimate for scales with categorical outcomes. An α coefficient of 0.70 or greater indicates adequate reliability.20,33 We assessed convergent validity by calculating the product-moment correlation between the obtained factors and items of the EAT and the SCOFF questionnaire.34 We expected significant correlations between 0.2 and 0.7.20 Measurement invariance was assessed at 4 levels: (a) configurational invariance, b) metric invariance, (c) strong invariance and (d) strict invariance. We considered a change in the CFI (ΔCFI) of 0.010 or less and a change in the RMSEA (ΔRMSEA) of 0.015 or less insignificant in the comparison of different levels of measurement invariance.35,36
Ethical considerationsAll participants agreed to participate in the study on a voluntary basis. The study was approved by the Ethics Committee (file no. 2016/0794). We safeguarded privacy and data confidentiality in adherence with regulation (EU) 2016/679 of the European Parliament and Council of April 27, 2016.
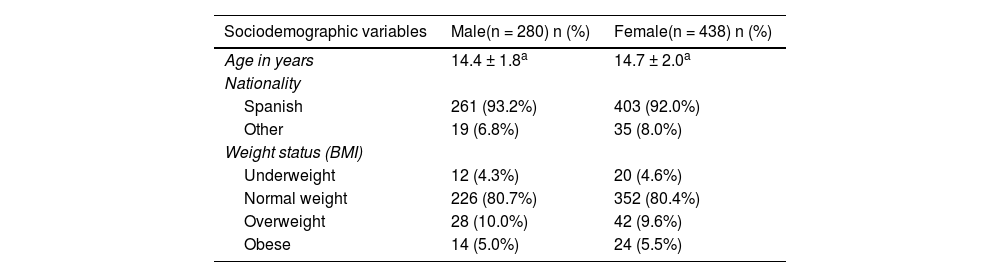
ResultsStudy sampleThe recruited sample included 725 participants, and, after excluding incomplete questionnaires (n = 7; 0.96%), the final sample included 718 participants (99.04%). We ought to mention that none of the students refused to participate. Of the 718 students included in the analysis, 39% were male and 61% female, with mean ages of 14.4 years (SD, 1.8) and 14.7 years (SD, 2.0), respectively. Most were Spanish, had a social support network and a normal weight (Table 1).
Sociodemographic characteristics of the sample.
| Sociodemographic variables | Male(n = 280) n (%) | Female(n = 438) n (%) |
|---|---|---|
| Age in years | 14.4 ± 1.8a | 14.7 ± 2.0a |
| Nationality | ||
| Spanish | 261 (93.2%) | 403 (92.0%) |
| Other | 19 (6.8%) | 35 (8.0%) |
| Weight status (BMI) | ||
| Underweight | 12 (4.3%) | 20 (4.6%) |
| Normal weight | 226 (80.7%) | 352 (80.4%) |
| Overweight | 28 (10.0%) | 42 (9.6%) |
| Obese | 14 (5.0%) | 24 (5.5%) |
BMI, Body Mass Index.
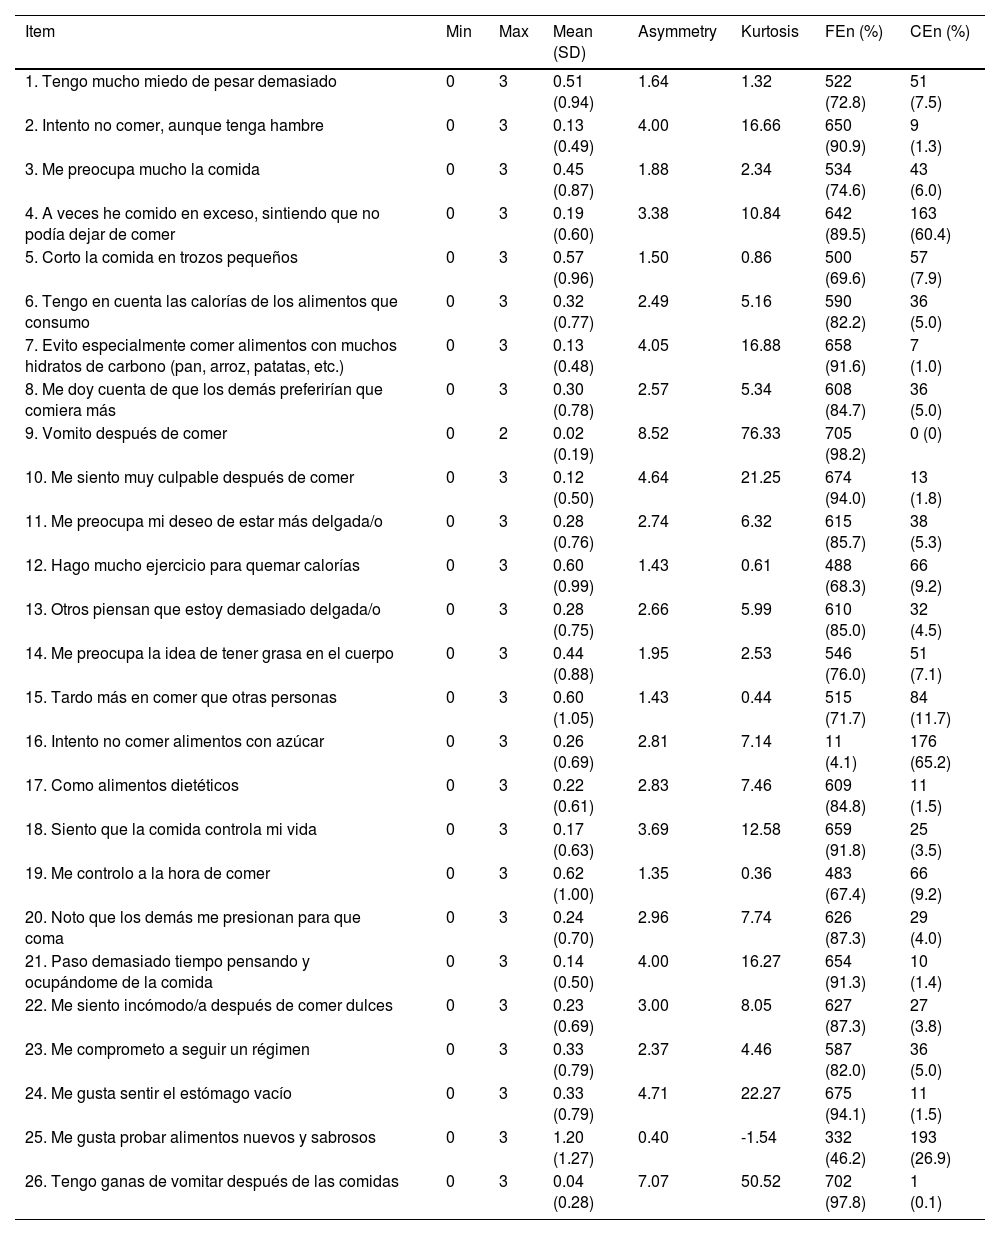
Table 2 presents the performance of the scores of the EAT-26 items. We found floor and ceiling effects, asymmetry and kurtosis, and therefore considered the data to be ordinal.
Descriptive statistics for each item.
| Item | Min | Max | Mean (SD) | Asymmetry | Kurtosis | FEn (%) | CEn (%) |
|---|---|---|---|---|---|---|---|
| 1. Tengo mucho miedo de pesar demasiado | 0 | 3 | 0.51 (0.94) | 1.64 | 1.32 | 522 (72.8) | 51 (7.5) |
| 2. Intento no comer, aunque tenga hambre | 0 | 3 | 0.13 (0.49) | 4.00 | 16.66 | 650 (90.9) | 9 (1.3) |
| 3. Me preocupa mucho la comida | 0 | 3 | 0.45 (0.87) | 1.88 | 2.34 | 534 (74.6) | 43 (6.0) |
| 4. A veces he comido en exceso, sintiendo que no podía dejar de comer | 0 | 3 | 0.19 (0.60) | 3.38 | 10.84 | 642 (89.5) | 163 (60.4) |
| 5. Corto la comida en trozos pequeños | 0 | 3 | 0.57 (0.96) | 1.50 | 0.86 | 500 (69.6) | 57 (7.9) |
| 6. Tengo en cuenta las calorías de los alimentos que consumo | 0 | 3 | 0.32 (0.77) | 2.49 | 5.16 | 590 (82.2) | 36 (5.0) |
| 7. Evito especialmente comer alimentos con muchos hidratos de carbono (pan, arroz, patatas, etc.) | 0 | 3 | 0.13 (0.48) | 4.05 | 16.88 | 658 (91.6) | 7 (1.0) |
| 8. Me doy cuenta de que los demás preferirían que comiera más | 0 | 3 | 0.30 (0.78) | 2.57 | 5.34 | 608 (84.7) | 36 (5.0) |
| 9. Vomito después de comer | 0 | 2 | 0.02 (0.19) | 8.52 | 76.33 | 705 (98.2) | 0 (0) |
| 10. Me siento muy culpable después de comer | 0 | 3 | 0.12 (0.50) | 4.64 | 21.25 | 674 (94.0) | 13 (1.8) |
| 11. Me preocupa mi deseo de estar más delgada/o | 0 | 3 | 0.28 (0.76) | 2.74 | 6.32 | 615 (85.7) | 38 (5.3) |
| 12. Hago mucho ejercicio para quemar calorías | 0 | 3 | 0.60 (0.99) | 1.43 | 0.61 | 488 (68.3) | 66 (9.2) |
| 13. Otros piensan que estoy demasiado delgada/o | 0 | 3 | 0.28 (0.75) | 2.66 | 5.99 | 610 (85.0) | 32 (4.5) |
| 14. Me preocupa la idea de tener grasa en el cuerpo | 0 | 3 | 0.44 (0.88) | 1.95 | 2.53 | 546 (76.0) | 51 (7.1) |
| 15. Tardo más en comer que otras personas | 0 | 3 | 0.60 (1.05) | 1.43 | 0.44 | 515 (71.7) | 84 (11.7) |
| 16. Intento no comer alimentos con azúcar | 0 | 3 | 0.26 (0.69) | 2.81 | 7.14 | 11 (4.1) | 176 (65.2) |
| 17. Como alimentos dietéticos | 0 | 3 | 0.22 (0.61) | 2.83 | 7.46 | 609 (84.8) | 11 (1.5) |
| 18. Siento que la comida controla mi vida | 0 | 3 | 0.17 (0.63) | 3.69 | 12.58 | 659 (91.8) | 25 (3.5) |
| 19. Me controlo a la hora de comer | 0 | 3 | 0.62 (1.00) | 1.35 | 0.36 | 483 (67.4) | 66 (9.2) |
| 20. Noto que los demás me presionan para que coma | 0 | 3 | 0.24 (0.70) | 2.96 | 7.74 | 626 (87.3) | 29 (4.0) |
| 21. Paso demasiado tiempo pensando y ocupándome de la comida | 0 | 3 | 0.14 (0.50) | 4.00 | 16.27 | 654 (91.3) | 10 (1.4) |
| 22. Me siento incómodo/a después de comer dulces | 0 | 3 | 0.23 (0.69) | 3.00 | 8.05 | 627 (87.3) | 27 (3.8) |
| 23. Me comprometo a seguir un régimen | 0 | 3 | 0.33 (0.79) | 2.37 | 4.46 | 587 (82.0) | 36 (5.0) |
| 24. Me gusta sentir el estómago vacío | 0 | 3 | 0.33 (0.79) | 4.71 | 22.27 | 675 (94.1) | 11 (1.5) |
| 25. Me gusta probar alimentos nuevos y sabrosos | 0 | 3 | 1.20 (1.27) | 0.40 | -1.54 | 332 (46.2) | 193 (26.9) |
| 26. Tengo ganas de vomitar después de las comidas | 0 | 3 | 0.04 (0.28) | 7.07 | 50.52 | 702 (97.8) | 1 (0.1) |
CE, Ceiling Effect; FE, Floor Effect; Max, Maximum ; Min, Minimum; SD, Standard Deviation. Positive items reverse scored. Descriptive statistics were based on a 4-point Likert-type scale. On the 6-point Likert scale, items 10, 18, 19, 20, 21, 24 and 26 showed asymmetry and kurtosis.
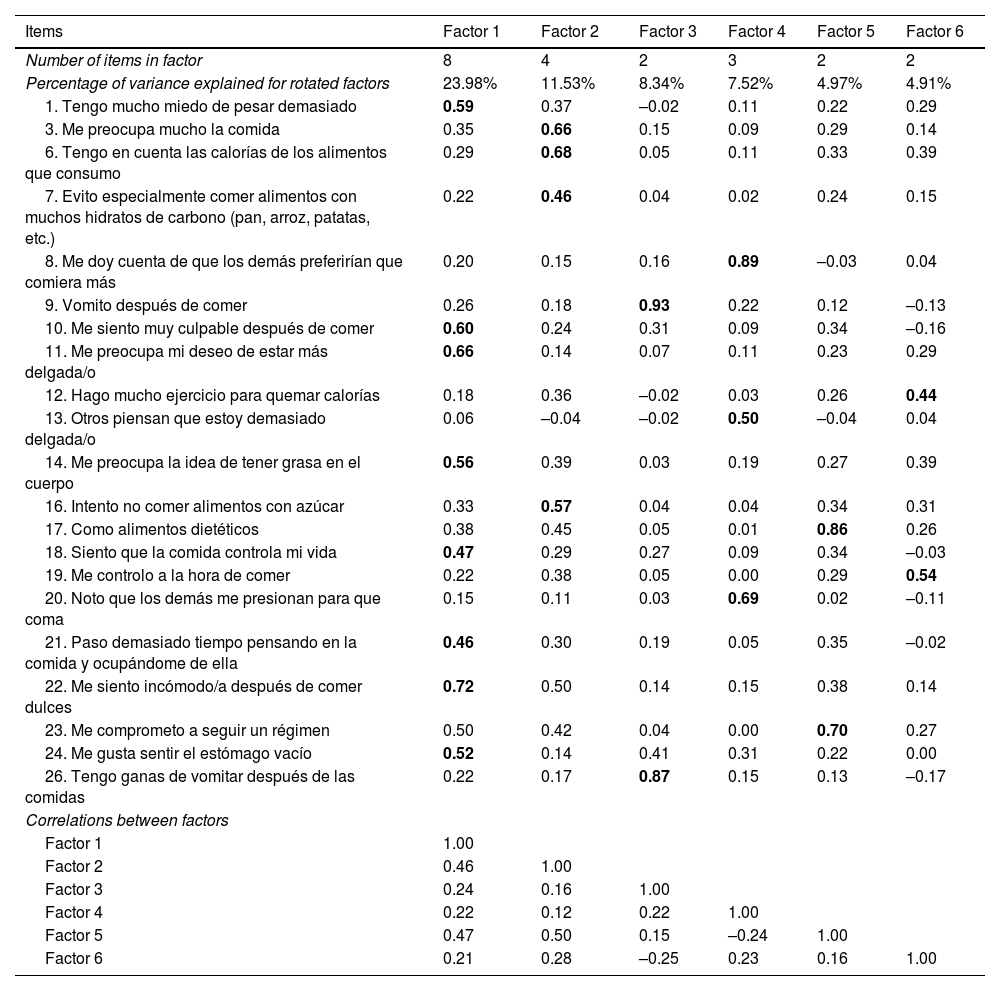
We conducted 3 consecutive Horn parallel analyses with the corresponding EFAs on the initial set of 26 items. The items to be eliminated in each round were selected according to the preestablished criteria. Each EFA yielded a KMO of 0.70 or greater, a P value of less than 0.05 in Bartlett’s test and a coefficient of determination near zero. Eventually, we eliminated items 2, 4, 5, 15 and 25 due to factor loadings of less than 0.4. The resulting KMO (0.79), Bartlett’s test of sphericity (degrees of freedom (df) = 210; P = .000) and the coefficient of determination of less than 0.001 indicated that the correlation matrix of the 21 selected items (EAT-21) and the 6 factors suggested by the parallel analysis were suitable for EFA. The variance explained by each rotated factor was: factor 1 (23.98%); factor 2 (11.53%); factor 3 (8.34%); factor 4 (7.52%); factor 5 (4.97%) and factor 6 (4.91%) (Table 3).
Items, dimensions, factor loadings and correlations between factors.
| Items | Factor 1 | Factor 2 | Factor 3 | Factor 4 | Factor 5 | Factor 6 |
|---|---|---|---|---|---|---|
| Number of items in factor | 8 | 4 | 2 | 3 | 2 | 2 |
| Percentage of variance explained for rotated factors | 23.98% | 11.53% | 8.34% | 7.52% | 4.97% | 4.91% |
| 1. Tengo mucho miedo de pesar demasiado | 0.59 | 0.37 | –0.02 | 0.11 | 0.22 | 0.29 |
| 3. Me preocupa mucho la comida | 0.35 | 0.66 | 0.15 | 0.09 | 0.29 | 0.14 |
| 6. Tengo en cuenta las calorías de los alimentos que consumo | 0.29 | 0.68 | 0.05 | 0.11 | 0.33 | 0.39 |
| 7. Evito especialmente comer alimentos con muchos hidratos de carbono (pan, arroz, patatas, etc.) | 0.22 | 0.46 | 0.04 | 0.02 | 0.24 | 0.15 |
| 8. Me doy cuenta de que los demás preferirían que comiera más | 0.20 | 0.15 | 0.16 | 0.89 | –0.03 | 0.04 |
| 9. Vomito después de comer | 0.26 | 0.18 | 0.93 | 0.22 | 0.12 | –0.13 |
| 10. Me siento muy culpable después de comer | 0.60 | 0.24 | 0.31 | 0.09 | 0.34 | –0.16 |
| 11. Me preocupa mi deseo de estar más delgada/o | 0.66 | 0.14 | 0.07 | 0.11 | 0.23 | 0.29 |
| 12. Hago mucho ejercicio para quemar calorías | 0.18 | 0.36 | –0.02 | 0.03 | 0.26 | 0.44 |
| 13. Otros piensan que estoy demasiado delgada/o | 0.06 | –0.04 | –0.02 | 0.50 | –0.04 | 0.04 |
| 14. Me preocupa la idea de tener grasa en el cuerpo | 0.56 | 0.39 | 0.03 | 0.19 | 0.27 | 0.39 |
| 16. Intento no comer alimentos con azúcar | 0.33 | 0.57 | 0.04 | 0.04 | 0.34 | 0.31 |
| 17. Como alimentos dietéticos | 0.38 | 0.45 | 0.05 | 0.01 | 0.86 | 0.26 |
| 18. Siento que la comida controla mi vida | 0.47 | 0.29 | 0.27 | 0.09 | 0.34 | –0.03 |
| 19. Me controlo a la hora de comer | 0.22 | 0.38 | 0.05 | 0.00 | 0.29 | 0.54 |
| 20. Noto que los demás me presionan para que coma | 0.15 | 0.11 | 0.03 | 0.69 | 0.02 | –0.11 |
| 21. Paso demasiado tiempo pensando en la comida y ocupándome de ella | 0.46 | 0.30 | 0.19 | 0.05 | 0.35 | –0.02 |
| 22. Me siento incómodo/a después de comer dulces | 0.72 | 0.50 | 0.14 | 0.15 | 0.38 | 0.14 |
| 23. Me comprometo a seguir un régimen | 0.50 | 0.42 | 0.04 | 0.00 | 0.70 | 0.27 |
| 24. Me gusta sentir el estómago vacío | 0.52 | 0.14 | 0.41 | 0.31 | 0.22 | 0.00 |
| 26. Tengo ganas de vomitar después de las comidas | 0.22 | 0.17 | 0.87 | 0.15 | 0.13 | –0.17 |
| Correlations between factors | ||||||
| Factor 1 | 1.00 | |||||
| Factor 2 | 0.46 | 1.00 | ||||
| Factor 3 | 0.24 | 0.16 | 1.00 | |||
| Factor 4 | 0.22 | 0.12 | 0.22 | 1.00 | ||
| Factor 5 | 0.47 | 0.50 | 0.15 | –0.24 | 1.00 | |
| Factor 6 | 0.21 | 0.28 | –0.25 | 0.23 | 0.16 | 1.00 |
Factor 1 (fear of getting fat), Factor 2 (eating-related control), Factor 3 (vomiting-purging behaviour), Factor 4 (social pressure to gain weight), Factor 5 (dieting behaviour), Factor 6 (food preoccupation).
The analysis was performed using a 6-point Likert scale. Values in boldface indicate that the item loads in the factor.
Continuing with the analysis of the content of the items, the factors obtained in the EFA and the studies conducted by Maïano et al.8 and McEnery et al.,9 we labelled the factors as: factor 1, “fear of getting fat”; factor 2, “eating-related control”; factor 3, “vomiting-purging behaviour”; factor 4, “social pressure to gain weight”; factor 5, “dieting behaviour” and factor 6, “food preoccupation”.
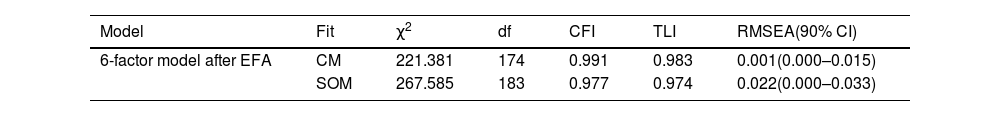
Confirmatory factor analysisTable 4 presents the results of the CFA for the models that fulfilled the predefined criteria. The 6-factor congeneric model obtained in the EFA exhibited an excellent fit, with factor loadings ranging between 0.44 and 0.95 (Fig. 1). The results of the second-order model in the CFA de revealed an acceptable fit, albeit marginally inferior to that of the congeneric model. The factor loadings of the items of the second-order model ranged between 0.40 and 0.95 (Fig. 2).
Statistics for the confirmatory factor analysis.
| Model | Fit | χ2 | df | CFI | TLI | RMSEA(90% CI) |
|---|---|---|---|---|---|---|
| 6-factor model after EFA | CM | 221.381 | 174 | 0.991 | 0.983 | 0.001(0.000–0.015) |
| SOM | 267.585 | 183 | 0.977 | 0.974 | 0.022(0.000–0.033) |
CFI, Comparative Fit Index; CI, Confidence Interval; CM, Congeneric Model; df, degrees of freedom; EFA, Exploratory Factor Analysis; RMSEA, Root Mean Square Error Approximation; SOM, Second-Order Model; TLI, Tucker-Lewis Index.
The analysis was performed using a 6-point Likert scale. Tau-equivalent model not presented because the statistical fit indices do not reach sufficient values.
, Factor 2 (eating-related control), Factor 3 (vomiting-purging behaviour), Factor 4 (social pressure to gain weight), Factor 5 (dieting behaviour), Factor 6 (food preoccupation).")
, Factor 2 (eating-related control), Factor 3 (vomiting-purging behaviour), Factor 4 (social pressure to gain weight), Factor 5 (dieting behaviour), Factor 6 (food preoccupation).")
The internal consistence, estimated with the ordinal α, was 0.81 for factor 1 (fear of getting fat) 0.66 for factor 2 (eating-related control), 0.77 for factor 3 (vomiting-purging behaviour), 0.74 for factor 4 (social pressure to gain weight), 0.67 for factor 5 (dieting behaviour) and 0.51 for factor 6 (food preoccupation).
Convergent validityTable 5 presents the results of the analysis of the product-moment correlation between the scores of the resulting EAT-21 factors and the SCOFF questionnaire. The total score of the EAT-21 was positively and significantly correlated to the SCOFF questionnaire score (r = 0.483; P < .001).
Correlations between the scores of the items in the factors identified in the EAT-21 and the SCOFF questionnaire.
| Factor 1 | Factor 2 | Factor 3 | Factor 4 | Factor 5 | Factor 6 | Total | |
|---|---|---|---|---|---|---|---|
| SCOFF | 0.535** | 0.300** | 0.233** | 0.090* | 0.370** | 0.191** | 0.483** |
Factor 1 (fear of getting fat), Factor 2 (eating-related control), Factor 3 (vomiting-purging behaviour), Factor 4 (social pressure to gain weight), Factor 5 (dieting behaviour), Factor 6 (food preoccupation).
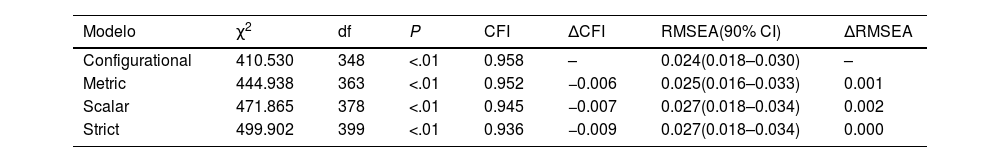
Table 6 presents the measurement invariance results. They suggests that it is reasonable to assume measurement invariance across the sexes, as none of the comparisons revealed a change in fit greater than a ΔCFI ≤ 0.010 or an ΔRMSEA ≤ 0.015.
Statistics of invariance across the sexes.
| Modelo | χ2 | df | P | CFI | ΔCFI | RMSEA(90% CI) | ΔRMSEA |
|---|---|---|---|---|---|---|---|
| Configurational | 410.530 | 348 | <.01 | 0.958 | – | 0.024(0.018–0.030) | – |
| Metric | 444.938 | 363 | <.01 | 0.952 | −0.006 | 0.025(0.016–0.033) | 0.001 |
| Scalar | 471.865 | 378 | <.01 | 0.945 | −0.007 | 0.027(0.018–0.034) | 0.002 |
| Strict | 499.902 | 399 | <.01 | 0.936 | −0.009 | 0.027(0.018–0.034) | 0.000 |
CFI, Comparative Fit Index; CI, Confidence Interval; df, degrees of freedom; RMSEA, Root Mean Square Error Approximation.
The analysis was performed using a 6-point Likert scale.
The main aim of our study was to assess the psychometric properties of the EAT-26 in a sample of Spanish students. The results yielded a version of the EAT questionnaire composed of 21 items grouped in 6 factors underlying a second-order factor. The data suggest that the EAT-21 has psychometric properties that are as promising as they are modest, with a moderate internal consistency in most factors. In addition, we observed convergent validity relative to the SCOFF questionnaire and found measurement invariance between the sexes.
The 6-factor structure identified in our study was similar to those found in several studies conducted in healthy school-aged children.8,9,14 This differed from other validation studies that usually found 3- or 4-factor structures. In Spain, only the validation study conducted by Gandarillas et al.12 succeeded in reproducing the 3-factor structure proposed by Garner et al.7 Other studies carried out in similar contexts have found a 4-factor structure.10,37 This difference in the structure of the instrument may be due to the inclusion of clinical populations8,9,14 and the use of statistical methods that do not meet the most recent recommendations.19,20 However, as we already mentioned, in the international literature the grouping of items into 6 factors is common in nonclinical paediatric samples.8,9
As for the items eliminated in the EFA, the results were similar to those of other studies. It is common for items 26,8,14, 415, 56,8,14, 156,8,14,15,37 and 256,8,14,15,37 to be eliminated. These items exhibit low factor loadings , independently of the population under study or the language. Therefore, future studies should reformulate and review the contents of the instrument to improve its performance.20
In addition, the results of the CFA confirmed the 6-factor structure yielded by the EFA with excellent fit indices, which was consistent with the previous literature.20,31,32 We also analysed a second-order model of the EAT-21. The results showed that the EAT-21 reflects the multidimensionality of DEABs with 6 factors underlying a DEAB construct. This is an advantage, as it yields a more parsimonious model. Our findings, along with those of other studies,9,15 support the cautious use of the EAT-21 as a standalone scale in clinical practice.38
The internal consistency of the scores of the EAT-21 items was adequate for most factors, in agreement with the previous literature.20 However, the values were slightly lower compared to other studies.8,9 Factors 2, 5 and 6 did not achieve the established internal consistency threshold. (α ≥ 0.70). This was also the case in the study conducted by McEnery et al.9 However, in order to preserve content validity and avoid the attenuation paradox, we decided to keep these items.39,40
We continued by assessing the convergent validity of the instrument using the SCOFF questionnaire.23,34 Overall, the correlations observed in our study were lower compared to those reported by McEnery et al.,9 but similar to those reported by Maïano et al.,8 although these authors used the Eating Disorders Inventory-3 (EDI-3) for comparison. As occurred in the studies of Maïano et al.8 and McEnery et al.,9 we found a lower correlation for factor 4 (social pressure to gain weight). A possible explanation is that this factor is usually not represented in instruments traditionally used to assess DEABs.8,9
This is one of the first studies to find a strict measurement invariance for the EAT questionnaire between both sexes in Spanish school-aged children. Our results were similar to those found by Maïano et al.8 At present, a growing number of children experience DEABs in the transition from childhood to adolescence.2,18,41 Therefore, achieving measurement invariance is an advantage, as both male and female subjectscautiously interpret the meaning of DEABs in the same way.
However, despite these results, we need to consider the limitations of the study. First of all, the internal consistency of factors 2, 5 and 6 was below the desired threshold established in the literature, highlighting the need to improve the quality of the items that compose them. Secondly, in adherence with the most recent psychometric guidelines, it would be beneficial to develop additional items for those factors composed of only two items, as they could be underrepresented. These limitations point to areas of improvement to address in future research and highlight the need to continue carrying validation studies of the EAT-21 in different settings and populations.
In conclusion, the EAT-21 is a valid instrument that can be used in Spanish school-aged children to screen for DEABs. The 6 identified factors underlie a second-order factor, which means a single EAT-21 score could be used with caution. We found measurement invariance between the sexes, which supports the equal application of the instrument to children of either sex. We encourage additional research on the psychometric properties of this instrument in different contexts.
Conflicts of interestThe authors have no conflicts of interest to declare.
This research project did not receive specific financial support from funding agencies in the public, private or not-for-profit sectors.
