


Attention-deficit/hyperactivity disorder (ADHD) is one of the most prevalent developmental problems in school age. Its diagnosis is clinical, through an adequate exploration of symptoms, psychological and performance assessments and the use of specific questionnaires and scales. P300 wave cognitive evoked potentials provide an objective measure that serves as an indicator of the cognitive processes of attention, which is therefore considered an important aid to the diagnosis of these patients.
Patients and methodWe studied the P300 wave results obtained through auditory stimuli in 26 pediatric patients: 13 with a recent clinical diagnosis of ADHD and naïve to pharmacological treatment and 13 healthy controls. We measured both the latency and amplitude of the P300 wave, comparing the values in each group, as well as the percentage of errors in the identification of the stimulus in each subject.
ResultsWe obtained reproducible responses in all study participants, with a mean (SD) latency of 354.25 (41) ms and a mean (SD) amplitude of 11.98 (5.6) µV in the ADHD group compared to 313.59 (21) ms and 13.24 (5.9) µV, respectively, in the control group. There was a higher percentage of errors in the ADHD group. We only found significant differences between groups in the latency of the P300 wave.
ConclusionPediatric patients with ADHD exhibited responses with a higher mean latency compared to peers without the disorder, so the assessment of P300 component cognitive evoked potentials could be used as an objective measure to support the diagnosis of ADHD.
El trastorno por déficit de atención/hiperactividad (TDAH) es uno de los problemas del desarrollo más prevalentes en edad escolar. Su diagnóstico es clínico, a través de una adecuada exploración de síntomas, evaluaciones psicológicas y de rendimiento y mediante el empleo de cuestionarios y escalas específicos. Los potenciales evocados cognitivos P300 son una técnica objetiva en la que sirve de indicador de los procesos cognitivos de la atención, por lo que se plantea como una importante ayuda al diagnóstico de estos pacientes.
Pacientes y métodoEstudiamos los resultados de la onda P300 obtenido mediante estímulos auditivos en pacientes 26 pacientes pediátricos, 13 de ellos con reciente diagnóstico clínico de TDAH, sin haber comenzado tratamiento farmacológico, y 13 controles sanos. Medimos tanto la latencia como la amplitud de la onda P300, comparando los valores de cada grupo, así como el porcentaje de errores en la identificación del estímulo de cada sujeto.
ResultadosObtenemos respuestas reproductibles en todos los sujetos del estudio, mostrando una latencia media de 354,25 ± 41 ms y amplitud media de 11,98 ± 5,6 µV en el grupo de pacientes con TDAH y de 313,59 ± 21 ms y amplitud media de 13,24 ± 5,9 µV en el grupo control. El grupo con TDAH muestra un mayor porcentaje de errores. Solo la latencia de la onda P300 muestra diferencias significativas entre los grupos.
ConclusiónLos pacientes pediátricos con TDAH muestran respuestas con mayor latencia media en comparación con la población sin dicha patología por lo que el estudio mediante potenciales evocados cognitivos P300 puede ser una prueba objetiva de apoyo al diagnóstico del TDAH.

Attention deficit hyperactivity disorder (ADHD) is one of the most prevalent neurodevelopmental disorders in the school-aged population (3%–10%, depending on the study1,2), and it is characterized by inattention, hyperactivity, marked impulsivity, or a combination thereof.3
The disorder has onset in childhood and affects up to 5%–10% of school-aged children.4
The diagnosis of ADHD is based on clinical criteria concerning the behavior of pediatric patients and, at times, the subjective perceptions of either patients or family members may lead to misdiagnosis, contributing to the frequency of false positives. This is why objective tests need to be used to confirm a suspected diagnosis and avoid initiation of treatment in patients who do not need it.
The assessment of cognitive functions has been performed for many years, starting in the last century, but it was not until the use of computerized systems became widespread that signal averaging and measurement of cerebral processes became possible. In clinical neurophysiology, tests that use this approach are known as cognitive evoked potentials. These potentials are not only used to assess the direct responses elicited by a stimulus, as is most common in clinical practice, but can also be used to assess higher-order cognitive functions once the stimulus reaches the brain.5
P300 evoked potentials are used to analyze cognitive processes related to attention, information processing, and working memory. They allow assessment of cognitive and attention functions, such as the capacity to analyze, assess and discriminate stimuli. The technique makes it possible to measure the neural activity generated by the task before the final response takes place.
The P300 is a positive deflection in voltage that peaks at approximately 300 ms caused by a stimulus that is usually visual or auditory.6 The wave is generated directly as a result of postsynaptic potentials, and, while the underlying neural substrates have yet to be clearly elucidated, the signal exhibits a parieto-central cortical distribution that peaks at the midline of the scalp.7
The amplitude of the P300 wave is associated with the amount of information conveyed by the stimulus and the cognitive processes involved in the comparison of a rare target stimulus with the current mental representation of the stimulus. The amplitude decreases as task relevance decreases and increases as stimulus probability decreases.
The P300 is associated with information processing and, more specifically, with stimulus classification and processing speed.
Studies in children with ADHD have identified alterations in the amplitude, latency, and topographic distribution of different components of the P300.8 These differences suggest that certain phases of cognitive information processing are impaired in children with ADHD. Previous studies in children with ADHD have found a decrease in the amplitude and an increase in the latency of the P300 component compared to children without ADHD.9
Increases in P300 latency are positively correlated to the severity of inattention. Decreases in P300 amplitude have been found to be associated with marked impulsivity, decreased concentration and difficulty inhibiting motor responses. It also appears to be associated with impaired attentional resource allocation, reduced neural activation in working memory updating following an infrequent stimulus, and an increase in the time required to process the stimulus.10
The objective of our study was to compare the latency of the P300 auditory evoked potential in children with and without ADHD with the aim of identifying potential neurophysiological differences in the cognitive processing of auditory stimuli. The ultimate purpose of the study was to determine the clinical utility of the auditory P300 wave as an objective complementary assessment tool in the diagnosis of ADHD in the pediatric population.
Sample and methodsWe conducted a prospective observational cohort study. The study was approved by the Research Committee and the Research Ethics Committee of our hospital.
The study universe consisted of the pediatric patients in our catchment area that were referred for suspected ADHD to the outpatient pediatric neurology clinic of our hospital. Patients with a confirmed diagnosis of ADHD were included in the case group. We recruited patients without a clinical diagnosis of ADHD matched for age for the control group. All controls had undergone the routine check-ups included in the healthy child preventive care program, and we verified that ADHD had never been suspected in these children by their primary care providers, schools or families.
The inclusion criteria were clinical diagnosis of ADHD confirmed by a pediatric neurologist in our hospital, being naïve to ADHD pharmacological treatment, and age 5–17 years.
The exclusion criteria were presence of brain or cranial anomalies, structural brain lesions, epilepsy, conductive or sensorineural hearing loss, cognitive disorders, developmental delay or an intellectual quotient of less than 80.
Once a patient had agreed to participate in the study and informed consent was obtained from the legal guardians, an appointment was scheduled at the neurophysiology clinic of the hospital to test the P300 wave cognitive evoked potentials. A single clinical neurophysiologist performed the tests in all participants either in the late morning hours or at least two hours after lunch, also avoiding early morning hours, to prevent the effects of early morning or post-prandial somnolence on attention.
The primary outcomes of the study were the P300 latency (ms) and the P300 amplitude (μV), taking into account age and sex. The P300 latency was measured on the waveform as the time point corresponding to the downward (positive) peak occurring at approximately 300 ms and the P300 amplitude as the difference in microvolts between that downward (positive) peak and the preceding upward (negative) peak (Fig. 1).

P300 cognitive evoked potentials were recorded with the Natus Nikolet EDX electromyography/evoked potentials testing system.
The P300 event-related potential is tested applying the oddball paradigm, in which two stimuli, one with a higher probability than the other, are presented in random order. In our study, patients had to discriminate between the rare stimulus (target stimulus) and the frequent stimulus (standard stimulus). Before the test, the patient was instructed to identify the target stimulus and report the number of times the stimulus had occurred at the end of the test. The probabilities of the standard and the target stimuli during the test were 80% and 20%, respectively.11
The auditory stimuli were delivered through headphones connected to the Natus Nikolet EDX system. We placed self-adhesive electrodes on the patient following preparation of the site with abrasive paste and application of conducive paste to reduce impedance (<5 KΩ). We used the 10–20 electrode system of the International Federation,12 placing electrodes at the Fz, Cz and Pz positions with references at A1 and A2. The EEG was bandpass-filtered between 0.01 Hz and 100 Hz. If the signal exhibited artifacts impeding its correct visualization, we applied 0.01–20 Hz band-pass filtering to the recorded data. The sampling rate was 200 Hz. We used an analysis time window from 100 ms before to 800–1000 ms after stimulus onset. A minimum of 30 valid target stimulus responses were averaged.7
We performed the test twice with a one-minute break in between and calculated the mean P300 latency and amplitude for the two tests. We also recorded the number of target stimuli the patient reported hearing at the end of both tests.
Sample sizeWe calculated the sample size using the reported prevalence of ADHD of 6.8% (Catalá-López et al., 2012).13 Setting an α level of 0.05 and a β level of 0.2 (power of 80%) for two-sided testing, we estimated that we needed 13 participants in each group to detect a difference of 28.42 ms or greater (reported standard deviation in the response of individuals with ADHD14). We assumed a general standard deviation of 23.685 and a loss to follow-up of 10%.
The sample size was then calculated with a formula appropriate for the purpose.15
The estimated minimum sample size did not differ significantly from the sample sizes reported in similar studies.16
Statistical analysisIn the descriptive analysis of the study variables, we calculated the mean, standard deviation (SD), median and quartiles in the case of continuous variables and absolute and relative frequencies in the case of categorical variables.
To assess for the presence or absence of significant differences between groups in the primary outcomes (P300 wave latency and amplitude), we conducted a univariate analysis using the Mann-Whitney U test for independent samples, as these were continuous independent variables. We have chosen this nonparametric test over the Student t test (which we also performed) because it does not require a normal distribution and is recommended for relatively small sample sizes. We set the significance level at 5% (P < .05).
The descriptive analysis of the variables and the statistical analysis were performed nearly entirely with the software packages available for this type of analyses in R language, version 4.2.0 (R Foundation for Statistical Computing, Vienna, Austria).
ResultsWe collected data from 26 patients: 13 in the ADHD group and 13 in the control group. In the ADHD group, six were female and seven were male; in the control group, seven were female and six were male. The mean age of the overall sample was 10.5 years, with a mean age of 9 years in the ADHD group (range, 7–14) and 11.9 years in the control group (range, 8–17). We did not find statistically significant differences in age between groups.
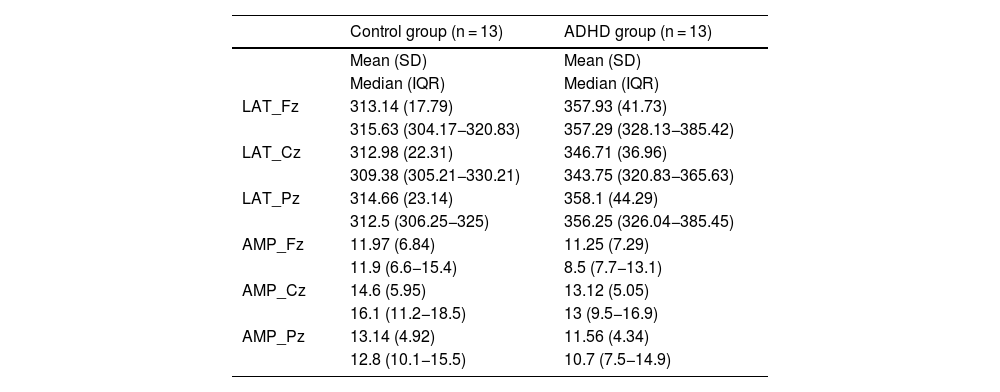
Table 1 presents the mean, standard deviation, median, and interquartile range of P300 latencies and amplitudes in cases and controls.
Latency (in ms) and amplitude (in μV) recorded at each of the active electrodes (Fz, Cz, Pz).
| Control group (n = 13) | ADHD group (n = 13) | |
|---|---|---|
| Mean (SD) | Mean (SD) | |
| Median (IQR) | Median (IQR) | |
| LAT_Fz | 313.14 (17.79) | 357.93 (41.73) |
| 315.63 (304.17−320.83) | 357.29 (328.13−385.42) | |
| LAT_Cz | 312.98 (22.31) | 346.71 (36.96) |
| 309.38 (305.21−330.21) | 343.75 (320.83−365.63) | |
| LAT_Pz | 314.66 (23.14) | 358.1 (44.29) |
| 312.5 (306.25−325) | 356.25 (326.04−385.45) | |
| AMP_Fz | 11.97 (6.84) | 11.25 (7.29) |
| 11.9 (6.6−15.4) | 8.5 (7.7−13.1) | |
| AMP_Cz | 14.6 (5.95) | 13.12 (5.05) |
| 16.1 (11.2−18.5) | 13 (9.5−16.9) | |
| AMP_Pz | 13.14 (4.92) | 11.56 (4.34) |
| 12.8 (10.1−15.5) | 10.7 (7.5−14.9) |
Abbreviations: AMP, amplitude; LAT, latency.
We recorded responses in all study subjects and calculated the mean (SD) values for the Fz, Cz, and Pz electrode set, finding a P300 latency of 354.25 (41) ms and an amplitude of 11.98 (5.6) μV in the ADHD group and a P300 latency of 313.59 (21) ms and an amplitude of 13.24 (5.9) μV in the control group.
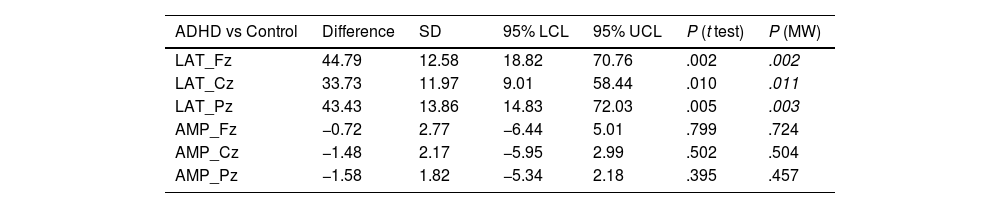
The comparative analysis of P300 latencies and amplitudes between the ADHD group and the control group using the Student t test and the Mann-Whitney U test showed statistically significant differences for the latencies obtained with all of the active electrodes (P < .05), while there were no significant differences in the amplitude values (Table 2; Figs. 2–4).
Univariate analysis of the P300 wave latency and amplitude values in each of the active electrodes (Fz, Cz, Pz) comparing the ADHD group and the control group (Student t test and Mann-Whitney U test).
| ADHD vs Control | Difference | SD | 95% LCL | 95% UCL | P (t test) | P (MW) |
|---|---|---|---|---|---|---|
| LAT_Fz | 44.79 | 12.58 | 18.82 | 70.76 | .002 | .002 |
| LAT_Cz | 33.73 | 11.97 | 9.01 | 58.44 | .010 | .011 |
| LAT_Pz | 43.43 | 13.86 | 14.83 | 72.03 | .005 | .003 |
| AMP_Fz | −0.72 | 2.77 | −6.44 | 5.01 | .799 | .724 |
| AMP_Cz | −1.48 | 2.17 | −5.95 | 2.99 | .502 | .504 |
| AMP_Pz | −1.58 | 1.82 | −5.34 | 2.18 | .395 | .457 |
Abbreviations: AMP, amplitude; LAT, latency; LCL, lower confidence limit; MW, Mann-Whitney U test; UCL, upper confidence limit.
 and a control subject (right). The P300 latency is visibly delayed in the subject with ADHD, although there was no clear difference in amplitude.")


When it came to the percentage of correct/incorrect target identification, errors were rare in the control group (only 3 of the 13 controls failed to correctly count the 30 target stimuli, in every case with no more than one or two errors), while in the ADHD group, errors were substantial, on account of both perceiving more target stimuli than actually occurred and of missing stimuli (errors in 10 of the 13 subjects, ranging from being unable to report a count to identifying almost twice as many target stimuli as were presented in the test).
DiscussionWe were able to acquire valid P300 waveforms in response to auditory stimuli in every participant, including cases with ADHD and controls. Repeated tests proved that the waveforms were reproducible, indicating that the technique could produce reliable measurements in our sample.
The most salient findings of the analysis of the obtained data were the statistically significant differences in the latency values obtained through every active electrode between participants with ADHD and controls. Our study confirms that pediatric patients with ADHD in our area have higher P300 latency values compared to their healthy peers. This was consistent with the results of similar studies conducted in other populations.17,18 Other studies, although they have reported a prolonged P300 latency with visual stimuli also reported a shorter P300 latency with auditory stimuli19 although, in contrast to our study, the differences were not statistically significant. The delay in the latency following a visual stimulus may be associated with a greater impairment of visual processing in patients with ADHD, not as a result of inattention, but rather due to a different way to focus their visual selective attention.20 In our study, we obtained similar results with auditory stimuli.
Although we were able to determine that pediatric patients with ADHD have longer P300 wave latencies, one of the limitations of our study is that we did not differentiate patients with ADHD based on which area was most affected by the disorder (attention, hyperactivity, or both).19 Similarly, we observed that younger patients tended to have longer latencies or make more errors, although the differences were not statistically significant. The average age was slightly lower in the ADHD group, with older patients in the control group. Although these differences were not significant, we took this fact into account given that younger patients tend to have longer latencies.21–23 Given what we have observed, we think that in subsequent studies with larger samples, we could identify additional differences between more specific age groups or clinical subtypes.
As for the components of the P300 wave, we did not find significant differences in amplitude between them. Other studies have found differences.17 We found greater dispersion in amplitude values in our sample compared to previous studies. This may be due to methodological differences in the studies, such as how the wave is measured. This is another limitation of our study, as we used peak-to-peak amplitude measurement instead of the recommended baseline-to-peak measurement.24 In any case, the P300 latency appears to be less variable and more reliable for use in clinical practice.
There was variation in both the latency and amplitude of the P300 wave depending on the electrode location (Fz, Cz, Pz). This is logical given that the morphology of the wave will depend on the cortical regions at which the response is recorded.24,25 In any case, given that the differences in value between the different locations were not statistically significant, we calculated the average of the values obtained from all three electrodes to facilitate the clinical assessment of the patients.
Another limitation of our study concerned the analysis of the committed errors due to the lack of a response device integrated in the system that patients could use to report when they perceive the target stimulus that would also allow recording the time of the response. This would allow assessment of the patient’s reaction time and the percentage of correct identifications and missed stimuli. Although it would have been better to identify errors by assigning patients a task (eg, raising a finger), we chose to avoid any movement that could generate artifacts. To assess the identification of target stimuli, we only asked patients to count them in their head and report the number, which could have been affected by patient age and difficulties counting. In any case, the obtained responses allowed us to confirm that patients in the ADHD group made significantly more errors than controls, in agreement with other studies.17,26,27
ConclusionsThe findings of our study corroborated that the latency of the P300 wave in response to auditory stimuli was significantly longer in our pediatric patients with ADHD compared to their peers without the disorder, in addition to more frequent errors in the identification of stimuli.
Therefore, this study has demonstrated that P300 cognitive evoked potential testing can be an appropriate and effective tool for diagnosis of ADHD in pediatric patients. The P300 response is a quantifiable measure, and alterations in it suggest that children with ADHD have slower cognitive processing in response to relevant auditory stimuli, which supports the usefulness of P300 evoked potentials as a neurophysiological marker in the evaluation and diagnosis of this disorder in childhood, allowing for early detection and implementation of specific treatment, as well as the performance of follow-up assessments.
The use of auditory P300 combined with clinical tests can help make more reliable diagnoses and to guide pharmacotherapy in patients with objective confirmation of attention deficits.
FundingThis research did not receive any external funding.
The authors have no conflicts of interest to declare.
