


The reference tools used to assess child growth in Spain are the graphs of Fundación Orbegozo and the charts of the World Health Organization (WHO). The objective of this study is to analyze the differences between the two charts for weight, height and body mass index, and assess their relevance to identify growth or nutritional problems.
Material and methodsThe values of the extreme percentiles of height, weight and body mass index for each sex from 0 to 10 years in both charts are compared. Absolute differences and z scores are calculated for each value. To evaluate the impact on the prevalence of the various nutritional or growth disorders the location of the value of the extreme percentiles in each chart was investigated.
ResultsSignificant differences were observed between the 3rd percentile of height and weight, 97th of weight, and 85th and 97th of body mass index. Marked differences were observed for the extreme values of body mass index. During the first years, the Orbegozo charts overestimate the prevalence of malnutrition (between 2% and 19% depending on age and sex) compared to the WHO charts. In subsequent ages Orbegozo underestimates WHO between 0.7% and 2.89%. Orbegozo underestimates the prevalence of overweight (between 2.5% and 14.8%) compared to the WHO charts. The 97th percentile of body mass index in the Orbegozo charts corresponds in most cases with WHO percentiles above 99.99%.
ConclusionThe two charts analyzed have significant differences from a clinical and public health point of view, in the estimation of overweight/obesity and malnutrition.
Las referencias más empleadas en España para evaluar el crecimiento son las gráficas de la Fundación Orbegozo y las gráficas de la Organización Mundial de la Salud (OMS). El objetivo es analizar las diferencias entre ambas para las magnitudes: peso, talla e índice de masa corporal, y valorar su relevancia para identificar problemas nutricionales o de crecimiento.
Material y métodosSe compara el valor de los percentiles extremos de talla, peso e índice de masa corporal para cada sexo desde los 0-10 años de ambas gráficas. Se calculan diferencias absolutas y de puntuación Z. Para evaluar el impacto sobre la prevalencia de trastornos nutritivos o de crecimiento se examina la ubicación del valor numérico de cada percentil extremo entre ambas tablas.
ResultadosSe observan diferencias significativas entre los percentiles 3 de talla y peso, 97 de peso y 85 y 97 de índice de masa corporal. Durante los primeros años, la referencia Orbegozo sobreestima con respecto a la referencia OMS la prevalencia de desnutrición entre un 2 y un 19%. En edades posteriores, la subestima entre un 0,7 y un 2,89%. La referencia Orbegozo subestima con respecto a la referencia OMS la prevalencia de sobrecarga ponderal (entre un 2,5 y un 14,8%). El valor del percentil 97 de índice de masa corporal de la referencia Orbegozo se corresponde en la mayoría de los casos con percentiles de la referencia OMS superiores al 99,99%.
ConclusiónLos patrones analizados presentan diferencias que pueden ser relevantes desde el punto de vista clínico y de salud pública.
Growth assessment is an essential part of the health evaluation of children. Its purpose is to obtain a series of reliable anthropometric measurements and compare them to a reference standard that documents the normal variability in relation to age and sex.
Growth standards have been developed with different populations and methodologies. In Spain, the Fundación Orbegozo study started in the 1970s.1–3 The Fundación Orbegozo charts are the most frequently used reference4,5 in our country. Other studies have been conducted more recently of both national6 and local scope in various Spanish regions.7–11 Pooling several regional studies gave rise to the Spanish cross-sectional and longitudinal Growth Studies,12–14 which are valuable because they are representative of the entire Spanish population and incorporate recent data. Similar studies have been performed in other countries and are periodically revised to reflect changes brought on by environmental factors and/or the secular acceleration of growth.15–19
International charts have been developed for their use irrespective of geographical location.20–24 The World Health Organization (WHO) growth charts were developed with data from healthy children 0 to 5 years of age from America, Europe, Africa and Asia who were breastfed exclusively for the first six months of life and living in environments without health, environmental or economic disadvantages. According to their authors, the WHO charts constitute the first growth standard reflecting how children in this age group should grow, anywhere in the world. More recently, the WHO developed charts for children 5–19 years of age, merging data from the National Center for Health Statistics/WHO from 1977 and data from the WHO sample of children 0–5 years of age.24
The individual monitoring of children usually involves taking serial measurements to achieve a dynamic view of their growth.25–27 In that context, the choice of growth standard is less relevant, but when it comes to the use of standards in epidemiology and public health for the purposes of determining the prevalence of abnormal anthropometric values, the position of the extreme percentiles is of utmost importance.26
In the Autonomous Community of Valencia, the anthropometric reference used in primary care (PC) paediatric services was switched in 2009/2010. Thus, up to 2010, the Child Health Book (CHB) included the Orbegozo charts, which were then replaced by the WHO charts. Likewise, the Programa informático de Control y Seguimiento del Niño (Electronic System for the Management and Followup of Children) used the Orbegozo charts until 2009 and both charts from then on, with the WHO charts being used by default for children born after 2009 (personal observation of author).
In this context, our study had two aims:
- –
To analyze the differences between the 2 growth references that are being used concurrently in the child health records of the Autonomous Community of Valencia (Orbegozo and WHO charts) for the main anthropometric measurements and assess how these differences impact the identification of nutritional or growth problems in the population.
- –
Learn which charts are being used in the primary care paediatric medical records (PCPMRs) and the CHBs of the different autonomous communities (ACs).
We compared the values of the 3rd, 50th, and 97th percentiles of height and weight, and the 3rd, 50th, 85th and 97th percentiles of body mass index (BMI) for each sex from age 0 to 10 in the WHO Charts22,23 and the Orbegozo Charts1 (longitudinal study). The age intervals used in our analysis, consistent with the data provided by the charts of the two growth standards, were of 3 months from age 0 to 12 months, and of 6 months from 12 months onward.
For each percentile of each anthropometric measurement, we calculated absolute differences and z-scores (relative to the 50th percentile of the WHO charts) between the two charts. We tested the null hypothesis that the mean observed differences would be zero by means of Student's t test or the nonparametric Mann–Whitney test, depending on whether the distribution of the differences approximated a normal distribution.28 We tested the goodness of fit by means of the Kolmogorov–Smirnov test.28 We set the significance level for all hypothesis tests at α=0.05, which corresponded to P<.05.
To assess the impact of the application of each growth standard on the prevalence of nutritional or growth disorders, we compared the numerical value of the extreme percentiles in each set of charts. Specifically, we calculated the percentile of each chart that corresponded to the numerical value of a given percentile in the other chart. The difference in percentile rank obtained when comparing both charts could be used to estimate the increase or decrease in prevalence that would be expected when the Orbegozo charts were applied to the population of the WHO charts and vice versa. We performed the various calculations using the R open-source software (available at http://www.R-project.org).
Charts used in the different autonomous communitiesWe obtained this information from the Departments of Public Health through their official web pages and/or by telephone. We completed our search using the intranet of the Asociación Española de Pediatría de Atención Primaria (Spanish Association of Primary Care Paediatrics [AEPAP]) to contact paediatricians of different ACs that were members of the association, and by direct telephone contact with healthcare centres. The information we requested was: (a) Which growth charts are being used in the PCPMRs of your AC? and (b) Which growth charts are included in the CHB of your AC?
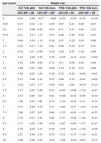
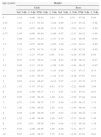
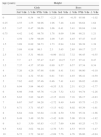
ResultsDifferences between the Fundación Orbegozo and the World Health Organization growth chartsTable 1 presents the absolute differences and z-scores in the different percentiles for the various measurements analyzed for both sexes, as well as the statistical analysis of these differences. Figs. 1–3 provide a graphical representation of the superimposition of the analyzed percentiles in both growth charts for each anthropometric measurement. Table 2 shows the location of the value of the extreme percentiles of the Orbegozo charts in the WHO charts, and the expected change in percentile rank for these values when the Orbegozo charts are applied to the WHO population. Table 3 shows the opposite comparison, that is, the location of the value of the extreme percentiles for weight, height and BMI of the WHO charts in the Orbegozo charts.
Differences in absolute values and z-scores between the FORBC and the WHOC.
| Age (years) | Height (cm) | |||||||
|---|---|---|---|---|---|---|---|---|
| 3rd %ile girls | 3rd %ile boys | 97th %ile girls | 97th %ile boys | |||||
| ABS difa | z dif | ABS difa | z difa | ABS dif | z dif | ABS difa | z dif | |
| 0 | 0.16 | 0.09 | −0.17 | −0.09 | −0.54 | −0.30 | −0.34 | −0.18 |
| 0.25 | 0.37 | 0.18 | 1.12 | 0.56 | 0.87 | 0.41 | 0.90 | 0.45 |
| 0.5 | 0.13 | 0.06 | 0.90 | 0.43 | 0.71 | 0.32 | 0.68 | 0.32 |
| 0.75 | 0.41 | 0.17 | 1.17 | 0.51 | 0.86 | 0.36 | 0.52 | 0.23 |
| 1 | 0.49 | 0.19 | 1.15 | 0.50 | 0.51 | 0.20 | 0.19 | 0.08 |
| 1.5 | 0.33 | 0.11 | 1.10 | 0.41 | 0.98 | 0.34 | 0.73 | 0.27 |
| 2 | 0.34 | 0.11 | 0.86 | 0.29 | 1.66 | 0.52 | 1.48 | 0.49 |
| 2.5 | 2.10 | 0.58 | 2.57 | 0.76 | −0.55 | −0.15 | −0.32 | −0.09 |
| 3 | 1.92 | 0.49 | 2.68 | 0.72 | 0.31 | 0.08 | 0.28 | 0.08 |
| 3.5 | 1.89 | 0.47 | 2.64 | 0.66 | 0.74 | 0.19 | 0.23 | 0.06 |
| 4 | 1.95 | 0.45 | 2.45 | 0.58 | 0.78 | 0.18 | −0.08 | −0.02 |
| 4.5 | 2.12 | 0.46 | 2.43 | 0.55 | 0.66 | 0.14 | −0.41 | −0.09 |
| 5 | 2.38 | 0.51 | 2.37 | 0.50 | 0.38 | 0.08 | −0.70 | −0.15 |
| 5.5 | 2.27 | 0.45 | 2.46 | 0.52 | −0.43 | −0.09 | −2.20 | −0.47 |
| 6 | 2.43 | 0.48 | 3.07 | 0.61 | −0.96 | −0.19 | −0.98 | −0.20 |
| 6.5 | 2.50 | 0.47 | 3.84 | 0.75 | −1.59 | −0.30 | −0.71 | −0.14 |
| 7 | 2.55 | 0.46 | 3.74 | 0.71 | −2.02 | −0.37 | −1.03 | −0.19 |
| 7.5 | 2.66 | 0.47 | 3.67 | 0.68 | −2.35 | −0.41 | −1.33 | −0.25 |
| 8 | 2.72 | 0.47 | 3.54 | 0.62 | −2.57 | −0.44 | −1.40 | −0.25 |
| 8.5 | 2.71 | 0.45 | 3.44 | 0.59 | −2.67 | −0.45 | −1.57 | −0.27 |
| 9 | 2.76 | 0.45 | 3.33 | 0.56 | −2.55 | −0.42 | −1.54 | −0.26 |
| 9.5 | 2.87 | 0.46 | 3.31 | 0.53 | −2.32 | −0.37 | −1.36 | −0.22 |
| 10 | 2.96 | 0.46 | 3.47 | 0.54 | −1.88 | −0.29 | −0.93 | −0.15 |
| Age (years) | Weight (kg) | |||||||
|---|---|---|---|---|---|---|---|---|
| 3rd %ile girls | 3rd %ile boys | 97th %ile girls | 97th %ile boys | |||||
| ABS difa | z difa | ABS difa | z difa | ABS difa | z difa | ABS difa | z difa | |
| 0 | −0.17 | −0.43 | −0.23 | −0.58 | −0.14 | −0.35 | −0.11 | −0.28 |
| 0.25 | −0.14 | −0.23 | 0.06 | 0.09 | 0.32 | 0.53 | 0.12 | 0.17 |
| 0.5 | −0.23 | −0.29 | −0.10 | −0.13 | 0.02 | 0.02 | −0.20 | −0.25 |
| 0.75 | −0.28 | −0.31 | −0.27 | −0.30 | −0.43 | −0.48 | −0.53 | −0.59 |
| 1 | −0.63 | −0.63 | −0.43 | −0.43 | −0.62 | −0.62 | −0.71 | −0.71 |
| 1.5 | −0.61 | −0.55 | −0.52 | −0.47 | −0.58 | −0.53 | −0.42 | −0.38 |
| 2 | −0.59 | −0.45 | −0.57 | −0.41 | −0.49 | −0.38 | −0.45 | −0.32 |
| 2.5 | 1.10 | 0.73 | −0.77 | −0.51 | −1.69 | −1.13 | −0.10 | −0.07 |
| 3 | 2.05 | 1.21 | −0.67 | −0.42 | −1.72 | −1.01 | −0.25 | −0.16 |
| 3.5 | 2.83 | 1.49 | −0.50 | −0.29 | −1.31 | −0.69 | −0.55 | −0.32 |
| 4 | 3.62 | 1.72 | −0.10 | −0.05 | −1.21 | −0.58 | 0.11 | 0.06 |
| 4.5 | 4.23 | 1.84 | 0.44 | 0.21 | −1.20 | −0.52 | 0.23 | 0.82 |
| 5 | 4.75 | 1.98 | 0.75 | 0.33 | −1.45 | −0.60 | 0.36 | 0.16 |
| 5.5 | 5.12 | 2.05 | 1.44 | 0.60 | −2.17 | −0.87 | −0.26 | −0.11 |
| 6 | 5.23 | 1.94 | 1.96 | 0.78 | −2.72 | −1.01 | −1.08 | −0.43 |
| 6.5 | 5.30 | 1.83 | 2.58 | 0.96 | −3.39 | −1.17 | −1.77 | −0.66 |
| 7 | 5.14 | 1.66 | 3.15 | 1.09 | −3.87 | −1.25 | −1.40 | −0.48 |
| 7.5 | 5.06 | 1.53 | 3.66 | 1.22 | −4.34 | −1.32 | −1.63 | −0.54 |
| 8 | 4.98 | 1.38 | 4.16 | 1.26 | −4.77 | −1.33 | −1.64 | −0.50 |
| 8.5 | 4.90 | 1.26 | 4.45 | 1.27 | −4.86 | −1.25 | −1.63 | −0.47 |
| 9 | 4.74 | 1.13 | 4.61 | 1.21 | −4.88 | −1.16 | −1.60 | −0.42 |
| 9.5 | 4.61 | 1.00 | 4.71 | 1.15 | −4.81 | −1.05 | −1.66 | −0.40 |
| 10 | 4.63 | 0.94 | 4.66 | 1.04 | −4.45 | −0.91 | −1.60 | −0.36 |
| Age(years) | BMI (kg/m2) | |||||||||||
|---|---|---|---|---|---|---|---|---|---|---|---|---|
| 3rd %ile girls | 3rd %ile boys | 85th %ile girls | 85th %ile boys | 97th %ile girls | 97th %ile boys | |||||||
| ABS difa | z difa | ABS dif | z dif | ABS difa | z difa | ABS difa | z difa | ABS difa | z difa | ABS difa | z difa | |
| 0 | −0.62 | −0.56 | −0.64 | −0.53 | −0.25 | −0.23 | −0.20 | −0.17 | −0.07 | −0.06 | −0.03 | −0.02 |
| 0.25 | −0.59 | −0.39 | −0.32 | −0.23 | 0.08 | 0.05 | 0.00 | 0.00 | 0.09 | 0.06 | −0.10 | −0.07 |
| 0.5 | −0.72 | −0.51 | −0.58 | −0.45 | −0.32 | −0.23 | −0.70 | −0.54 | −0.20 | −0.14 | −0.62 | −0.48 |
| 0.75 | −1.13 | −0.81 | −0.99 | −0.71 | −1.02 | −0.73 | −1.19 | −0.85 | −0.81 | −0.58 | −1.24 | −0.89 |
| 1 | −1.43 | −1.02 | −1.02 | −0.78 | −1.43 | −1.02 | −1.19 | −0.92 | −1.31 | −0.94 | −1.32 | −1.02 |
| 1.5 | −1.32 | −1.02 | −1.18 | −0.98 | −1.35 | −1.04 | −1.23 | −1.03 | −1.30 | −1.00 | −1.12 | −0.93 |
| 2 | −1.09 | −0.91 | −1.15 | −1.05 | −1.11 | −0.93 | −1.09 | −0.99 | −1.11 | −0.92 | −1.03 | −0.94 |
| 2.5 | −0.71 | −0.59 | −0.86 | −0.72 | −0.82 | −0.68 | −0.63 | −0.17 | −0.82 | −0.68 | −0.55 | −0.46 |
| 3 | −0.28 | −0.23 | −0.80 | −0.67 | −0.89 | −0.74 | −0.64 | 0.00 | −0.97 | −0.81 | −0.56 | −0.47 |
| 3.5 | −0.03 | −0.02 | −0.60 | −0.55 | −1.01 | −0.78 | −0.67 | −0.54 | −1.11 | −0.85 | −0.57 | −0.52 |
| 4 | 0.45 | 0.35 | −0.34 | −0.28 | −1.20 | −0.92 | −0.56 | −0.85 | −1.34 | −1.03 | −0.49 | −0.41 |
| 4.5 | 0.79 | 0.56 | −0.30 | −0.23 | −1.26 | −0.90 | −0.53 | −0.92 | −1.52 | −1.09 | −0.45 | −0.35 |
| 5 | 1.00 | 0.71 | 0.20 | 0.17 | −1.25 | −0.89 | −0.74 | −1.03 | −1.53 | −1.09 | −0.66 | −0.55 |
| 5.5 | 1.27 | 0.98 | 0.49 | 0.41 | −1.40 | −1.08 | −0.89 | −0.99 | −1.69 | −1.30 | −0.94 | −0.78 |
| 6 | 1.49 | 1.06 | 0.74 | 0.62 | −1.54 | −1.10 | −0.96 | −0.80 | −1.86 | −1.33 | −0.99 | −0.82 |
| 6.5 | 1.66 | 1.19 | 0.85 | 0.65 | −1.76 | −1.26 | −1.11 | −0.85 | −2.03 | −1.45 | −1.15 | −0.88 |
| 7 | 1.87 | 1.25 | 1.01 | 0.78 | −1.94 | −1.29 | −1.26 | −0.97 | −2.35 | −1.57 | −1.31 | −1.01 |
| 7.5 | 1.93 | 1.29 | 1.05 | 0.81 | −2.16 | −1.44 | −1.45 | −1.12 | −2.51 | −1.67 | −1.62 | −1.25 |
| 8 | 2.04 | 1.28 | 1.16 | 0.89 | −2.39 | −1.49 | −1.68 | −1.29 | −2.67 | −1.67 | −1.78 | −1.37 |
| 8.5 | 2.10 | 1.31 | 1.25 | 0.89 | −2.53 | −1.58 | −1.92 | −1.37 | −2.81 | −1.76 | −2.05 | −1.46 |
| 9 | 2.20 | 1.29 | 1.32 | 0.94 | −2.64 | −1.55 | −2.07 | −1.48 | −2.82 | −1.66 | −2.22 | −1.59 |
| 9.5 | 2.16 | 1.27 | 1.39 | 0.99 | −2.62 | −1.54 | −2.20 | −1.57 | −2.77 | −1.63 | −2.37 | −1.69 |
| 10 | 2.18 | 1.21 | 1.55 | 1.03 | −2.67 | −1.48 | −2.32 | −1.55 | −2.66 | −1.48 | −2.39 | −1.59 |
ABS dif, absolute value difference (WHOC value – FORBC value); BMI, body mass index; FORBC, Fundación Orbegozo charts; WHOC, World Health Organization charts; z dif, z-score difference (WHOC z-score – FORBC z-score); %ile: percentile.
 were found in the means comparison test for the 3rd percentile in both sexes. FORBC, Fundación Orbegozo charts; WHOC, World Health Organization charts.")
 were found in the means comparison test for the 3rd and the 97th percentiles in both sexes. FORBC, Fundación Orbegozo charts; WHOC, World Health Organization charts.")
 were found in the means comparison test for the 3rd percentile (girls only) and the 85th and 97th percentiles (in both sexes). BMI, body mass index; FORBC, Fundación Orbegozo charts; WHOC, World Health Organization charts.")
Superimposition of percentiles for each sex: BMI. Statistically significant differences (P<.05) were found in the means comparison test for the 3rd percentile (girls only) and the 85th and 97th percentiles (in both sexes). BMI, body mass index; FORBC, Fundación Orbegozo charts; WHOC, World Health Organization charts.
Location of the 3rd and 97th percentiles for height, weight and BMI and of the 85th percentile for BMI of the FORBC in the WHOC.
| Age (years) | Height | |||||||
|---|---|---|---|---|---|---|---|---|
| Girls | Boys | |||||||
| 3rd %ile | Δ %ile | 97th %ile | Δ %ile | 3rd %ile | Δ %ile | 97th %ile | Δ %ile | |
| 0 | 2.10 | −0.90 | 98.93 | 1.93 | 3.55 | 0.55 | 97.84 | 0.84 |
| 0.25 | 1.87 | −1.13 | 93.20 | −3.80 | 0.69 | −2.31 | 93.32 | −3.68 |
| 0.5 | 2.45 | −0.55 | 94.86 | −2.14 | 0.98 | −2.02 | 94.31 | −2.69 |
| 0.75 | 2.04 | −0.96 | 94.04 | −2.96 | 0.87 | −2.13 | 94.52 | −2.48 |
| 1 | 2.09 | −0.91 | 95.43 | −1.57 | 0.79 | −2.21 | 96.95 | −0.05 |
| 1.5 | 2.22 | −0.78 | 94.05 | −2.95 | 1.08 | −1.92 | 94.31 | −2.69 |
| 2 | 2.21 | −0.79 | 91.74 | −5.26 | 1.44 | −1.56 | 92.51 | −4.49 |
| 2.5 | 0.73 | −2.27 | 97.65 | 0.65 | 0.42 | −2.58 | 97.59 | 0.59 |
| 3 | 0.97 | −2.03 | 95.92 | −1.08 | 0.44 | −2.56 | 96.53 | −0.47 |
| 3.5 | 0.88 | −2.12 | 95.91 | −1.09 | 0.56 | −2.44 | 96.35 | −0.65 |
| 4 | 0.97 | −2.03 | 95.57 | −1.43 | 0.69 | −2.31 | 97.13 | 0.13 |
| 4.5 | 0.99 | −2.01 | 95.58 | −1.42 | 0.74 | −2.26 | 97.61 | 0.61 |
| 5 | 0.82 | −2.18 | 96.67 | −0.33 | 0.87 | −2.13 | 97.72 | 0.72 |
| 5.5 | 1.03 | −1.97 | 97.42 | 0.42 | 0.78 | −2.22 | 99.09 | 2.09 |
| 6 | 0.92 | −2.08 | 98.17 | 1.17 | 0.67 | −2.33 | 97.91 | 0.91 |
| 6.5 | 0.92 | −2.08 | 98.49 | 1.49 | 0.42 | −2.58 | 97.84 | 0.84 |
| 7 | 0.97 | −2.03 | 98.75 | 1.75 | 0.50 | −2.50 | 98.13 | 1.13 |
| 7.5 | 1.00 | −2.00 | 98.85 | 1.85 | 0.51 | −2.49 | 98.44 | 1.44 |
| 8 | 0.94 | −2.06 | 98.99 | 1.99 | 0.62 | −2.38 | 98.24 | 1.24 |
| 8.5 | 1.02 | −1.98 | 98.96 | 1.96 | 0.67 | −2.33 | 98.49 | 1.49 |
| 9 | 0.97 | 2.03 | 98.94 | 1.94 | 0.68 | −2.32 | 98.38 | 1.38 |
| 9.5 | 0.94 | −2.06 | 98.86 | 1.86 | 0.69 | −2.31 | 98.17 | 1.17 |
| 10 | 0.97 | −2.03 | 98.55 | 1.55 | 0.70 | −2.30 | 97.83 | 0.83 |
| Age (years) | Weight | |||||||
|---|---|---|---|---|---|---|---|---|
| Girls | Boys | |||||||
| 3rd %ile | Δ %ile | 97th %ile | Δ %ile | 3rd %ile | Δ %ile | 97th %ile | Δ %ile | |
| 0 | 5.76 | 2.76 | 99.78 | 2.78 | 7.71 | 4.71 | 99.72 | 2.72 |
| 0.25 | 3.86 | 0.86 | 98.36 | 1.36 | 2.60 | −0.40 | 97.57 | 0.57 |
| 0.5 | 5.62 | 2.62 | 99.06 | 2.06 | 4.01 | 1.01 | 99.38 | 2.38 |
| 0.75 | 7.12 | 4.12 | 99.83 | 2.83 | 5.60 | 2.60 | 99.75 | 2.75 |
| 1 | 12.1 | 9.1 | 99.87 | 2.87 | 8.53 | 5.53 | 99.82 | 2.82 |
| 1.5 | 10.32 | 7.32 | 99.89 | 2.89 | 8.92 | 5.92 | 99.70 | 2.70 |
| 2 | 9.42 | 6.42 | 99.71 | 2.71 | 9.56 | 6.56 | 99.16 | 2.16 |
| 2.5 | 0.68 | −2.32 | 99.97 | 2.97 | 11.12 | 8.12 | 98.83 | 1.83 |
| 3 | 0.18 | −2.82 | 99.95 | 2.95 | 8.17 | 5.17 | 99.32 | 2.32 |
| 3.5 | 0.08 | −2.92 | 99.89 | 2.89 | 6.31 | 3.31 | 99.69 | 2.69 |
| 4 | 0.03 | −2.97 | 99.84 | 2.84 | 4.12 | 1.12 | 99.09 | 2.09 |
| 4.5 | 0.02 | −2.98 | 99.84 | 2.84 | 2.43 | −0.57 | 98.84 | 1.84 |
| 5 | 0.01 | −2.99 | 99.93 | 2.93 | 1.95 | −1.05 | 98.73 | 1.73 |
| 5.5 | 0.01 | −2.99 | 99.98 | 2.98 | 1.05 | −1.95 | 99.35 | 2.35 |
| 6 | 0.01 | −2.99 | 99.99 | 2.99 | 0.55 | −2.45 | 99.82 | 2.82 |
| 6.5 | 0.02 | −2.98 | 99.99 | 2.99 | 0.35 | −2.65 | 99.90 | 2.90 |
| 7 | 0.03 | −2.97 | >99.99 | >2.99 | 0.25 | −2.75 | 99.85 | 2.85 |
| 7.5 | 0.06 | −2.94 | >99.99 | >2.99 | 0.14 | −2.86 | 99.93 | 2.93 |
| 8 | 0.10 | −2.9 | >99.99 | >2.99 | 0.16 | −2.84 | 99.90 | 2.90 |
| 8.5 | 0.16 | −2.84 | >99.99 | >2.99 | 0.14 | −2.86 | 99.93 | 2.93 |
| 9 | 0.24 | −2.76 | >99.99 | >2.99 | 0.17 | −2.83 | 99.93 | 2.93 |
| 9.5 | 0.37 | −2.63 | 99.99 | 2.99 | 0.21 | −2.79 | 99.93 | 2.93 |
| 10 | 0.44 | −2.56 | 99.99 | 2.99 | 0.32 | −2.68 | 99.93 | 2.93 |
| Age (years) | BMI | |||||||||||
|---|---|---|---|---|---|---|---|---|---|---|---|---|
| Girls | Boys | |||||||||||
| 3rd %ile | Δ %ile | 85th %ile | Δ %ile | 97th %ile | Δ %ile | 3rd %ile | Δ %ile | 85th %ile | Δ %ile | 97th %ile | Δ %ile | |
| 0 | 8.92 | 5.92 | 93.32 | 8.32 | 99.24 | 2.24 | 11.19 | 8.19 | 90.88 | 5.88 | 98.85 | 1.85 |
| 0.25 | 7.98 | 4.98 | 84.45 | −0.55 | 97.38 | 0.38 | 5.97 | 2.97 | 87.35 | 2.35 | 98.39 | 1.39 |
| 0.5 | 8.97 | 5.97 | 92.55 | 7.55 | 99.24 | 2.24 | 8.08 | 5.08 | 96.16 | 11.16 | 99.73 | 2.73 |
| 0.75 | 16.39 | 13.39 | 97.40 | 12.40 | 99.79 | 2.79 | 1.69 | −1.31 | 97.27 | 12.27 | 99.84 | 2.84 |
| 1 | 22.23 | 19.23 | 98.18 | 13.18 | 99.90 | 2.90 | 16.24 | 13.24 | 98.07 | 13.07 | 99.92 | 2.92 |
| 1.5 | 22.55 | 19.55 | 98.58 | 13.58 | 99.94 | 2.94 | 22.16 | 19.16 | 98.58 | 13.58 | 99.93 | 2.93 |
| 2 | 17.75 | 14.75 | 98.52 | 13.52 | 99.94 | 2.94 | 21.98 | 18.98 | 98.82 | 13.82 | 99.95 | 2.95 |
| 2.5 | 10.72 | 7.72 | 97.34 | 12.34 | 99.87 | 2.87 | 15.07 | 12.07 | 95.46 | 10.46 | 99.57 | 2.57 |
| 3 | 5.48 | 2.48 | 97.68 | 12.68 | 99.92 | 2.92 | 13.93 | 10.93 | 95.54 | 10.54 | 99.58 | 2.58 |
| 3.5 | 4.75 | 1.75 | 97.32 | 12.32 | 99.90 | 2.90 | 8.63 | 5.63 | 97.01 | 12.01 | 99.80 | 2.80 |
| 4 | 1.42 | −1.58 | 98.11 | 13.11 | 99.96 | 2.96 | 7.12 | 4.12 | 94.88 | 9.88 | 99.61 | 2.61 |
| 4.5 | 1.13 | −1.87 | 97.95 | 12.95 | 99.95 | 2.95 | 7.19 | 4.19 | 93.12 | 8.12 | 99.23 | 2.23 |
| 5 | 0.62 | −2.38 | 98.24 | 13.24 | 99.97 | 2.97 | 2.28 | −0.72 | 96.90 | 11.9 | 99.85 | 2.85 |
| 5.5 | 0.24 | −2.76 | 99.31 | 14.31 | >99.99 | >2.99 | 1.25 | −1.75 | 97.18 | 12.18 | 99.91 | 2.91 |
| 6 | 0.22 | −2.78 | 99.15 | 14.15 | >99.99 | >2.99 | 0.90 | −2.1 | 97.98 | 12.98 | 99.96 | 2.96 |
| 6.5 | 0.15 | −2.85 | 99.55 | 14.55 | >99.99 | >2.99 | 0.95 | −2.05 | 97.77 | 12.77 | 99.95 | 2.95 |
| 7 | 0.18 | −2.82 | 99.57 | 14.57 | >99.99 | >2.99 | 0.68 | −2.32 | 98.61 | 13.61 | 99.98 | 2.98 |
| 7.5 | 0.13 | −2.87 | 99.77 | 14.77 | >99.99 | >2.99 | 0.50 | −2.5 | 99.23 | 14.23 | 99.99 | 2.99 |
| 8 | 0.15 | −2.85 | 99.75 | 14.75 | >99.99 | >2.99 | 0.39 | −2.61 | 99.63 | 14.63 | >99.99 | >2.99 |
| 8.5 | 0.11 | −2.89 | 99.84 | 14.84 | >99.99 | >2.99 | 0.46 | −2.54 | 99.61 | 14.61 | >99.99 | >2.99 |
| 9 | 0.16 | −2.84 | 99.82 | 14.82 | >99.99 | >2.99 | 0.39 | −2.61 | 99.82 | 14.82 | >99.99 | >2.99 |
| 9.5 | 0.15 | −2.85 | 99.87 | 14.87 | >99.99 | >2.99 | 0.27 | −2.73 | 99.89 | 14.89 | >99.99 | >2.99 |
| 10 | 0.20 | −2.80 | 99.80 | 8.32 | >99.99 | >2.99 | 0.35 | −2.65 | 99.87 | 14.87 | >99.99 | >2.99 |
BMI, body mass index; FORBC, Fundación Orbegozo charts; WHOC, World Health Organization charts; Δ %ile: increase or decrease in percentile rank.
For each age, we show the percentile where the numerical value of the analyzed percentile of the FORBC is located in the WHOC.
Location of the 3rd and 97th percentiles for height, weight and BMI and of the 85th percentile for BMI of the WHOC in the FORBC.
| Age (years) | Height | |||||||
|---|---|---|---|---|---|---|---|---|
| Girls | Boys | |||||||
| 3rd %ile | Δ %ile | 97th %ile | Δ %ile | 3rd %ile | Δ %ile | 97th %ile | Δ %ile | |
| 0 | 3.54 | 0.54 | 94.77 | −2.23 | 2.45 | −0.55 | 95.98 | −1.02 |
| 0.25 | 4.55 | 1.55 | 98.96 | 1.96 | 7.48 | 4.48 | 98.64 | 1.64 |
| 0.5 | 3.47 | 0.47 | 98.66 | 1.66 | 6.41 | 3.41 | 98.84 | 1.84 |
| 0.75 | 4.42 | 1.42 | 98.78 | 1.78 | 8.09 | 5.09 | 98.21 | 1.21 |
| 1 | 4.59 | 1.59 | 98.09 | 1.09 | 7.45 | 4.45 | 97.47 | 0.47 |
| 1.5 | 3.89 | 0.89 | 98.73 | 1.73 | 6.94 | 3.94 | 98.38 | 1.38 |
| 2 | 3.88 | 0.88 | 99.3 | 2.3 | 5.65 | 2.65 | 99.17 | 2.17 |
| 2.5 | 8.31 | 5.31 | 96.01 | −0.99 | 10.32 | 7.32 | 96.45 | −0.55 |
| 3 | 7.7 | 4.7 | 97.47 | 0.47 | 10.27 | 7.27 | 97.41 | 0.47 |
| 3.5 | 7.37 | 4.37 | 97.99 | 0.99 | 9.57 | 6.57 | 97.34 | 0.34 |
| 4 | 7.26 | 4.26 | 97.98 | 0.98 | 8.41 | 5.41 | 96.90 | −0.10 |
| 4.5 | 7.32 | 4.32 | 97.81 | 0.81 | 7.93 | 4.93 | 96.41 | −0.59 |
| 5 | 7.62 | 4.62 | 97.46 | 0.46 | 7.41 | 4.41 | 96.02 | −0.98 |
| 5.5 | 6.94 | 3.94 | 96.45 | −0.55 | 5.51 | 2.51 | 93.23 | −3.77 |
| 6 | 6.98 | 3.98 | 95.76 | −1.24 | 7.52 | 4.52 | 94.74 | −2.26 |
| 6.5 | 6.82 | 3.82 | 94.85 | −2.15 | 10.16 | 7.16 | 96.17 | −0.83 |
| 7 | 6.67 | 3.67 | 94.28 | −2.72 | 9.49 | 6.49 | 95.75 | −1.25 |
| 7.5 | 6.71 | 3.71 | 93.87 | −3.13 | 9.02 | 6.02 | 95.39 | −1.61 |
| 8 | 6.64 | 3.64 | 93.64 | −3.36 | 8.50 | 5.50 | 95.34 | −1.66 |
| 8.5 | 6.49 | 3.49 | 93.58 | −3.42 | 8.08 | 5.08 | 95.18 | −1.82 |
| 9 | 6.5 | 3.50 | 93.83 | −3.17 | 7.69 | 4.69 | 95.25 | −1.75 |
| 9.5 | 6.62 | 3.62 | 94.24 | −2.76 | 7.53 | 4.53 | 95.53 | −1.47 |
| 10 | 6.72 | 3.72 | 94.92 | −2.08 | 7.76 | 4.76 | 96.06 | −0.94 |
| Age (years) | Weight | |||||||
|---|---|---|---|---|---|---|---|---|
| Girls | Boys | |||||||
| 3rd %ile | Δ %ile | 97th %ile | Δ %ile | 3rd %ile | Δ %ile | 97th %ile | Δ %ile | |
| 0 | 1.09 | −1.91 | 98.2 | 1.2 | 1.56 | −1.44 | 96.74 | −0.26 |
| 0.25 | 1.68 | −1.32 | 99.8 | 2.8 | 4.17 | 1.17 | 99.28 | 2.28 |
| 0.5 | 2.14 | −0.86 | 98.51 | 1.51 | 2.41 | −0.59 | 97.98 | 0.98 |
| 0.75 | 2.66 | −0.34 | 95.41 | −1.59 | 2.28 | −0.72 | 94.82 | −2.18 |
| 1 | 1.22 | −1.78 | 93.72 | −3.28 | 1.88 | −1.12 | 92.79 | −4.21 |
| 1.5 | 1.48 | −1.52 | 94.9 | −2.1 | 1.2 | −1.8 | 96.52 | −0.48 |
| 2 | 1.22 | −1.78 | 96.93 | −0.07 | 1.46 | −1.54 | 96.44 | −0.56 |
| 2.5 | 8.3 | 5.3 | 89.53 | −7.47 | 1.63 | −1.37 | 96.98 | −0.02 |
| 3 | 12.81 | 9.81 | 91.23 | −5.77 | 1.85 | −1.15 | 97.23 | 0.23 |
| 3.5 | 16.33 | 13.33 | 92.83 | −4.17 | 2.76 | −0.24 | 96.36 | −0.64 |
| 4 | 19.34 | 16.34 | 93.86 | −3.14 | 1.91 | −1.09 | 98.09 | 1.09 |
| 4.5 | 20.55 | 17.55 | 94.34 | −2.66 | 1.87 | −1.13 | 95.96 | −1.04 |
| 5 | 21.04 | 18.04 | 93.98 | −3.02 | 1.72 | −1.27 | 96 | −1 |
| 5.5 | 20.56 | 17.56 | 92.43 | −4.57 | 2.54 | −0.46 | 97.26 | 0.26 |
| 6 | 18.84 | 15.84 | 91.37 | −5.63 | 4.83 | 1.83 | 95.17 | −1.83 |
| 6.5 | 17.23 | 14.23 | 89.99 | −7.01 | 8.91 | 5.91 | 91.47 | −5.53 |
| 7 | 15.04 | 12.04 | 89.3 | −7.7 | 11.84 | 8.84 | 93.45 | −3.55 |
| 7.5 | 13.62 | 10.62 | 88.67 | −8.33 | 12.75 | 9.75 | 93.94 | −3.06 |
| 8 | 12.41 | 9.41 | 88.18 | −8.82 | 13.62 | 10.62 | 94.20 | −2.80 |
| 8.5 | 11.46 | 8.46 | 88.64 | −8.36 | 13.47 | 10.47 | 94.47 | −2.53 |
| 9 | 10.46 | 7.46 | 89.2 | −7.8 | 12.83 | 9.83 | 94.75 | −2.25 |
| 9.5 | 9.7 | 6.7 | 89.86 | −7.14 | 12.14 | 9.14 | 94.85 | −2.15 |
| 10 | 9.33 | 6.33 | 91.03 | −5.97 | 11.1 | 8.10 | 95.1 | −1.90 |
| Age (years) | BMI | |||||||||||
|---|---|---|---|---|---|---|---|---|---|---|---|---|
| Girls | Boys | |||||||||||
| 3rd %ile | Δ %ile | 85th %ile | Δ %ile | 97th %ile | Δ %ile | 3rd %ile | Δ %ile | 85th %ile | Δ %ile | 97th %ile | Δ %ile | |
| 0 | 1.5 | −1.5 | 79.4 | −5.6 | 96.76 | −0.24 | 0.92 | −2.08 | 80.32 | −4.68 | 97.96 | 0.96 |
| 0.25 | 1.05 | −1.95 | 86.5 | 1.5 | 98.66 | 1.66 | 2.04 | −0.96 | 85.03 | 0.03 | 97.8 | 0.8 |
| 0.5 | 1.25 | −1.75 | 79.06 | −5.94 | 96.94 | −0.06 | 2.31 | −0.69 | 72.14 | −12.86 | 93.19 | −3.81 |
| 0.75 | 0.99 | −2.01 | 64.83 | −20.17 | 91.12 | −5.88 | 0.81 | −2.19 | 59.08 | −25.92 | 88.01 | −8.99 |
| 1 | 0.39 | −2.61 | 52.44 | −32.56 | 86.03 | −10.97 | 0.8 | −2.2 | 58.46 | −26.54 | 86.66 | −10.34 |
| 1.5 | 0.35 | −2.65 | 52.31 | −32.69 | 85.82 | −11.18 | 0.25 | −2.75 | 51.3 | −33.7 | 86.2 | −10.8 |
| 2 | 0.58 | −2.42 | 58.5 | −26.5 | 88.06 | −8.94 | 0.34 | −2.66 | 54.97 | −30.03 | 86.97 | −10.03 |
| 2.5 | 1.34 | −1.66 | 67.22 | −17.78 | 91.64 | −5.34 | 0.68 | −2.32 | 69.15 | −15.85 | 93.54 | −3.46 |
| 3 | 1.74 | −1.26 | 66.45 | −18.55 | 90.58 | −6.42 | 0.56 | −2.46 | 68.54 | −16.46 | 93.54 | −3.46 |
| 3.5 | 2.07 | −0.93 | 64.77 | −20.23 | 90.22 | −6.78 | 0.69 | −2.31 | 66.63 | −18.37 | 92.24 | −4.76 |
| 4 | 5.68 | 2.68 | 63.99 | −21.01 | 86.53 | −10.47 | 0.36 | −2.64 | 69.95 | −15.05 | 95.69 | −1.31 |
| 4.5 | 7.12 | 4.12 | 66.93 | −18.07 | 87.54 | −9.46 | 0.48 | −2.52 | 71.57 | −13.43 | 95.64 | −1.36 |
| 5 | 7.64 | 4.64 | 68.1 | −16.9 | 88.39 | −8.61 | 3.91 | −0.09 | 69.47 | −15.53 | 91.44 | −5.56 |
| 5.5 | 8.94 | 5.94 | 67.1 | −17.9 | 87.82 | −9.18 | 5.58 | 2.58 | 69.66 | −15.34 | 90.88 | −6.12 |
| 6 | 9.84 | 6.84 | 66.36 | −18.64 | 87.27 | −9.73 | 7.12 | 4.12 | 69.53 | −15.47 | 90.91 | −6.09 |
| 6.5 | 10.36 | 7.36 | 64.82 | −20.18 | 87.01 | −9.99 | 7.45 | 4.45 | 67.86 | −17.14 | 90.12 | −6.88 |
| 7 | 11.04 | 8.04 | 63.85 | −21.15 | 85.45 | −11.55 | 8.16 | 5.16 | 66.74 | −18.26 | 89.44 | −7.56 |
| 7.5 | 10.7 | 7.7 | 62.51 | −22.49 | 85.31 | −11.69 | 7.96 | 4.96 | 65.01 | −19.99 | 87.45 | −9.55 |
| 8 | 10.87 | 7.87 | 61.06 | −23.94 | 85.03 | −11.97 | 8.21 | 5.21 | 63 | −22 | 87.08 | −9.92 |
| 8.5 | 10.65 | 7.65 | 60.63 | −24.37 | 84.79 | −12.21 | 8.33 | 5.33 | 60.9 | −24.1 | 85.71 | −11.29 |
| 9 | 10.85 | 7.85 | 60.3 | −24.7 | 85.38 | −11.62 | 8.29 | 5.29 | 60.34 | −24.66 | 85.28 | −11.72 |
| 9.5 | 10.37 | 7.37 | 61.28 | −23.72 | 86.19 | −10.91 | 8.31 | 5.31 | 59.97 | −25.03 | 84.98 | −12.02 |
| 10 | 10.3 | 7.3 | 61.2 | −23.8 | 87.07 | −9.93 | 8.85 | 5.85 | 59.8 | −25.2 | 85.65 | −11.35 |
BMI, body mass index; FORBC, Fundación Orbegozo charts; WHOC, World Health Organization charts; Δ %ile: increase or decrease in percentile rank.
For each age, we show the percentile where the numerical value of the analyzed percentile of the WHOC is located in the FORBC.
The following were the most relevant results:
– Height: The 3rd percentile for height in the Orbegozo charts compared to that of the WHO charts is lower in all ages, except in boys 0 years of age, and the differences are statistically significant (Table 1, Fig. 1). If short stature is defined as a height below the 3rd percentile,29 the Orbegozo charts underestimate the prevalence of short stature in 0.55–2.58% of children, depending on age and sex, relative to the WHO charts (Table 2). If the Orbegozo charts are taken as the reference, the WHO charts overestimate this prevalence in 0.05–7.32% of children (Table 3).
There were no statistically significant differences in the 97th percentile between the two standards, except for the absolute differences in boys (Tables 1–3, Fig. 2).
– Weight: On average, in both boys and girls, the 3rd percentile for weight in the Orbegozo charts (Table 1) showed statistically significant differences in relation to the WHO charts. In the early years (up to 2 years of age in girls and 4 years in boys) the WHO chart values are lower, while the opposite is true for older ages (Fig. 2). Defining underweight in early childhood as a value below the 3rd percentile,30 the Orbegozo charts (Table 2) overestimate the prevalence of underweight in 0.86–9.10% of these children relative to the WHO charts, while the WHO charts underestimate this prevalence in relation to the Orbegozo charts in 0.24–1.91% (Table 3). The opposite occurs in later ages, with the Orbegozo charts underestimating the prevalence based on the WHO charts in 1.05–2.99% of the children (Table 2) and the WHO charts overestimating it based on the Orbegozo charts in 1.83–18.04% (Table 3).
The values of the 97th percentile of the Orbegozo charts, both in boys and girls, and especially from age 6 onward, are higher compared to the values of the 97th percentile in the WHO charts, and the differences are statistically significant (Tables 1–3, Fig. 2).
– BMI: Statistically significant differences in the 3rd percentile values between the Orbegozo and the WHO charts occurred only in girls (Table 1). We found a biphasic pattern in this percentile for both sexes (Fig. 3). Thus, in younger ages (up to 3.5 years in girls and 4.5 years in boys) the 3rd percentile of the Orbegozo charts corresponded to a higher percentile in the WHO charts, while in later ages it corresponded to a percentile below the 3rd in the WHO charts (Table 1, Fig. 3). Defining malnutrition as a BMI below the 3rd percentile,30 the Orbegozo charts overestimate its prevalence based on the WHO charts in 2.97–19.55% of these children (Table 2, Fig. 4a and b). Based on the Orbegozo charts, the WHO charts would underestimate this condition in 0.69–2.75% (Table 3).

The opposite is true at later ages, with the Orbegozo charts underestimating the prevalence of malnutrition based on the WHO charts in 1.58–2.89% of the children (Table 2, Fig. 4a and b). Based on the Orbegozo charts, the WHO charts would overestimate the same prevalence in 2.68–5.85% (Table 3).
For every age group, the Orbegozo values of the 85th and the 97th percentiles are higher than the corresponding values in the WHO charts, and the differences are statistically significant (Table 1). The 85th percentile of the Orbegozo charts corresponds to the 97th or a higher percentile in the WHO charts for most ages (Table 2, Fig. 3). If excess weight is defined as a BMI above the 85th percentile,1 based on the WHO charts the Orbegozo charts underestimate its prevalence in 2.35–14.89% of children depending on their sex and age (Table 2, Fig. 4b). And based on the Orbegozo charts, the WHO charts overestimate this prevalence in 5.60–33.70%, depending on sex and age (Table 3). Similarly, the 97th percentile of the Orbegozo charts corresponds to a much higher percentile in the WHO charts (Table 2, Fig. 4c and d). If obesity is defined as a BMI above the 97th percentile,1 with the WHO charts as a reference the Orbegozo charts underestimate its prevalence in more than 2.5% of children in all age groups, with the differences reaching up to 4 orders of magnitude in some of them (Fig. 4d). With the Orbegozo charts as a reference, the WHO charts overestimate the prevalence of obesity in 0.06–12.21% of children, depending on age and sex (Table 3).
Charts officially applied in autonomous communitiesWith the exception of the Autonomous Community of Aragón (with charts based on local regional data7), most ACs use the Orbegozo charts. Three ACs (Valencia, Andalusia and Navarra) use the WHO charts in the CHB. The WHO charts are used in PCPMRs in 3 ACs, either as the sole reference (Navarra) or concurrently with the Orbegozo charts (Valencia, Castilla-León). The most updated charts of the Spanish Growth Study12–14 are not being applied in any of the ACs.
DiscussionGrowth charts that express data as percentiles are commonly used in paediatric practise. The value of a specific extreme percentile in the chart defines overweight, obesity, or underweight. The population, methodology and cut-off points used to develop a reference standard are of utmost importance, as they determine the sensitivity and specificity of each standard, and the threshold from which a value is considered pathological or unhealthy.31,32
The results of this study show that there are striking differences between the two analyzed standards (Orbegozo and WHO charts). Relative to the WHO charts, the Orbegozo charts underestimate overweight and obesity in every analyzed age group, overestimate malnutrition in the early years of life, and underestimate it at later ages. In most of the age groups under study, the 85th percentile of the Orbegozo charts corresponds to the 97th percentile or higher in the WHO charts for both sexes. Values that correspond to overweight according to the Orbegozo charts are in the obesity range in the WHO charts. In most age groups, the numerical value of the 97th percentile in the Orbegozo charts is located in percentiles above 99.99% in the WHO charts. Under these circumstances, a 3% prevalence of obesity based on the Orbegozo charts would correspond to a prevalence below 1 in 10000 based on the WHO charts. Therefore, obesity defined as a BMI above the 97th percentile in the Orbegozo charts would be considered a rare disease (prevalence below 1 in 10000 people as defined by the European Commission) using the WHO charts as a reference. When the numerical value of the 85th percentile of the WHO charts is used as a cut-off point in the Orbegozo charts, approximately 20% (17%–26%) of schoolchildren that would have been considered normal before would be labelled as patients with excess weight.
Another relevant finding is that the standard used in primary care to assess the growth of children in Spain varies depending on the AC where they reside. Most ACs use the Orbegozo charts, but some communities have been introducing the WHO charts in recent years.
The results of the Spanish Growth Study12–14 show that there are no appreciable regional differences in child growth, so the use of different standards in the various ACs does not seem to be justified.
The debate on which standard is most appropriate to assess child growth and the definition of the ideal cut-off points to define specific nutritional problems has been spurred in recent years for three reasons: the obesity epidemic in developed countries,6,33 the publication in 2006 of the WHO charts as a proposed worldwide standard,22–24 and the emergence of studies that question the usefulness of this proposal.14,17–19 A recent study in Europe34 showed that most primary care paediatricians used charts based on their domestic population, with only a minority (30%) using the WHO charts regularly in their practise.
There are methodological limitations to the WHO charts, as only the population 0–5 years of age met the criteria defined for advantageous conditions that allowed it to be considered an ideal standard (exclusive breastfeeding and no socioeconomic or health disadvantages). They may be particularly useful to monitor exclusively breastfed infants, especially when there is concern regarding adequate weight gain.25,35 Most experts recommend the use of charts based on national data for each country, especially in children older than 5 years, and using the WHO charts for international comparisons.12–14,17–19,35
In Spain, the official clinical practise guideline for preventing and treating obesity in children and adolescents33 recommends using the charts of the 1988 cross-sectional study of the Fundación Orbegozo,2 as they were developed before the increase in the prevalence of obesity, using the 90th and 97th percentiles for BMI as cutoffs for overweight and obesity, respectively. The values that define obesity and overweight according to this guideline correspond to percentiles below the 97th percentile in the recent Spanish Growth Study (between the 90th and 97th percentiles depending on age and sex) for obesity and approximately the 85th percentile for overweight.12–14 The values that define overweight in this guideline correspond to percentiles above the 97th percentile of the WHO charts for every age analyzed in this study (data not shown).
There are limitations to this study. It does not include data from an external population, so the changes in prevalence observed in reference to one of these two standards should only be taken into account when either the Orbegozo or the WHO charts are being used. In this context, Tables 2 and 3 may be a useful tool in clinical practise to see how an extreme percentile in one of the charts ranks in the other chart. The specific quantification of the impact on prevalence as a function of the standard applied to a given population will depend on the specific distribution of the variable being analyzed in that population, although the direction of the variation (increase or decrease) will be similar to the one obtained in this study. The data of field studies conducted in Spain are consistent with the data of our analysis.36,37
It is also important that we consider the limitations of using percentiles as a measurement. Percentiles are habitually used in clinical practise because their interpretation is straightforward and intuitive. However, any given interval of percentile values corresponds to different absolute changes in weight, height or BMI depending on where it is located in the distribution.31 Percentiles can be used to determine cutoffs for overweight or obesity (or if applicable underweight), but they cannot determine its degree. This limitation does not extend to the use of z-scores as a reference: a given interval in z-scores corresponds to a fixed difference in weight, height or BMI in children of a given age. Consequently, z-scores are a useful tool to determine the degree of obesity (or underweight).31 Despite these limitations, we based our analysis on percentiles because it is the most commonly used graphic representation of reference data in Spain.1–3,6–14
In short, our study showed, on one hand, that there are significant differences between the two standards for growth measurement and classification (Orbegozo and WHO charts), and on the other hand, that the reference used in the CHB and/or PCPMRs in Spain varies between autonomous communities, with no apparent justification for it. Ideally, a single chart with clearly emphasized “cut-off” percentiles would be used for anthropometric assessment in primary care across Spain. A consensus should be reached on which charts to use and the cut-off points to be applied for the definition of unhealthy or pathological values, as the available evidence is not strong enough to make decisions outside of a consensus.
Conflicts of interestThe authors have no conflicts of interest to declare.
The following paediatricians contributed information on the growth charts used in the child health book and/or primary care medical records of their respective autonomous communities:
- –
Andalusia: Ana Martínez Rubio, Guadalupe del Castillo Aguas, Juan Ruiz-Canela Cáceres.
- –
Aragón: Teresa Cenarro Guerrero.
- –
Asturias: José Ignacio Pérez Candás.
- –
Balearic Islands: Iciar Miranda Berrioatergortua.
- –
Canary Islands: Catalina Santana Vega.
- –
Cantabria: Alberto Bercedo Sanz.
- –
Castilla-La Mancha: Alicia Bonet Garrosa, Maria Angeles Olmos Berrocoso.
- –
Castilla-León: M. Mercedes Garrido Redondo.
- –
Catalonia: Elisa de Frutos Gallego.
- –
Extremadura: Cecilia Matilde Gómez Málaga.
- –
Galicia: Teresa Valls Durán.
- –
La Rioja: José Vicente Bernard Usoz, Francisco Escudero Gimenez.
- –
Madrid: María Aparicio Rodrigo.
- –
Murcia: Sebastian Lorente García.
- –
Navarra: Laura Borja Andreza, Jesus Soria Aznar.
- –
Basque Country: Pedro Jesús Gorrotxategi Gorrotxategi.
- –
AC of Valencia: Esther Serrano Poveda.
- –
Ceuta: Attila Saringer.
- –
Melilla: Maria Reyes Sauvirón.
We thank Eva Suárez Vicent (AC of Valencia) for distributing our request through the intranet of the AEPAP.
We thank Mirella Jané, Blanca Prats Viedma (Catalonia), Helena Naranjo (Madrid) and Teresa Jordán (Balearic Islands), for responding to the request we addressed to their respective AC Departments of Health.
Please cite this article as: Polo Martín P, Abellan JJ, Nájar Godoy MI, de Laviada Mulero TÁ. Tablas de crecimiento: impacto sobre la prevalencia de los trastornos nutritivos. An Pediatr (Barc). 2015;82:325–337.
