


The prevalence of diseases related to eating behaviour disorders has increased among adolescents. The objective of this study is to analyse the satisfaction with body weight of schoolchildren as regards their body mass index and the strategies used to control their diet.
MethodA total of 1197 students from secondary education (12–18 years) answered a questionnaire on eating habits and body weight control. Their weight and height were measured and body mass index was calculated.
ResultsMore than two-thirds (68.1%) of the students who had an adequate BMI were satisfied with their weight. Greater dissatisfaction with weight is associated with overweight (OR=10.23) and obesity (OR=16.60). Students with overweight are on a diet having consulted an expert such as a physician or even the family, whereas among schoolchildren with normal weight there is a large percentage on a diet without consultation. About 13.87% of the schoolchildren have undertaken compensatory activities due to excessive eating. An overweight BMI is associated, with more than twice the risk (OR>2.00), with the use of measures such as physical activity, vomiting, or fasting to compensate an excessive intake.
ConclusionsOverweight and obese schoolchildren are more likely to be dissatisfied with their body and are more likely to use ploys such as vomiting, in order to compensate for the excess intake.
Las enfermedades relacionadas con los trastornos del comportamiento alimentario han incrementado su prevalencia entre los adolescentes. El objetivo de este estudio es analizar la satisfacción con el peso corporal de los escolares en relación con su índice de masa corporal y las estrategias que utilizan para el control de la dieta.
MétodoMil novecientos noventa y siete alumnos de enseñanza secundaria obligatoria (12 a 18 años) contestaron un cuestionario sobre hábitos alimentarios y de control de peso corporal, además se les pesó y talló, y se calculó el índice de masa corporal.
ResultadosUn 68,1% de los escolares tiene una relación de satisfacción con su peso e índice de masa corporal adecuados, una mayor insatisfacción con el peso se asocia con el sobrepeso (OR=10,23) y obesidad (OR=16,60). Los alumnos con sobrepeso hacen dieta asesorándose principalmente por un médico o la familia, mientras que en los escolares con normopeso hay un amplio porcentaje que realiza dieta por su cuenta. Un 13,87% de los escolares ha realizado actividades compensatorias ante ingestas excesivas; un índice de masa corporal de sobrepeso se asocia a más del doble de riesgo (OR>2,00), con el empleo de medidas como la actividad física, el vómito o el ayuno para compensar una ingesta excesiva.
ConclusionesHay más posibilidades de insatisfacción corporal en los escolares con sobrepeso y obesidad. Los alumnos con sobrepeso tienen más posibilidades de utilizar maniobras, como el vómito, para compensar los excesos de ingesta.
At present, eating disorders (EDs) are the most frequent type of psychiatric disorder with physical repercussions and the third most common chronic disease in young women 15–19 years of age1 due to their increased prevalence and severe consequences for affected patients,2 and they have reached almost epidemic proportions in the young population of western countries.3
These disorders have a psychological and multifactorial aetiology,4 and the two that are best defined are anorexia nervosa (AN) and bulimia nervosa (BN).
Multiple factors are involved in the onset of EDs, each of which may be involved to a greater or lesser extent in the development or continuation of these diseases.1,5–8 There is growing evidence that age, self-concept and physical activity may play key roles in the pathogenesis of some EDs.9–12 There are additional specific factors, known as dietary factors, that are behind voluntary choices to lose weight.13
In this regard, EDs are closely associated, as a cause and/or effect, with changes in body image.14
Eating disorders are relatively more common in female adolescents and young women.11,15 The incidence of AN increased worldwide in the 20th century, especially in women 15–24 years of age; its incidence in Europe has remained stable since the 1970s, but it seems to have increased in some South American countries.16
In recent years, there has been evidence of an increase in the well-established clinical forms of EDs in Spain.17 The prevalence of AN is approximately 0.5–1%, peaking in the 15- to 24-year-old age group, while the prevalence of BN is higher, 2–3%,8,10,18 and the prevalence of eating disorders not otherwise specified (EDNOS) is approximately 2.7%; all of these percentages are lower in males.2,13,19,40 The prevalences found in males in the Spanish population are similar to those in other countries and comparable to the prevalence reported by the American Psychological Association, and 8.8% of adolescents are considered to be at risk.20
The combination of a negative body image with overvaluing body image is a predisposing factor for EDs14,21,22 associated with an increase in restrictive behaviours.23,24
Once we reviewed these data, the main aim of our study was to analyse the body image of compulsory secondary school (ESO) students in Badajoz, as well as their behaviours in relation to variables associated to weight control, using the body mass index (BMI) percentile to analyse its influence in these types of pathologies, in order to be able to implement strategies to prevent and control EDs.
Participants and methodsParticipantsWe conducted a quantitative epidemiological study with a non-experimental cross-sectional ex post facto design. Participants were selected by random cluster sampling. We estimated the sample size with a formula for finite or known populations with a confidence interval (CI) of 95.4%. We surveyed a total of 1197 participants, 49.9% of who were male (N=597) and 50.1% female (N=600); Table 1 summarises the characteristics of the sample.
General characteristics of the sample.
| N | % | |
|---|---|---|
| Sex | ||
| Male | 597 | 49.9 |
| Female | 600 | 50.1 |
| Age group | ||
| 12–13 | 514 | 42.9 |
| 14–15 | 508 | 42.4 |
| 16–18 | 175 | 14.6 |
| Socioeconomic status of the family | ||
| Low | 178 | 14.9 |
| Middle | 740 | 61.8 |
| High | 279 | 23.3 |
| Weight classification | ||
| Overweight (85–97) | 176 | 14.7 |
| Obesity (>97) | 62 | 5.2 |
| Normal weight (<85) | 959 | 80.1 |
We designed a quantitative questionnaire specifically for this study. Its contents were validated by an expert committee prior to its use. After analysing the responses, we studied their association with the BMI percentile of the respondents.
ProcedureTo collect the data we designed a software application in PHP and JavaScript linked to a database designed in MySQL. After the researcher explained the study to the participants and their informed consent was obtained, respondents filled out the questionnaire individually and anonymously in their classrooms, which took each participant approximately 7min. In addition, the weight and height of each participant were measured with a MB 201 Plus mechanical scale.
Statistical analysis of the dataWe performed a descriptive analysis and studied the association between variables by means of non-parametric mathematical models, as the variables for which we collected data were categorical. We analysed the association between variables by means of the chi-squared test and Cramer's V, and used adjusted standardised residuals (ASRs) to interpret the association between variables.25,26
Later on, we did a multinomial logistic regression model, calculating the odds ratios (ORs) with their respective 95% CIs to establish the strength of the association between the variables under analysis.
ResultsThe chi-square results showed associations between the analysed variables and the BMI (P<.05). Generally speaking, the calculation of Cramer's V27 found weak (φC between 0.100 and 0.299) and moderate (φC>0.300) associations that revealed trends in our study. We analysed the ASRs for a more detailed interpretation of these associations.
We found that 80.1% of the study participants had weights in the normal range, while 14.7% were in the overweight range and 5.2% in the obesity range. Of all students, 55.2% reported satisfaction with their weight and had a normal weight; there was a higher than expected proportion of satisfied students in this group (ASR=12.2). On the other hand, 9.1% and 3.8% of the total student sample had overweight and obesity, respectively, and were not satisfied with their weight because they considered it excessive; there was a higher than expected number of students for both of these situations (ASR>1.96).
Of all students, 40.1% expressed dissatisfaction with their weight; of these, 27.3% believed they had excess weight, while 12.8% believed their weight was too low. We found schoolchildren with an inappropriate association between their weight satisfaction and their BMI: 17.4% of participants with normal weight considered that their weight was excessive when it was healthy (ASR=14.7), while 27.3% of overweight students and 21.0% of obese students reported being satisfied with their weight (ASR<−1.96).
Of all students, 20.4% reported having dieted in the last year, of which 8.7% were overweight or obese, so that more overweight and obese students than expected had been on diets (ASR=5.7 and 9.2, respectively). Of all obese students, 33.9% reported not having dieted in the last year. At the time the data were collected, 9.44% of the students were on a diet, of which 5.2% were in the overweight or obesity groups. This was greater than the expected number of cases in the overweight and obesity groups (ASR=6.0 and 8.1, respectively).
A doctor or specialist in nutrition and dietetics was consulted by 16.58%. To analyse how diets were managed, we made a contingency table excluding students that had not dieted. Obese participants controlled their diet with the help of medical specialists (35.8%) or their mother or friends (37.7%). The ASRs indicated that this was more frequent than expected in the obesity group (ASR=4.1) and that this group had fewer than expected cases of students who dieted on their own (ASR=−2.8). Students with normal weights dieted on their own (43.8%) or were supervised by their mothers (34.8%); in this group of students there were fewer than expected cases of diets prescribed by a doctor or nutritionist (ASR=−3.5) and more cases than expected of students that dieted on their own (ASR=4.9).
Of all students, 39.93% reported engaging in other behaviours for weight control. The overweight and obesity groups had significantly higher proportions of students that engaged in behaviours other than dieting (ASR=5.7 and 6.8, respectively), while this proportion was smaller in the normal weight group (ASR=−9.2). Among the behaviours reported by obese students, there was a higher frequency of engaging in physical activity, doing some work, or finding ways to entertain themselves (ASR>1.96); while the proportion of normal weight students that used physical activity and sought ways to entertain themselves was smaller (ASR<−1.96). Fifteen students used vomiting as a strategy to manage food intake, with higher proportions found in the overweight and obesity groups.
Thirteen participants in the study had underweight (percentile <3rd), of which only one reported dieting at the time the data were collected, while 11 reported thinking their weight was too low, 2 satisfaction with their weight, and none the perception of having excess weight.
Of all participants, 53.05% reported eating more or between meals depending on their mood; 39.18% has felt regret for overeating, with higher proportions of students having felt regret in the overweight and obesity groups (ASR=6.2 and 5.0, respectively). The use of compensatory behaviours for excessive intake was reported by 13.87%, and greater proportions of overweight and obese students reported such behaviours (ASR=6.0 and 5.8, respectively). Strategies other than dieting were used by 38.7% of obese students and 28.4% of overweight students.
Twenty-three students (1.92% of the sample) engaged in vomiting to compensate for excessive eating. The highest proportion of students that used vomiting was found in the normal weight group, 1.2% of the total, although there were more students than expected with this behaviour in the overweight group (ASR=2.7). Also, 3.43% used fasting after excessive eating, which was reported by a lower proportion of the normal weight students (ASR=−2.7). Physical activity as a compensatory behaviour was reported by 9.18% of the participants, and this behaviour was found in higher proportions of students in the overweight and obesity groups (ASR=4.9 and 5.9, respectively) (Table 2).
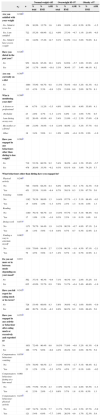
Measure of association and percentages for the association of BMI and variables pertaining to satisfaction with body weight and strategies used for weight control.
| Normal weight <85 | Overweight 85–97 | Obesity >97 | |||||||||
|---|---|---|---|---|---|---|---|---|---|---|---|
| φC | n | % total | % BMI | ASR | % total | % BMI | ASR | % | % BMI | ASR | |
| Are you satisfied with your weight | 0.306b | ||||||||||
| No. I think it is too low | 154 | 10.9% | 13.7% | 1.6 | 1.6% | 10.8% | −0.9 | 0.3% | 6.5% | −1.5 | |
| Yes. I am satisfied | 722 | 55.2% | 68.9% | 12.2 | 4.0% | 27.3% | −9.7 | 1.1% | 21.0% | −6.5 | |
| No. I think I have excess weight | 321 | 14.0% | 17.4% | 14.7 | 9.1% | 61.9% | 11.4 | 3.8% | 72.6% | 8.4 | |
| Have you dieted in the past year? | 0.326b | ||||||||||
| No | 952 | 68.4% | 85.4% | 10.1 | 9.4% | 63.6% | −5.7 | 1.8% | 33.9% | −9.2 | |
| Yes | 245 | 11.7% | 14.6% | −10.1 | 5.3% | 36.4% | 5.7 | 3.4% | 66.1% | 9.2 | |
| Are you currently on a diet | 0.305b | ||||||||||
| No | 1084 | 75.9% | 94.7% | 9.8 | 11.5% | 78.4% | −6.0 | 3.2% | 61.3% | −8.1 | |
| Yes | 113 | 4.3% | 5.3% | −9.8 | 3.2% | 21.6% | 6.0 | 2.0% | 38.7% | 8.1 | |
| Who is monitoring your diet? | 0.308b | ||||||||||
| A doctor or professional | 64 | 6.7% | 11.2% | −3.5 | 4.9% | 19.0% | 0.8 | 4.9% | 35.8% | 4.1 | |
| Herbalist | 23 | 2.8% | 4.7% | −1.3 | 2.1% | 8.0% | 1.0 | 1.0% | 7.5% | 0.5 | |
| I am dieting on my own | 132 | 26.4% | 43.8% | 4.9 | 5.4% | 21.0% | −3.2 | 2.3% | 17.0% | −2.8 | |
| My mother or a friend | 149 | 21.0% | 34.8% | −1.9 | 12.4% | 48.0% | 2.2 | 5.2% | 37.7% | −0.1 | |
| Other | 18 | 3.4% | 5.6% | 1.1 | 1.0% | 4.0% | −0.4 | 0.3% | 1.9% | −1.0 | |
| Have you engaged in any behaviours other than dieting to lose weight? | 0.269b | ||||||||||
| No | 719 | 53.3% | 66.5% | 9.2 | 5.4% | 36.9% | −6.8 | 1.3% | 25.8% | −5.7 | |
| Yes | 478 | 26.8% | 33.5% | −9.2 | 9.3% | 63.1% | 6.8 | 3.8% | 74.2% | 5.7 | |
| What behaviours other than dieting have you engaged in? | |||||||||||
| Physical activity | 0.246b | ||||||||||
| No | 746 | 54.6% | 68.2% | 8.4 | 6.0% | 40.9% | −6.3 | 1.7% | 32.3% | −5.0 | |
| Yes | 451 | 25.5% | 31.8% | −8.4 | 8.7% | 59.1% | 6.3 | 3.5% | 67.7% | 5.0 | |
| Vomiting | 0.040 | ||||||||||
| No | 1182 | 79.3% | 99.0% | 1.3 | 14.4% | 97.7% | −1.3 | 5.1% | 98.4% | −0.3 | |
| Yes | 15 | 0.8% | 1.0% | −1.3 | 0.3% | 2.3% | 1.3 | 0.1% | 1.6% | 1.3 | |
| Reading | |||||||||||
| No | 1180 | 79.1% | 98.7% | 1.0 | 14.4% | 97.7% | −1.0 | 5.1% | 98.4% | −0.1 | |
| Yes | 17 | 1.0% | 1.3% | −1.0 | 0.3% | 2.3% | 1.0 | 0.1% | 1.6% | 1.0 | |
| Doing work | 0.073a | ||||||||||
| No | 1171 | 78.7% | 94.4% | 1.9 | 14.3% | 90.3% | −0.7 | 4.8% | 87.1% | 2.4 | |
| Yes | 26 | 1.4% | 5.6% | −1.9 | 0.4% | 9.7% | 0.7 | 0.3% | 12.9% | 2.4 | |
| Finding a way to entertain myself | 0.082a | ||||||||||
| No | 1118 | 75.6% | 94.4% | 2.7 | 13.3% | 90.3% | −1.8 | 4.5% | 87.1% | −2.1 | |
| Yes | 79 | 4.5% | 5.6% | −2.7 | 1.4% | 9.7% | 1.8 | 0.7% | 12.9% | 2.1 | |
| Do you eat more or in between meals depending on your mood? | 0.033 | ||||||||||
| No | 562 | 37.1% | 46.3% | −0.9 | 7.1% | 48.3% | 0.4 | 2.8% | 53.2% | 1.0 | |
| Yes | 635 | 43.0% | 53.7% | 0.9 | 7.6% | 51.7% | −0.4 | 2.4% | 46.8% | −1.0 | |
| Have you felt regret for eating much or in excess? | 0.242b | ||||||||||
| No | 728 | 53.4% | 66.6% | 8.3 | 5.8% | 39.8% | −6.2 | 1.6% | 30.6% | −5.0 | |
| Yes | 469 | 26.7% | 33.4% | −8.3 | 8.9% | 60.2% | 6.2 | 3.6% | 69.4% | 5.0 | |
| Have you engaged in any activity or behaviour after eating much or excessively and regretted it? | 0.255b | ||||||||||
| No | 1031 | 72.4% | 90.4% | 8.6 | 10.5% | 71.6% | −6.0 | 3.2% | 61.3% | −5.8 | |
| Yes | 166 | 7.7% | 9.6% | −8.6 | 4.2% | 28.4% | 6.0 | 2.0% | 38.7% | 5.8 | |
| Compensatory behaviour: vomiting | 0.079a | ||||||||||
| No | 1174 | 78.9% | 98.5% | 2.3 | 14.0% | 95.5% | −2.7 | 5.1% | 98.4% | 0.2 | |
| Yes | 23 | 1.2% | 1.5% | −2.3 | 0.7% | 4.5% | 2.7 | 0.1% | 1.6% | −0.2 | |
| Compensatory behaviour: fasting at a later meal | 0.068 | ||||||||||
| No | 1156 | 77.9% | 97.2% | 2.3 | 13.9% | 94.3% | −1.8 | 4.8% | 93.5% | −1.3 | |
| Yes | 41 | 2.3% | 2.8% | −2.3 | 0.8% | 5.7% | 1.8 | 0.3% | 6.5% | 1.3 | |
| Compensatory behaviour: physical activity | 0.235b | ||||||||||
| No | 1197 | 74.7% | 93.2% | 7.7 | 11.7% | 79.5% | −4.9 | 3.5% | 67.7% | −5.9 | |
| Yes | 121 | 5.4% | 6.8% | −7.7 | 3.0% | 20.5% | 4.9 | 1.7% | 32.3% | 5.9 | |
Overweight and obesity were significantly associated (P<.05) to dissatisfaction with body weight (ORs of 10.23 and 16.60, respectively) (Table 3). We found an association between overweight students and dissatisfaction with a weight perceived as too low, which denotes a distorted body image relative to the reference group (OR=1.94). Compared to the normal weight group, overweight and obese students were more likely to have dieted in the past year and to be currently dieting (ORs ranging from 3.70 to 13.92), and the risk of dieting was considerably greater in the obesity group.
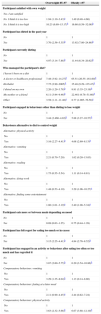
Results of the multinomial logistic regression model (OR and 95% CI) of the association between BMI and the classification of the different variables of the questionnaire regarding satisfaction with body weight and the strategies used for weight control.
| Overweight 85–97 | Obesity >97 | |
|---|---|---|
| Participant satisfied with own weight | ||
| Yes. I am satisfied | ||
| No. I think it is too low | 1.94 (1.10–3.43)a | 1.49 (0.48–4.66) |
| No. I think it is too high | 10.23 (6.89–15.17)b | 16.60 (8.59–32.08)b |
| Participant has dieted in the past year | ||
| No | 1 | 1 |
| Yes | 3.70 (2.56–5.35)b | 13.92 (7.80–24.86)b |
| Participant currently dieting | ||
| No | 1 | 1 |
| Yes | 4.97 (3.14–7.88)b | 11.44 (6.34–20.62)b |
| Who managed the participant's diet? | ||
| I haven’t been on a diet | 1 | 1 |
| A doctor or healthcare professional | 7.48 (3.92–14.27)b | 65.51 (26.55–161.60)b |
| Herbalist | 7.75 (2.99–2005)b | 35.48 (9.29–135.47)b |
| I dieted on my own | 2.20 (1.29–3.78)b | 8.81 (3.35–23.19)b |
| My mother or a friend | 6.11 (3.94–9.46)b | 22.461 (9.78–51.60)b |
| Other | 3.58 (1.11–11.48)a | 8.77 (1.005–76.58)a |
| Participant engaged in behaviours other than dieting to lose weight | ||
| No | 1 | 1 |
| Yes | 3.44 (2.460–4.82)b | 5.88 (3.27–10.57)b |
| Behaviours alternative to diet to control weight | ||
| Alternative: physical activity | ||
| No | 1 | 1 |
| Yes | 3.16 (2.27–4.41)b | 4.68 (2.69–8.13)b |
| Alternative: vomiting | ||
| No | 1 | 1 |
| Yes | 2.21 (0.70–7.20) | 1.62 (0.20–13.03) |
| Alternative: reading | ||
| No | 1 | 1 |
| Yes | 1.75 (0.55–5.54) | 1.11 (0.14–8.81) |
| Alternative: doing work | ||
| No | 1 | 1 |
| Yes | 1.48 (0.53–4.10) | 3.29 (1.06–10.27)a |
| Alternative: finding some entertainment | ||
| No | 1 | 1 |
| Yes | 1.80 (1.01–3.19)a | 2.40 (1.08–5.34)a |
| Participant eats more or between meals depending on mood | ||
| No | 1 | 1 |
| Yes | 0.89 (0.63–1.25) | 0.75 (0.44–1.28) |
| Participant has felt regret for eating too much or in excess | ||
| No | 1 | 1 |
| Yes | 3.15 (2.25–4.41)b | 4.84 (2.76–8.52)b |
| Participant has engaged in an activity or behaviour after eating too often or too much and has regretted it | ||
| No | 1 | 1 |
| Yes | 3.87 (2.60–5.75)b | 6.20 (3.54–10.86)b |
| Compensatory behaviour: vomiting | ||
| No | 1 | 1 |
| Yes | 3.29 (1.35–8.04)b | 1.13 (0.14–8.80) |
| Compensatory behaviour: fasting at a later meal | ||
| No | 1 | 1 |
| Yes | 2.11 (0.99–4.45)a | 2.44 (0.82–7.24) |
| Compensatory behaviour: physical activity | ||
| No | 1 | 1 |
| Yes | 3.63 (2.32–5.68)b | 6.67 (3.68–12.10)b |
Odds ratio adjusted for sex, age and socioeconomic level. The comparison group is the “normal weight” group.
The supervision of the diet of overweight and obese students by another individual was significantly higher compared to students that had not been on a diet. But the calculated ORs showed that the probabilities that their diet was being supervised by a healthcare professional, a herbalist or a family member (ORs from 8.81 to 65.51) were very high. We observed a similar trend in overweight students, although their probabilities were not as high (ORs from 2.20 to 7.75).
In addition to dieting, overweight and obese students were likely to engage in alternative behaviours to lose weight (OR, 3.16 and 4.68, respectively), and more likely to use physical activity, entertainment and work (in the case of obese students) to control their weight. We did not find a significant risk of engaging in behaviours involving self-induced vomiting.
We found a significant risk in both the overweight and the obesity group of feeling regret for eating a lot or in excess (OR 3.15 and 4.84, respectively). Overweight students engaged in the greatest number of compensatory behaviours: physical activity (3.63), vomiting (3.29) and fasting at later meals (2.11). Obese students also engaged in compensatory behaviours (6.20) but they only had a statistically significant greater probability of engaging in physical activity (6.67). Overweight students were more likely to engage in a greater number of behaviours and strategies to compensate for days of excessive eating, some of which were dangerous, like vomiting.
DiscussionA large percentage of the sample had normal weights (80.1%) and one-fifth were in the overweight or the obesity range, results that are better than those of other studies conducted in Spain.28–30
Satisfaction with body weight and body mass indexAlthough the associations we found were weak, our findings were consistent with the trends observed in other studies of national31,32 and international33 scope, which found similar percentages of individuals that perceived their body weight correctly. In our sample, 55.2% of the students reported satisfaction with their weight and also had a normal weight. High percentages of students in the overweight and obesity groups were dissatisfied because they perceived they had excess weight. All of these, which amounted to 68.1% of the sample, had an adequate perception of their weight based on their level of satisfaction in relation to their BMI. This trend has also been observed in other studies.34 We found moderate associations between the different BMI groups and body dissatisfaction,35 results that were corroborated by the greater probability of body dissatisfaction in overweight and obese students compared to students with normal weights. Other studies that compared self-image (assessed by means of figure drawings) and BMI have obtained similar results.34
The percentage of body dissatisfaction in our study was much lower (39.68%) than that found in another Spanish study, in which 73% of secondary school students reported they would like to change their body image, although the latter study was analysing body image as a whole and not just weight, which would account for the differences between the two.36 Nevertheless, we found a greater percentage than expected of students that thought they had excess weight in every group analysed, a finding that was particularly surprising in the normal weight group, as it reveals dissatisfaction despite having an appropriate BMI.
DietingOnly 9.44% of the students were dieting at the time of the study, and 20.47% had dieted in the past year. When we compared our results with those of a study conducted in a similar population,37 we noticed that there was a higher percentage of students that dieted in Badajoz. Our results showed an association of dieting with overweight and obesity,38 with a lower percentage of dieting students in the normal weight group.
Among the participants in the study were 13 schoolchildren with underweight (below the 3rd percentile) of which only 1 was dieting at the time the data were collected, 11 perceived their weight as too low, 2 were satisfied with their weight, and none perceived having excess weight. The proportion of students that dieted in the overweight and obese groups was greater than expected, suggesting an awareness of excess weight.
The percentage of adolescents that consulted the family physician to go on a diet was very low; however, there was a higher proportion of students with obesity that sought weight control services under medical supervision.36 This is an important aspect, as there is evidence that a high percentage of parents have difficulty recognising or detecting obesity in their children.29 Our data corroborated the findings presented at the XVIII Congress of the Spanish Society of Family and Community Medicine (SEMFYC),36 showing that most secondary school students in Badajoz who want to lose weight seek the advice of their mother or a friend, or go on diets on their own without prior consultation with a professional, which poses numerous risks to their health. The low percentage of normal weight dieters supervised by a professional compared to the high percentage that diet without supervision is worrisome, as these adolescents do not need to be on a weight loss diet.
Compensatory behaviours for excessive intakesOf all students, 13.87% reported behaviours aimed at compensating excess weight. The one positive aspect is that the most frequent behaviour to compensate overeating was engaging in physical activity (9.18%), as this is the healthiest behaviour. We also observed that this habit was associated with overweight and obesity.
Vomiting was used by 23 schoolchildren (1.92% of the sample) as a compensatory behaviour for excessive eating. These attitudes may be symptomatic of EDs. We found that the risk of exhibiting these behaviours was three times greater in overweight students than in students with normal weights. This behaviour was not observed in the obesity group, with the adjusted standardised residues revealing that the proportion in this group was lower than expected, which diverges from the findings of other studies.39 As we can see, the percentage of students that reported self-inducing vomiting was higher for the item “compensatory behaviour, eating a lot or in excess” than for the question “What behaviours other than dieting have you engaged in?” (1.92% and 1.25%, respectively). This increase is expected and is usually found in psychiatric questionnaires when questions are worded in different ways. These percentages are below the 2–3% range found in nationwide studies17,18,40 and are within the 1–3% range recommended by the American Psychiatric Association,40 while they are higher than the 0.8% reported by other studies also conducted in Spain.2,13
Fasting was used by 3.43% after overeating to compensate for the excessive caloric intake. The ORs suggested that the risk of this behaviour occurring in overweight students is twice as high as that of normal weight students. The compensatory behaviour of fasting at a subsequent meal is worrisome, as it can be harmful in varying degrees depending on which meal is skipped and how many hours the fast lasts.
According to the collected data, students with overweight have the highest percentage of bulimic traits, a finding that is supported by others studies in populations of very similar characteristics.31
Among the limitations of the study are the width of the CIs used in the logistic regression analysis, which could be affected by the established CI or even the sample size or the subsets of the sample established for the adjustments more than by the chosen model. However, this study can assess the degree of change based on the characteristics of the analysed variables.
Conflicts of interestThe authors have no conflicts of interest to declare.
Please cite this article as: Córdoba Caro LG, Luengo Pérez LM, Feu S, García Preciado V. Satisfacción con el peso y rasgos de trastorno del comportamiento alimentario en secundaria. An Pediatr (Barc). 2015;82:338–346.
